Trend Targets [AlgoAlpha]OVERVIEW
This script combines a smoothed trend-following model with dynamic price rejection logic and ATR-based target projection to give traders a complete visual framework for trading trend continuations. It overlays on price and automatically detects potential trend shifts, confirms rejections near dynamic support/resistance, and displays calculated stop-loss and take-profit levels to support structured risk-reward management. Unlike traditional indicators that only show trend direction or signal entries, this tool brings together a unique mix of signal validation, volatility-aware positioning, and layered profit-taking to guide decision-making with more context.
CONCEPTS
The core trend logic is built on a custom Supertrend that uses an ATR-based band structure with long smoothing chains—first through a WMA, then an EMA—allowing the trend line to respond to major shifts while ignoring noise. A key addition is the use of rejection logic: the script looks for consolidation candles that "hug" the smoothed trend line and counts how many consecutive bars reject from it. This behavior often precedes significant moves. A user-defined threshold filters out weak tests and highlights only meaningful rejections.
FEATURES
Trend Detection : Automatically identifies trend direction using a smoothed Supertrend (WMA + EMA), with shape markers on trend shifts and color-coded bars for clarity.
Rejection Signals : Detects price rejections at the trend line after a user-defined number of consolidation bars; plots ▲/▼ icons to highlight strong continuation setups.
Target Projection : On trend confirmation, plots entry, stop-loss (ATR-based), and three dynamic take-profit levels based on customizable multiples.
Dynamic Updates : All levels (entry, SL, TP1–TP3) auto-adjust based on volatility and are labeled in real time on the chart.
Customization : Users can tweak trend parameters, rejection confirmation count, SL/TP ratios, smoothing lengths, and appearance settings.
Alerts : Built-in alerts for trend changes, rejection events, and when TP1, TP2, or TP3 are reached.
Chart Overlay : Plots directly on price chart with minimal clutter and clearly labeled levels for easy trading.
USAGE
Start by tuning the Supertrend factor and ATR period to fit your asset and timeframe—higher values will catch bigger swings, lower values catch faster moves. The confirmation count should match how tightly you want to filter rejection behavior—higher values make signals rarer but stronger. When the trend shifts, the indicator colors the bars and line accordingly, and if enabled, plots the full entry-TP-SL structure. Rejection markers appear only after enough qualifying bars confirm price pressure at the trend line. This is especially useful for continuation plays where price retests the trend but fails to break it. All calculations are based on volatility (ATR), so targets naturally adjust with market conditions. Add alerts to get notified of important signals even when away from the chart.
Search in scripts for "supertrend"

MarktQuants Supertrend"MarktQuants Supertrend" is an indicator designed to help traders visualize market trends using a combination of moving averages and dynamic range calculations. It adapts to market conditions, providing insights into potential trend directions:
Trend Identification:
Utilizes a customizable moving average (MA Type) with options like SMA, EMA, SMMA, WMA, VWMA, TEMA, DEMA, LSMA, HMA, or ALMA to smooth price action.
Calculates a dynamic range based on the highest high over a specified period (Length), adjusted by multipliers (Multiplier Alpha and Multiplier Beta).
Signal Generation:
The indicator assesses price relative to both the moving average and the calculated range (Average Range or Lookback Alpha and Beta).
Scores are computed to determine if the price action suggests a long (bullish) or short (bearish) trend via crossover signals from these scores.
Visual Indicators:
Candlesticks: The color changes based on the trend direction; greenish for long conditions and purplish for short conditions, enhancing visual trend recognition.
Moving Average Line: Plotted in semi-transparent color matching the trend, with a bold line for clarity.
Range Indicator: A line representing the average range, filled with semi-transparent color to show potential support or resistance levels.
Customization:
Users can toggle between using the average range or specific lookback periods for trend signals via the Use Average Range option.
Adjustable parameters for the moving average and range calculations allow for fine-tuning to various market instruments or trading styles.
Inputs:
Range Settings:
Length: Defines the period for calculating the highest high.
Lookback Alpha & Lookback Beta: Different lookback periods for range calculation.
Multiplier Alpha & Multiplier Beta: Multipliers for adjusting the range.
Use Average Range: Switch to use average or specific range for signals.
Source: Pick the preferred source for the range calculations.
Moving Average Settings:
Type: Choice of moving average type.
Length: Length of the moving average.
Source: The price source for the moving average calculation (default is close price).
Alert Options:
MQ - Supertrend Long for Long trades (Buy) when the Long Condition is met.
MQ - Supertrend Short for Short trades (Sell) when the Short Condition is met.
Note: This indicator is best used alongside other analysis tools to confirm trends and signals. Always consider the broader market context.

Pivot Points + Day First Candle Breakout + VWAP + Supertrend This indicator amalgamates several key indicators to provide a comprehensive analysis for trading decisions, including SuperTrend, Pivot Points, VWAP, along with the Day First Candle Breakout strategy.
Key Features:
Day First Candle Breakout: Identifies potential breakout opportunities based on the first candle of the trading day. It utilizes the high and low of the initial trading range to determine entry points.
Timeframe Selection: Allows users to select the timeframe for analyzing the first candle (e.g., 5, 15, or 60 minutes).
Previous Day and Week High/Low: Displays the high and low of the previous day and week to provide additional context for trading decisions and assess the strength of the trend.
Trend Strength Analysis: Indicates whether the current price is above or below the previous day's high or low, signaling a stronger bullish or bearish trend respectively.
SuperTrend Indicator: Visualizes the trend direction and potential reversal points based on the SuperTrend indicator. It helps traders to stay aligned with the prevailing trend and avoid premature exits.
Pivot Points: Presents key support and resistance levels derived from Pivot Points, assisting traders in identifying potential reversal or breakout zones.
VWAP (Volume Weighted Average Price): Plots VWAP to provide insight into the average price traded over a given period, aiding in determining the fair value of the asset and potential buying/selling zones.
Trading Signals:
Buy Signal: Triggered when the price exceeds the high of the initial trading range after an upward price gap.
Sell Signal: Generated when the price falls below the low of the initial trading range after a downward price gap.
Caveats for Effective Trading:
Extended Trading Ranges: Adjusts support and resistance levels if the initial trading range extends beyond the defined timeframe.
Morning Noise Consideration: Exercises caution during volatile morning sessions to avoid false breakouts and whipsaws.
Pullbacks and Narrow Range Bars: Looks for opportunities during pullbacks or when the price forms narrow range bars to enter trades, reducing the risk of sudden reversals.

kyle algo v1
Integration of multiple technical indicators: The strategy mainly combines two technical indicators - Keltner Channels and Supertrend, to generate trading signals. It also calculates fifteen exponential moving averages (EMAs) for the high price with different periods ranging from 9 to 51.
Unique combination of indicators: The traditional Supertrend typically uses Average True Range (ATR) to calculate its upper and lower bands. In contrast, this script modifies the approach to use Keltner Channels instead.
Flexible sensitivity adjustment: This strategy provides a "sensitivity" input parameter for users to adjust, which controls the multiplier for the range in the Supertrend calculation. This can make the signals more or less sensitive to price changes, allowing users to tailor the strategy to their own risk tolerance and trading style.
EMA Energy Representation: The code offers a visualization of "EMA Energy", which color-codes the EMA lines based on whether the closing price is above or below the EMA line. This can provide an intuitive understanding of market trends.
Clear visual signals: The strategy generates clear "BUY" and "SELL" signals, represented as labels on the chart. This makes it easy to identify potential entry and exit points in the market.
Customizable: The script provides several user inputs, making it possible to fine-tune the strategy according to different market conditions and individual trading preferences.
EMA (Exponential Moving Average) Principle:
The EMA is a type of moving average that assigns more weight to the most recent data.
It responds more quickly to recent price changes and is used to capture short-term price trends.
Principle of Color Change :
In this trading strategy, the color of the EMA line changes based on whether the closing price is above or below the EMA. If the closing price is above the EMA, the EMA line turns green,
indicating an upward price trend. Conversely, if the closing price is below the EMA, the EMA line turns red,
indicating a downward price trend. These color changes help traders to more intuitively identify price trends
In short, our team provides a lot of practical space
That is your development space

Dodge Trend [MyTradingCoder]Introducing the "Dodge Trend" indicator, an innovative variant of the Supertrend indicator designed to help traders better avoid fakeouts and maintain positions in established trends.
Like the Supertrend, the Dodge Trend uses Average True Range (ATR) but incorporates a unique adaptive adjustment feature that differentiates it from its counterparts. While the conventional Supertrend rises with the trend and only descends when the price crosses it, the Dodge Trend is designed to 'dodge' potential fakeouts.
This 'dodging' mechanism works by allowing the Dodge Trend to fall slightly during pullbacks, reducing the risk of a premature exit due to a temporary price drop. The recovery rate after the pullback is quicker but is slightly lower than the rate at which a new Dodge Trend high would be established in an uptrend. This unique adjustment feature allows the Dodge Trend to chase price action in an exponential fashion, potentially enabling a quicker exit when the trend shifts.
Key Settings:
Length: Adjust how much price action is taken into consideration for the ATR average. Lower values yield higher responsiveness to recent price action.
Size: Determines the initial deviation of the Dodge Trend when it resets after every flip/break.
Source: Specifies the data point (close, high, open, low, hl2, etc.) used for the Dodge Trend.
Dodge Intensity: Adjusts the intensity of the pullback effect. Higher values result in more intense pullbacks. Range is limited between 0 and 99, with 95 as the recommended default.
Bullish Color Setting: Sets the color for the uptrend Dodge Trend.
Bearish Color Setting: Sets the color for the downtrend Dodge Trend.
Dodge Trend is a powerful tool for traders looking to ride trends and avoid unnecessary exits due to short-term price fluctuations. While it offers a unique feature that may potentially improve trading outcomes, it should be used in conjunction with other indicators and analysis methods for a comprehensive trading strategy. As with all tools, it does not guarantee profitable trades but aims to give traders more actionable and precise information to base their decisions on.
Experience trend-following in a more adaptive and efficient manner with the Dodge Trend indicator, a tool designed to help you 'dodge' false exits and stay in line with the overall trend.

CPR with MAs, Super Trend & VWAP by MackraniThis script will allow to add CPR with Standard Pivots and 4 Indicators.
Standard Pivot has 9 levels of support and 9 levels of resistance lines. It has CPR , 3 levels of Day-wise pivots , 3 levels of Weekly pivots and 3 Levels of Monthly Pivots .
In Addition to the CPR and Pivot , this script will allow user to Add 4 more Indicators - SMA , EMA , VWAP and SuperTrend as well.
All the Support and resistance levels can be enabled / disabled from settings. It will allow to select multiple combinations of support and resistance levels across 3 levels at any of the 3 time-frames individually and combined.
All 4 Indicators can be can be enabled / disabled from settings. This will allow the indicators to be plotted individually and combined along with any combination of CPR & Pivots .
These number of combinations will allow user to visualize the charts with desired indicators, pivot support & resistance levels on all or any of the 3 time frames.
For Ease of access, listed few points on how the script works..
- CPR and day-wise level 1 & 2 (S1 & R1) enabled by default and can be changed from settings
- Day-wise Level 2 & 3 (S2, R2, S3 & L3) can be enabled from settings
- Weekly 3 levels and Monthly 3 levels can be enabled from settings
- CPR & pivot levels colored in blue lines
- All support levels colored in Green
- All resistance levels Colored in Red
- Day-wise pivot , support & resistance are straight lines
- Weekly pivot , support & resistance are cross (+) lines
- Weekly pivot , support & resistance are circle (o) lines
- SMA , EMA , VWAP and SuperTrend Enabled by Default
- SMA Colored in Orange
- EMA Colored in Red
- EMA Colored in Teal
- SuperTrend Colored in standard Red & Green with triangle arrows
- Any combinations can be selected from settings-> Inputs & style

QuantBot 2: Reverse Supertrend This is the 2nd indicator from QuantBot
This indicator basically checks multi timeframe supertrend and When the smaller timeframe supertrend is bearish while the higher timeframe supertrend is bullish it gives BUY signal and vice versa.
This is good for finding suitable entries in the direction of trend.
To get the access please text me in the chatbox, ACCESS is given for FREE.
This is purely for charting purpose, if you find it useful please let me know in the comment box below.
If you want me to code any particular strategy please mention this in the comment box.

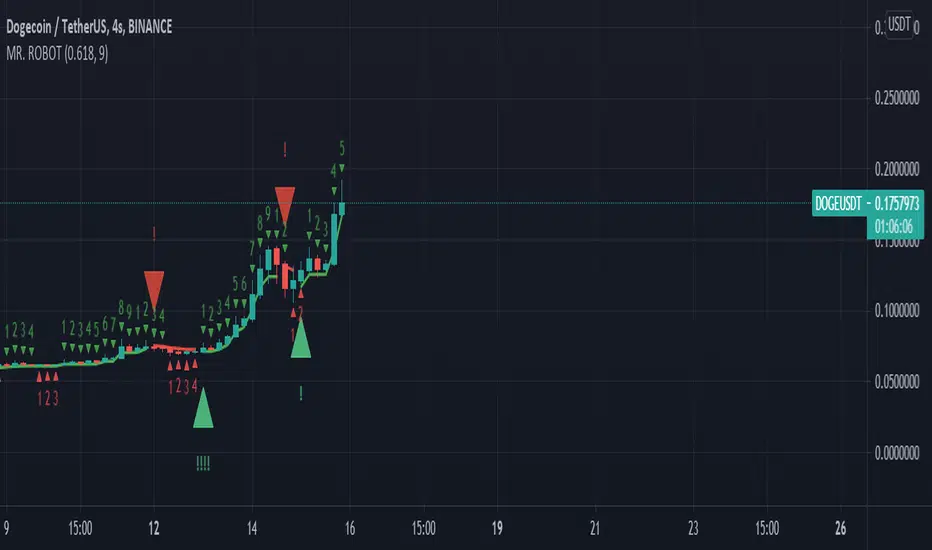
MR. ROBOT v.1.0.0This script consists of a logical blend of TD Sequental, MACD and Stochastic RSI based on the Supertrend function. In addition, these indicators use the golden proportional point of each candle as a source.
The exclamations on the signal indicating signs express the strength of the signal and consist of four levels;
! : Weak level signal
!! : Partial level signal
!!! : Medium signal
!!!! : High level signal
The fact that these interjections refer to four different levels is related to the programmatic consideration of four different indicators and functions. Since the script is based on four different indicators
basically, the exclamation numbers of the signals are related to how many indicators are signaling at the same time. However, it does not always overlap. For example, when 3 indicators signal at the same time, 3 exclamation points may not appear on the signal sign. This is because the script also takes into account special bar algorithms.
The only setting that you can intervene on the script - for now - is the multiplier and length values of the supertrend function. Changing these settings changes the signal strengths and frequencies. The script is based on the supertrend function alone, it is the ability to follow the trend after the signals given by the internal indicators. This situation decreases the rate of false signals and frequent signals in internal indicators.
This script or its author is not responsible in any way for any profits or losses arising from transactions. Does not contain investment advice.
Super SSLSuper SSL Indicator.
SSL + SuperTrend signal filtering.
Signals are delivered by SSL, signals are then filtered out by SuperTrend, in the nnfx way of trading (C1 = SSL, C2 = ST).
SSL deliver signals. Supertrend filter them.
Included 1CR rule option : in the nnfx way, we allow C2 to agree 1 candle later.
Some configuration settings of this tool pass the VP's 5 benchmark (can't be used to pass the private group admission though).

CPR with SMA, EMA, VWAP & Super Trend by GuruprasadMeduriThis script will allow to add CPR with Standard Pivots and 4 Indicators.
Standard Pivot has 9 levels of support and 9 levels of resistance lines. It has CPR , 3 levels of Day-wise pivots , 3 levels of Weekly pivots and 3 Levels of Monthly Pivots .
In Addition to the CPR and Pivot, this script will allow user to Add 4 more Indicators - SMA, EMA, VWAP and SuperTrend as well.
All the Support and resistance levels can be enabled / disabled from settings. It will allow to select multiple combinations of support and resistance levels across 3 levels at any of the 3 time-frames individually and combined.
All 4 Indicators can be can be enabled / disabled from settings. This will allow the indicators to be plotted individually and combined along with any combination of CPR & Pivots.
These number of combinations will allow user to visualize the charts with desired indicators, pivot support & resistance levels on all or any of the 3 time frames.
For Ease of access, listed few points on how the script works..
- CPR and day-wise level 1 & 2 (S1 & R1) enabled by default and can be changed from settings
- Day-wise Level 2 & 3 (S2, R2, S3 & L3) can be enabled from settings
- Weekly 3 levels and Monthly 3 levels can be enabled from settings
- CPR & pivot levels colored in blue lines
- All support levels colored in Green
- All resistance levels Colored in Red
- Day-wise pivot , support & resistance are straight lines
- Weekly pivot , support & resistance are cross (+) lines
- Weekly pivot , support & resistance are circle (o) lines
- SMA, EMA, VWAP and SuperTrend Enabled by Default
- SMA Colored in Orange
- EMA Colored in Red
- EMA Colored in Teal
- SuperTrend Colored in standard Red & Green with triangle arrows
- Any combinations can be selected from settings-> Inputs & style

nTrend ULTIMATEHello traders
With this fabulous script, you can color the candles based on the indicator and timeframe you want
You can only apply one indicator at a given time obviously
The list of indicators are the following:
- Price vs Moving Average : if price is above, bullish color, if price is below, bearish color
- Trend Signal : if the Trend signal is pointing upwards, bullish color, if the Trend signal is point downwards, bearish color
- Supertrend : if supertrend is below the price, bullish color, if supertrend is above the price, bearish color
- MACD : if MACD is positive, bullish color, if MACD is negative, bearish color
- MACD ZERO LAG : if MACD ZERO LAG is positive, bullish color, if MACD ZERO LAG is negative, bearish color
- MM Cross : if MM cross is bullish , bullish color, if MM cross is bearish , bearish color
- Ichimoku: if price is above the cloud, bullish color, if price is below the cloud, bearish color
Hope you'll like it
Please feel free to comment to ask me to add any other indicator you like or simply to say how much you love it.
Positive vibes are always appreciated and will encourage me to give you more free content.
Dave

High Aggregate Supertrend [jwammo12]This script adds an aggregate input to Supertrend to provide a Supertrend that approximates a higher time frame, but updates on the current time frame and therefore is more responsive.
The aggregate input acts as a multiplier on the current time frame, so an aggregate of 4 on a 1h chart would approximate a supertrend with the same parameters on a 4h chart by aggregating the last 4 bars into one bar.

CRR Smart SuperTrend HTF 15MCRR Smart SuperTrend HTF 15M
Overview
CRR Smart SuperTrend HTF 15M is a trend bias indicator specially engineered for fifteen minute charts
It focuses on clean directional alignment and avoids noise false flips and intrabar repainting commonly seen in generic trend tools
This indicator is designed for traders who prefer confirmed on bar close signals and disciplined trend participation
Core Concept
The indicator uses a custom internal trend structure optimized specifically for the fifteen minute timeframe
Buy and sell signals are generated only when conditions align with the dominant trend
Signals are confirmed after candle close and do not repaint
Signals
Buy signal indicates bullish trend confirmation
Sell signal indicates bearish trend confirmation
The logic is intentionally selective to prioritize quality over quantity
One Year Performance Snapshot Backtest Reference
On a fifteen minute chart over a one year historical period the signals showed
Profit factor around three
Win rate around fifty eight percent
Net growth around one hundred seventy percent using compounding in strategy testing
Maximum drawdown around one to two percent
These results reflect trend aligned entries with controlled downside risk
Actual trading results may vary depending on market conditions execution and risk management
Brief Analysis
The strength of this indicator comes from structure rather than frequency
By filtering low quality market phases and focusing on confirmed trend conditions it aims to reduce drawdown and improve consistency during trending periods
How To Use
Apply the indicator on a fifteen minute chart only
Trade in the direction of the most recent signal
Use your own stop loss and target logic
Avoid using on other timeframes
Important Notes
This indicator is optimized exclusively for fifteen minute charts
Historical results are for reference only and do not guarantee future performance
Risk management is essential
CRR
All logic and structure are proprietary and intended for personal trading use

MTF Trend Dashboard (PSAR, SuperTrend, 200EMA, 9/30 EMA)This script is a multi–timeframe trend dashboard designed to quickly show the market bias across several timeframes in one place.
It does not generate buy/sell signals – it is a visual decision tool to support your own strategy.
What it shows
For up to 5 selectable timeframes, the table displays:
Parabolic SAR – whether PSAR is below (bullish) or above (bearish) the candle.
Supertrend – whether the Supertrend line is below or above the price.
200 EMA status – whether price is trading above (bullish trend) or below (bearish trend) the 200 EMA.
9 / 30 EMA crossover – whether 9 EMA is above (bullish) or below (bearish) the 30 EMA.
Green cells represent bullish conditions, red cells represent bearish conditions.
How to use
Quickly check higher–timeframe trend alignment before entering trades.
Use it as a trend filter for scalping or intraday entries on lower timeframes.
Combine with your own price action / SMC / support–resistance rules for actual entries and exits.

EMA Crossover with Supertrend + Ribbon + Multi TFThis is a multi indicator all in one, incorporates several indicators in one. Stay on the right side of the trend with this indicator, has customizable everything, a fast and slow ema ribbon, a second ema ribbon for longer ema lengths, a customizable multi time frame trend table, a customizable supertrend, the vwap, 2 background trend color changes , one for the ema's and one for the supertrend, daily support and resistance lines, follow up bearish or bullish signals on every candle. I am sure you will be able to find this multi indicator very useful!

Close vs SuperTrend % DiffOn Every Bar: SuperTrend and percent_diff are recalculated; the line plot updates with coloring.
On Visible Bars Only: High/low extremes and sums/counts accumulate via VC checks.
On Last Bar: Table refreshes with current stats, reflecting the visible view.
User Interaction: Zooming/panning triggers VC.barIsVisible() to recompute aggregates dynamically—no full history scan needed.
Edge Cases:
Empty visible range: High/low default to na; averages guarded against zero counts.
Division by zero in percent_diff: Unlikely, as st is ATR-based and rarely zero, but Pine handles na gracefully.
Performance: Efficient for long histories (e.g., daily charts over years) since stats are view-localized.
This indicator is useful for trend traders: Watch for percent_diff crossing zero for signals, and use the table to gauge visible volatility (e.g., if avg high > avg low in magnitude, bullish bias). Customize SuperTrend params (3,10) for different assets/timeframes. To extend, you could add alerts on threshold crosses or integrate dir for trend filters.

Hello Crypto! Modern Combo Snapshot
Unified long/short analyzer blending EMA structure, SuperTrend, WaveTrend, QQE, and volume pressure.
Background shading flags “watch” and “ready” states; optional long/short modules let you focus on one side.
Alerts fire when every checklist item aligns, while the side-panel table summarizes trend, momentum, liquidity, and overall score in real time.
Indicator → Trend Analysis
Indicator → Momentum Oscillators
Indicator → Volume Indicators
Tags:
cryptocurrency, bitcoin, altcoins, trend-following, momentum, volume, ema, supertrend, intraday, swing-trading, alerts, checklist, trading-strategy, risk-management

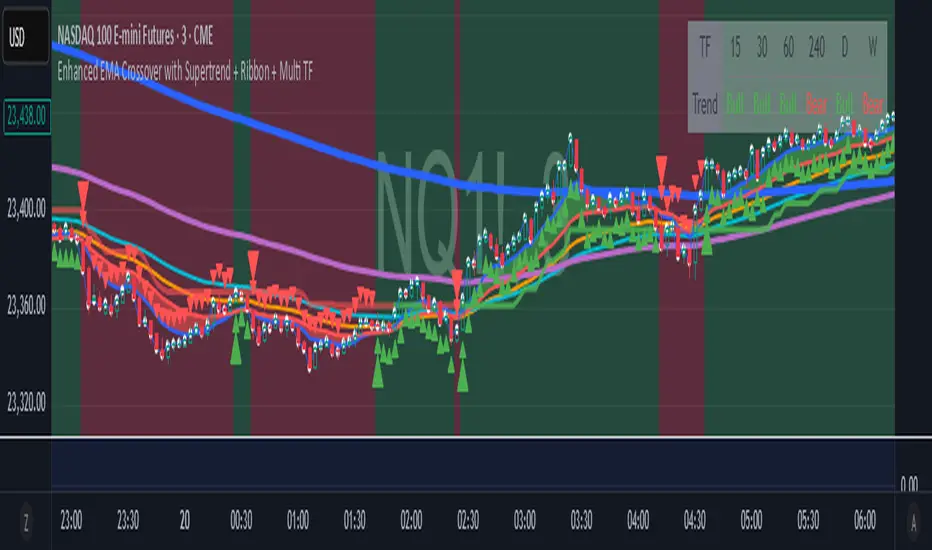
Enhanced EMA Crossover with Supertrend + Ribbon + Multi TFThe indicator has 4 core indicators in 1, the supertrend, the 2ema crossover, the moving average ribbon and a multi-timeframe trend indicator. I have modified the code for better visuals, all the indicators are fully customizable for better visuals and trend identification. Specially the 2 ema crossover indicator ribbon should guide you in the direction of the overall trend in different timeframes. The white dots were added to the real price close on everu candle , it is very usefull visually to see exactly where the price is closing specially when using heiken ashi candles. The small arrows on every candle should guide you in the direction of the overall trend when adjusting the 2 ema crossover lengths, the bigger arrow plots on the first candle only when the 2 ema crossover happens to either direction, using the supertrend indicator with the moving averages will also help you keep in the right trend direction.
FxSika SuperTrend ZoneThe FxSika SuperTrend Zone™ is a dynamic zone-based indicator that enhances the traditional SuperTrend concept by displaying two key structural layers:
Primary Trend Line: The main directional guide, calculated using ATR and a volatility multiplier.
Reaction Band: A secondary buffer area around the trend line, derived from an ATR extension. It helps visualize zones where price is likely to react or pause during pullbacks.
The indicator also includes an optional Long-Term Trend Layer, calculated with higher values for both ATR length and multiplier. This broader trend context can be toggled on or off via the settings.
How it works:
Zones adjust automatically based on trend direction.
Green zones represent bearish conditions (potential buy interest).
Red zones represent bullish conditions (potential sell interest).
Clear lines and shaded areas make key levels easy to spot.
Extra features:
Multiple alert options for zone interactions and trend shifts.
Lightweight, visually clean design for easy chart integration.
Fully adjustable parameters for ATR, multiplier, and zone width.
This indicator helps identify high-probability reaction zones during trending markets, especially when combined with price action or confirmation-based setups.

DIY Custom Strategy Builder [ZP] - v1DISCLAIMER:
This indicator as my first ever Tradingview indicator, has been developed for my personal trading analysis, consolidating various powerful indicators that I frequently use. A number of the embedded indicators within this tool are the creations of esteemed Pine Script developers from the TradingView community. In recognition of their contributions, the names of these developers will be prominently displayed alongside the respective indicator names. My selection of these indicators is rooted in my own experience and reflects those that have proven most effective for me. Please note that the past performance of any trading system or methodology is not necessarily indicative of future results. Always conduct your own research and due diligence before using any indicator or tool.
===========================================================================
Introducing the ultimate all-in-one DIY strategy builder indicator, With over 30+ famous indicators (some with custom configuration/settings) indicators included, you now have the power to mix and match to create your own custom strategy for shorter time or longer time frames depending on your trading style. Say goodbye to cluttered charts and manual/visual confirmation of multiple indicators and hello to endless possibilities with this indicator.
What it does
==================
This indicator basically help users to do 2 things:
1) Strategy Builder
With more than 30 indicators available, you can select any combination you prefer and the indicator will generate buy and sell signals accordingly. Alternative to the time-consuming process of manually confirming signals from multiple indicators! This indicator streamlines the process by automatically printing buy and sell signals based on your chosen combination of indicators. No more staring at the screen for hours on end, simply set up alerts and let the indicator do the work for you.
Available indicators that you can choose to build your strategy, are coded to seamlessly print the BUY and SELL signal upon confirmation of all selected indicators:
EMA Filter
2 EMA Cross
3 EMA Cross
Range Filter (Guikroth)
SuperTrend
Ichimoku Cloud
SuperIchi (LuxAlgo)
B-Xtrender (QuantTherapy)
Bull Bear Power Trend (Dreadblitz)
VWAP
BB Oscillator (Veryfid)
Trend Meter (Lij_MC)
Chandelier Exit (Everget)
CCI
Awesome Oscillator
DMI ( Adx )
Parabolic SAR
Waddah Attar Explosion (Shayankm)
Volatility Oscillator (Veryfid)
Damiani Volatility ( DV ) (RichardoSantos)
Stochastic
RSI
MACD
SSL Channel (ErwinBeckers)
Schaff Trend Cycle ( STC ) (LazyBear)
Chaikin Money Flow
Volume
Wolfpack Id (Darrellfischer1)
QQE Mod (Mihkhel00)
Hull Suite (Insilico)
Vortex Indicator
2) Overlay Indicators
Access the full potential of this indicator using the SWITCH BOARD section! Here, you have the ability to turn on and plot up to 14 of the included indicators on your chart. Simply select from the following options:
EMA
Support/Resistance (HeWhoMustNotBeNamed)
Supply/ Demand Zone ( SMC ) (Pmgjiv)
Parabolic SAR
Ichimoku Cloud
Superichi (LuxAlgo)
SuperTrend
Range Filter (Guikroth)
Average True Range (ATR)
VWAP
Schaff Trend Cycle ( STC ) (LazyBear)
PVSRA (TradersReality)
Liquidity Zone/Vector Candle Zone (TradersReality)
Market Sessions (Aurocks_AIF)
How it does it
==================
To explain how this indictor generate signal or does what it does, its best to put in points.
I have coded the strategy for each of the indicator, for some of the indicator you will see the option to choose strategy variation, these variants are either famous among the traders or its the ones I found more accurate based on my usage. By coding the strategy I will have the BUY and SELL signal generated by each indicator in the backend.
Next, the indicator will identify your selected LEADING INDICATOR and the CONFIRMATION INDICATOR(s).
On each candle close, the indicator will check if the selected LEADING INDICATOR generates signal (long or short).
Once the leading indicator generates the signal, then the indicator will scan each of the selected CONFIRMATION INDICATORS on candle close to check if any of the CONFIRMATION INDICATOR generated signal (long or short).
Until this point, all the process is happening in the backend, the indicator will print LONG or SHORT signal on the chart ONLY if LEADING INDICATOR and all the selected CONFIRMATION INDICATORS generates signal on candle close. example for long signal, the LEADING INDICATOR and all selected CONFIRMATION INDICATORS must print long signal.
The dashboard table will show your selected LEADING and CONFIRMATION INDICATORS and if LEADING or the CONFIRMATION INDICATORS have generated signal. Signal generated by LEADING and CONFIRMATION indicator whether long or short, is indicated by tick icon ✔. and if any of the selected CONFIRMATION or LEADING indicator does not generate signal on candle close, it will be indicated with cross symbol ✖.
how to use this indicator
==============================
Using the indicator is pretty simple, but it depends on your goal, whether you want to use it for overlaying the available indicators or using it to build your strategy or for both.
To use for Building your strategy: Select your LEADING INDICATOR, and then select your CONFIRMATION INDICATOR(s). if on candle close all the indicators generate signal, then this indicator will print SHORT or LONG signal on the chart for your entry. There are plenty of indicators you can use to build your strategy, some indicators are best for longer time frame setups while others are responsive indicators that are best for short time frame.
To use for overlaying the indicators: Open the setting of this indicator and scroll to the SWITCHBOARD section, from there you can select which indicator you want to plot on the chart.
For each of the listed indicators, you have the flexibility to customize the settings and configurations to suit your preferences. simply open indicator setting and scroll down, you will find configuration for each of the indicators used.
I will also release the Strategy Backtester for this indicator soon.

Bearish Market Indicator V2Definition
Have you ever wonder whether if the stock/index/market is "bearish" ? A Bearish Market Indicator (B.M.I) is not a new concept, the definition is simply 20% lower from the recent (term: short-term, recent: usually within a year, a.k.a 1 year) highs (closing price with in the recent period or within in a year or simply a 52-Week High). It is called “bearish” by definition when the closing price is below 20% from the highest price within the year (52-Week high: Green Line). To visualize the “20%” below the recent highs, there is a plot (line: light yellow color in the middle) called a Bearish Market By Definition Value. For example, the SPX 500 has been in a bearish market which is why there is a purple color highlight over the 52-Week High (green line) since September 21, 2022 because the closing price is below the Bearish Market By Definition Value (light yellow color) or “20% below the recent highs”. Finally, there is a red line under in the graph and it is the lowest price within a year. So when you hear, “this ticker is at a 52-Week Low”, you know what it means.
Line Summary:
Green Color Line = 52-Week High
Yellow Color Line = 20% away from the 52-Week High or Bearish Market By Definition Value
Red Color Line = 52-Week Low
Color Summary:
Red Color = Bad
Saturated Red Color = Very Bad
Purple Color = Bearish (It may look pink: red + purple)
White Color = Less Bad (That’s because there is no certainty only probability)
Green Color = Not too Bad (That’s because there is no certainty only probability)
Now to more complicated Metrics
>> If you do not like the technical indicators, go to the indicator settings, uncheck the tables. Otherwise, please continue reading. <<
Pre-requisites
+ Understand that the indicators are lagging indicators.
+ Using it under “D” or “Day” interval
+ Already Understand: Moving Averages, Stochastic-RSI, RSI, Super Trend and MACD.
+ Please be aware that this might not be compatible with traders!
Indicators
This B.M.I is fused (comprised, combined) with multiple indicators:
- Moving Averages
I would not rely just on the Moving Averages (MA) since it is a lagging indicator. The values are derived by finding the differences with respect to the MAs (between the closing price and with the respect MA).
- Stochastic-RSI
Stochastic and RSI combo with RSI-Color coating. The first value is the rsi-stochastic-k followed by the rsi-stochastic-d both are compartmentalized with “|”.
Parameter:
Numbers > 80 Not Good
Numbers < 20 Is it time? (You can manually verify the lines (k, d) or the values from them)
- Relative Strength Index (RSI)
The first value is the rsi followed by the rsi-ma both are compartmentalized with “|”. It is also coated with RSI-color.
Parameter:
Numbers > 70 Overbought | Color Red
If the RSI > RSI’s MA = Green
If the RSI < RSI’s MA = Red
Numbers < 30 Oversold | Color Red
- Moving Averages Convergence Divergence (MACD)
The first value is the MACD-line followed by the signal-line both are compartmentalized with “|”.
Macd-line > signal line = green
Macd-line < signal line = red
- Supertrend (please look up from the documentation; i can not embed the link)
Think of this way, you’re riding a wave. If the wave is climbing, expect the price to follow.
Direction < 0 = Green
Direction > 0 = Red
- Other Trend similar to supertrend
This is similar to the Super Trend according the some. Imagine you’re drawing a trend line manually within 6 months.
Within the period, the line gets smoothed over and over til the n=9.
> If the closing is less than the 9th value, it implies the trend is slowing down.
Usage
Adjustments
+ Since there are different holidays from different countries, you can change the BMI-Period from the indicator settings “BMI-4khansolo”.
+ You can hide Technical Indicator Tables, it is also under the settings (see above).
> This will show red over the 52-Week high if it tests for positive .
Purpose
Do you like eating the same food over and over? No! I love different food! I also love a variety of indicators. Especially, I love having MULTIPLE indicators presented in one canvas at the same time (personalized).
After spending a lot of time, I want to share my “FOOD” which is made of different ingredients (indicators) with someone who appreciates food! This Makes me a chef isn't it? Yes! Chef!
Questions?
If you have questions or spotted errors, please comment them below so that I can improve.
Sources
All the materials (i.e., functions like ta.rsi, etc...) used in here are available in the platform.
All the references or sources materials are commented with the code since the I am not allowed to put them here.

Double RSI TrendThis is my Double RSI Trend Indicator. It issues Buy and Sell signals based on the Supertrend and a double RSI . The RSIs cross near or at the same time as the Supertrend fires. It has the ability to change if you want signals based on the RSI cross on the same candle, one candle before, and two candles before. I find this one extremely good at catching reversals as long as you filter out some of the signals based on trend.
