Kio IQ [TradingIQ]Introducing: “Kio IQ ”
Kio IQ is an all-in-one trading indicator that brings momentum, trend strength, multi-timeframe analysis, trend divergences, pullbacks, early trend shift signals, and trend exhaustion signals together in one clear view.
🔶 The Philosophy of Kio IQ
Markets move in trends—and capturing them reliably is the key to consistency in trading. Without a tool to see the bigger picture, it’s easy to mistake a pullback for a breakout, a fakeout for the real deal, or random market noise as a meaningful price move.
Kio IQ cuts through that random market noise—scanning multiple timeframes, analyzing short, medium, and long-term momentum, and telling you on the spot whether a move is strong, weak, a trap, or simply a small move within a larger trend.
With Kio IQ, price action reveals its next move.
You’ll instantly see:
Which way it’s pushing — up, down, or stuck in the middle.
How hard it’s pushing — from fading weakness to full-blown strength.
When the gears are shifting — early warnings, explosive moves, smart pullbacks, or signs it’s running out of steam.
🔶 Why This Matters
Markets move in phases—sometimes they’re powering in one direction, sometimes they’re slowing down, and sometimes they’re reversing.
Knowing which phase you’re in can help you:
Avoid chasing a move that’s about to run out of steam.
Jump on a move when it’s just getting started.
Spot pullbacks inside a bigger trend (good for entries).
See when different timeframes are all pointing the same way.
🔶 What Kio IQ Shows You
Simple color-coded phases: “Strong Up,” “Up,” “Weak Up,” “Weak Down,” “Down,” “Strong Down.”
Clear visual signals
Full Shift: Strong momentum in one direction.
Half Shift: Momentum is building but not full power yet.
Pullback Shift: A small move against the trend that may be ending.
Early Scout / Lookout: First hints of a possible shift.
Exhaustion: Momentum is very stretched and may slow down.
Divergences: When price moves one way but momentum moves the opposite way—often a warning of a change.
Multi-Timeframe Table: See the trend strength for multiple timeframes (5m, current, 30m, 4h, 1D, and optional 1W/1M) all in one place.
Trend Strength %: A single number that tells you how strong the trend is across all timeframes.
Optional meters: A “momentum bar” and “trend strength gauge” for quick checks.
🔶 How It Works Behind the Scenes
Kio IQ measures price movement in different “speeds”:
Slow view: Big picture trend.
Medium view: The main engine for detecting the current phase.
Fast view: Catches recent changes in momentum.
Super-fast view: Finds tiny pullbacks inside the bigger move.
It compares these views to decide whether the market is strong up, weak up, weak down, strong down, or in between. Then it blends data from multiple timeframes so you see the whole picture, not just the current chart.
🔶 What You’ll See on the Chart
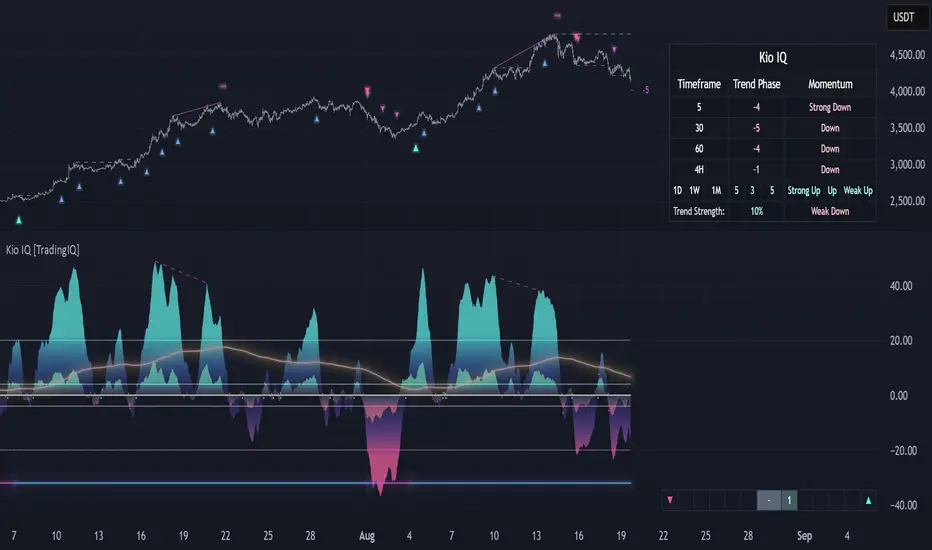
🔷 Full Shift Oscillator (FSO)
The image above highlights the Full Shift Oscillator (FSO).
The FSO is the cornerstone of Kio IQ, delivering mid-term momentum analysis. Using a proprietary formula, it captures momentum on a smooth, balanced scale — responsive enough to avoid lag, yet stable enough to prevent excessive noise or false signals.
The Key Upside Level for the FSO is +20, while the Key Downside Level is -20.
The image above shows the FSO above +20 and below -20, and the corresponding price movement.
FSML above +20 confirms sustained upside momentum — the market is being driven by consistent, broad-based buying pressure, not just a price spike.
FSML below -20 confirms sustained downside momentum — sellers are firmly in control across the market.
We do not chase the first sudden price move. Entries are only considered when the market demonstrates persistence, not impulse.
🔷 Half Shift Oscillator (HSO)
The image above highlights the Half Shift Oscillator (HSO).
The HSO is the FSO’s wingman — faster, more reactive, and designed to catch the earliest signs of strength, weakness, or momentum shifts.
While HSO reacts first, it is not a standalone confirmation of a major momentum change or trade-worthy strength.
Using the same proprietary formula as the FSO but scaled down, the HSO delivers smooth, balanced short-term momentum analysis. It is more responsive than the FSO, serving as the scout that spots potential setups before the main signal confirms.
The Key Upside Level for the FSO is +4, while the Key Downside Level is -4.
🔷 PlayBook Strategy: Shift Sync
Shift Sync is a momentum alignment play that triggers when short-term and mid-term momentum lock into the same direction, signaling strong directional control.
🔹 UpShift Sync – Bullish Alignment
HSO > +4 – Short-term momentum is firmly bullish.
FSO > +20 – Mid-term momentum confirms the bullish bias.
When both thresholds are met, buyers are in control and price is primed for continuation higher.
🔹 DownShift Sync – Bearish Alignment
HSO < -4 – Short-term momentum is firmly bearish.
FSO < -20 – Mid-term momentum confirms the bearish bias.
When both thresholds are met, sellers dominate and price is primed for continuation lower.
Execution:
Look for an entry opportunity in the direction of the alignment when conditions are met.
Avoid choppy conditions where alignment is frequently lost.
Why It Works
Think of the market as a tug-of-war between traders on different timeframes. Short-term traders (captured by the HSO) are quick movers — scalpers, intraday players, and algos hunting immediate edge. Mid-term traders (captured by the FSO) are swing traders, funds, and institutions who move slower but carry more weight.
Most of the time, these groups pull in opposite directions, creating chop and fakeouts. But when they suddenly lean the same way, the rope gets yanked hard in one direction. That’s when momentum has the highest chance to drive price further with minimal resistance.
Shift Sync works because it isolates those rare moments when multiple market “tribes” agree on direction — and when they do, price doesn’t just move, it flies.
Best Market Conditions
Shift Sync works best when the higher timeframe trend (daily, weekly, or monthly) is moving in the same direction as the alignment. This higher timeframe confluence increases follow-through potential and reduces the likelihood of false moves.
The image above shows an example of an UpShift Sync signal where the momentum table shows that the 1D momentum is bullish.
The image above shows bonus confluence, where the 1M and 1W momentum are also bullish.
The image above shows an example of a DownShift Sync signal where the momentum table shows that the 1D momentum is bearish. Bonus confluence also exists, where the 1W and 1M chart are also bearish.
Common Mistakes
Chasing late signals – Avoid entering if the Shift Sync trigger has been active for a long time. Instead, wait for a Shift Sync Pullback to look for opportunities to join in the direction of the trend.
Ignoring higher timeframe bias – Taking Shift Sync setups against the daily, weekly, or monthly trend reduces follow-through potential and increases the risk of a failed move.
🔷 Micro Shift Oscillator (MSO)
The image above highlights the Micro Shift Oscillator (MSO)
The MSO is the finishing touch to the FSO and HSO — the fastest and most reactive of the three. It’s built to spot pullback opportunities when the FSO and HSO are aligned, helping traders join strong price moves at the right time.
The MSO may reveal the earliest signs of a momentum shift, but that’s not its primary role. Its purpose is to identify retracement and pullback opportunities within the overarching trend, allowing traders to join the move while momentum remains intact.
🔷 Playbook Strategy: Shift Sync Pullback
Key Levels:
MSO Upside Trigger: +3
MSO Downside Trigger: -3
🔹 UpShift Pullback
Momentum Confirmation:
FSO > +20 – Mid-term momentum is strongly bullish.
HSO > +4 – Short-term momentum confirms alignment with the FSO.
Pullback Trigger:
MSO ≤ -3 – Signals a short-term retracement within the ongoing bullish trend and marks the earliest re-entry opportunity.
Entry Zone:
The blue arrow on the top chart shows where momentum remains intact while price pulls back into a zone primed for a move higher.
Setup Validity: Both FSO and HSO must remain above their bullish thresholds during the pullback.
Invalid Example:
If either the FSO or HSO drop below their bullish thresholds, momentum alignment breaks. No trade is taken.
🔹 DownShift Pullback
Momentum Confirmation:
FSO < -20 – Mid-term momentum is strongly bearish.
HSO < -4 – Short-term momentum aligns with the FSO, confirming seller dominance.
Pullback Trigger:
MSO ≥ +3 – Indicates a short-term retracement against the bearish trend, pointing to possible short-entry opportunities.
Entry Zone:
The purple arrow on the top chart marks valid pullback conditions — all three oscillators meet their bearish thresholds, and price is positioned to continue lower.
Setup Validity: Both FSO and HSO must remain below their bearish thresholds during the pullback.
Invalid Example:
If either oscillator rises above the bearish threshold, momentum alignment is lost and the MSO signal is ignored.
Why It Works
Even in strong trends, price rarely moves in a straight line. Supply and demand dynamics naturally create retracements as traders take profits, bet on reversals, or hedge positions.
While many momentum traders fear these pullbacks, they’re often the fuel for the next leg of the move — offering a “second chance” to join the trend at a more favorable price.
The Shift Sync Pullback pinpoints moments when both short-term (HSO) and mid-term (FSO) momentum remain firmly aligned, even as price moves temporarily against the trend. This alignment suggests the retracement is a pause, not a reversal.
By entering during a controlled pullback, traders often secure better entries, tighter stops, and stronger follow-through potential when the trend resumes.
Best Market Conditions:
Works best when the higher timeframe (daily, weekly, or monthly) is trending in the same direction as the pullback setup.
Consistent momentum is ideal — avoid erratic, news-driven chop.
Following a recent breakout (Gate Breaker setup) when momentum is still fresh.
Common Mistakes
Ignoring threshold breaks – Entering when either HSO or FSO dips through their momentum threshold often leads to taking trades in weakening trends.
Trading against higher timeframe bias – A pullback against the daily or weekly trend is more likely to fail; use higher timeframe confluence as a filter.
🔷 Macro Shift Oscillator (MaSO)
The chart above shows the MaSO in isolation.
While the MaSO is not part of any active Kio IQ playbook strategies, it delivers the clearest view of the prevailing macro trend.
MaSO > 0 – Macro trend is bullish. Readings above +4 signal extreme bullish conditions.
MaSO < 0 – Macro trend is bearish. Readings below -4 signal extreme bearish conditions.
Use the MaSO for context, not entries — it frames the environment in which all other signals occur
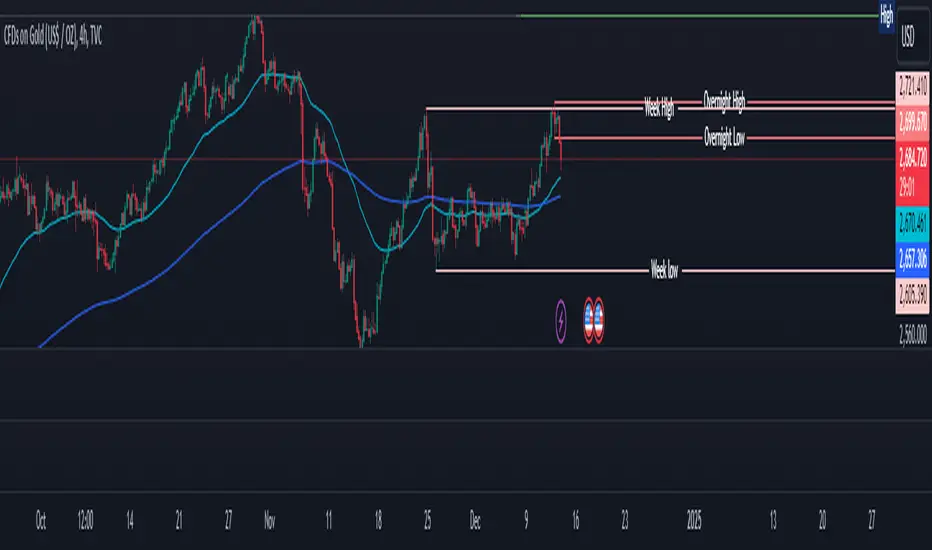
🔷 Shift Gates – Kio IQ Momentum Barriers
The image above shows UpShift Gates.
UpShift Gates mark the highest price reached during periods when the FSO is above +20 — moments when mid-term momentum is firmly bullish and buyers are in control.
UpShift Gates are upside breakout levels — key swing highs formed before a pullback during periods of strong bullish momentum. When price reclaims an UpShift Gate with momentum confirmation, it signals a potential continuation of the uptrend.
The image above shows DownShift Gates.
DownShift Gates Mark The Lowest Price Reached During Periods When The FSO Is Below -20 — Moments When Mid-Term Momentum Is Firmly Bearish And Sellers Are In Control.
DownShift Gates are downside breakout levels — key swing lows formed before an upside pullback during periods of strong bearish momentum. When price reclaims a DownShift Gate with momentum confirmation, it signals a potential continuation of the downtrend.
🔷 Playbook Strategy: Gate Breakers
Core Rule:
Long signal when price decisively closes beyond an UpGate (for longs) or DownGate (for shorts). The breakout must show commitment — no wick-only tests.
🔹 UpGate Breaker (UpGate)
Trigger: Price closes above the UpShift Gate level.
Bonus Confluence: MaSO > 0 at the moment of the break — confirms that the macro trend bias is in favor of the breakout.
Invalidation: Avoid taking the signal if the gate level forms part of a DownShift Rift (bearish divergence) — this signals underlying weakness despite the break.
The chart above shows valid UpGate Breakers.
The chart above shows an invalidated UpGate Breaker setup.
🔹 DownGate Breaker (DownGate)
Trigger: Price closes below the DownShift Gate level.
Bonus Confluence: MaSO < 0 at the moment of the break — confirms that the macro trend bias is in favor of the breakdown.
Invalidation: Avoid taking the trade if the gate level forms part of an UpShift Rift (bullish divergence) — this signals underlying strength despite the break.
The chart above shows a valid DownGate Breaker.
Why It Works
Key swing levels like Shift Gates attract a high concentration of resting orders — stop losses from traders caught on the wrong side and breakout orders from momentum traders waiting for confirmation.
When price decisively clears a gate with a strong close, these orders trigger in quick succession, creating a burst of directional momentum.
Adding the MaSO filter ensures you’re breaking gates with the prevailing macro bias, improving the odds that the move will continue rather than stall.
The divergence-based invalidation rule (Rift filter) prevents entries when underlying momentum is moving in the opposite direction, helping avoid “fake breakouts” that trap traders.
Best Market Conditions:
Works best in markets with clear trend structure and visible Shift Gates (not during chop).
Strongest when higher timeframe (1D, 1W, 1M) momentum aligns with the breakout direction.
MaSO > 0 for bullish breakouts, MaSO < 0 for bearish breakouts
Most reliable after a period of consolidation near the gate, where pressure builds before the break.
Common Mistakes
Trading wick-only tests – A breakout without a decisive candle close beyond the gate often fails.
Ignoring MaSO bias – Taking a break in the opposite macro direction greatly reduces follow-through odds.
Skipping the Rift filter – Entering when the gate forms part of a divergence setup exposes you to higher reversal risk.
Chasing extended moves – If price is already far beyond the gate by the time you see it, risk/reward is poor; wait for the next setup or a retest.
🔷 Shift Rifts - Kio IQ Divergences
This chart shows an UpShift Rift — a bullish divergence where price action and momentum part ways, signaling a potential trend reversal or acceleration.
Setup:
Price Action: Price is marking lower lows, indicating short-term weakness.
FSO Reading: The Full Shift Oscillator (FSO) is marking higher lows over the same period, showing underlying momentum strengthening despite falling prices.
The rift between price and the FSO suggests selling pressure is losing force while buyers quietly regain control.
When confirmed by broader trend alignment in Kio IQ’s multi-timeframe momentum table, the UpShift Rift becomes a setup for a bullish move.
This chart shows a DownShift Rift — a bearish divergence where price action and momentum split, signaling a potential downside reversal.
Setup:
Price Action: Price is marking higher highs, suggesting continued strength on the surface.
FSO Reading: The Full Shift Oscillator (FSO) is marking lower highs over the same period, revealing weakening momentum beneath the price advance.
The rift between price and momentum signals that buying pressure is fading, even as price makes new highs. This disconnect often precedes a momentum shift in favor of sellers.
When aligned with multi-timeframe bearish signals in Kio IQ’s momentum table, the DownShift Rift becomes a strong setup for downside continuation or reversal.
🔷 Playbook Strategy: Rift Reversal
The Rift Reversal is a divergence-based reversal play that signals when momentum is fading and an trend reversal is likely. It’s designed to catch early turning points before the broader market catches on.
Trader’s Note:
This strategy is not intended for beginners — it requires confidence in reading divergence and trusting momentum shifts even when price action still appears weak. Best suited for traders experienced in managing reversals, as entries often occur before the broader market confirms the move.
🔹 UpRift Reversal
Core Setup:
Price Action – Forms a lower low.
Momentum Rift – The FSO forms a higher low, signaling bullish divergence and weakening selling pressure.
Trigger:
A confirmed UpRift Reversal signal is printed when:
Bullish Divergence is detected — price makes a new low, but the oscillator fails to confirm.
Momentum begins turning up from the divergence low (marked on chart as ⇝)
The image above shows a valid UpRift Reversal play.
🔹 DownRift Reversal
Core Setup:
Price Action – Forms a higher high.
Momentum Rift – The FSO forms a lower high, signaling bearish divergence and weakening buying pressure.
Trigger
A confirmed DownRift Reversal signal is printed when:
Bearish Divergence is detected — price makes a new high, but the oscillator fails to confirm.
Momentum begins turning down from the divergence high (marked on chart as ⇝).
Why It Works
Shift Rifts work because momentum often fades before a price reverses.
Price is the final scoreboard — it reflects what has already happened. Momentum, on the other hand, is a leading indicator of pressure. When the FSO begins to move in the opposite direction of price, it signals that the dominant side in the market is losing steam, even if the scoreboard hasn’t flipped yet.
In an UpShift Rift, sellers keep pushing price lower, but each push has less force — buyers are quietly building pressure under the surface.
In a DownShift Rift, buyers keep marking new highs, but they’re spending more effort for less result — sellers are starting to take control.
These disconnects happen because large participants often scale into or out of positions gradually, creating momentum shifts before price reflects it. Shift Rifts capture those turning points early.
Best Market Conditions:
Best in markets that have been trending strongly but are starting to show signs of exhaustion.
Works well after a prolonged move into key support/resistance, where large players may take profits or reverse positions.
Higher win potential when the Rift aligns with higher timeframe momentum bias in Kio IQ’s multi-timeframe table.
Common Mistakes
Forcing Rifts in choppy markets – In sideways chop, small oscillations can look like divergences but lack conviction.
Ignoring multi-timeframe bias – Trading an UpShift Rift when higher timeframes are strongly bearish (or vice versa) reduces follow-through odds.
Entering too early – Divergences can extend before reversing; wait for momentum to confirm a turn (⇝) before making a trading decision.
Confusing normal pullbacks with Rifts – Not every dip in momentum is a divergence; the Rift requires a clear and opposing trend between price and FSO.
🔷 Shift Count – Momentum Stage Tracker
Purpose:
Shift Count measures how far a bullish or bearish push has progressed, from its first spark to potential exhaustion.
It tracks momentum in defined steps so traders can instantly gauge whether a move is just starting, picking up steam, fully extended, or at risk of reversing.
How It Works
Bullish Momentum:
Start (1–2) → New momentum emerging, early entry window.
Acceleration (3–4) → Momentum in full swing, best for holding or adding to a position.
Extreme Bullish Momentum / Final Stages (5) → Watch for signs of reversal or take partial profits.
Exhaust – Can only occur after 5 is reached, signaling that the rally may be losing steam.
Bearish Momentum:
Start (-1 to -2) → New selling pressure emerging.
Acceleration (-3 to -4) → Bear trend accelerating.
Extreme Bearish Momentum / Final Stages (-5) → Watch for reversal or scale out.
Exhaust – Can only occur after -5 is reached, signaling that the sell-off may be running out of force.
The chart above shows a full 5-UpShift count.
The chart above shows a full 5-DownShift count.
Why It’s Useful
Markets often move in momentum “steps” before reversing or taking a breather.
Shift Count makes these steps visible, helping traders:
Spot the early stages of a potential move.
Identify when a move is picking up steam.
Identify when a move is mature and vulnerable to reversal.
Combine with other Kio IQ strategies for better-timed entries and exits.
Why This Works
It’s visually obvious where you are in the momentum cycle without overthinking.
You can build rules like:
Only enter in Start phase when higher timeframe agrees.
Manage positions aggressively once in Acceleration phase.
Be ready to exit or fade in Exhaust phase.
Best Market Conditions
Trending markets where pullbacks are shallow.
Works best when combined with Shift Sync Pullback or Gate Breaker triggers to confirm timing.
Higher timeframe direction confluence.
Common Mistakes
Treating Exhaust as always a reversal — sometimes strong markets push past 5/-5 multiple times.
Ignoring higher timeframe bias — a “Start” on a 1-minute chart against a strong daily trend is much riskier.
🔷 Playbook Strategy: Exhaust Flip
Core idea: When Shift Count reaches 5 (or -5) and then prints Exhaust, momentum has likely climaxed, whether temporarily or leading to a full reversal. We take the first qualified signal against the prior move.
Trader’s Note:
This strategy is not intended for beginners — it requires confidence in trusting momentum shifts even when price action still appears strong. Best suited for traders experienced in managing reversals, as entries often occur before the broader market confirms the move.
🔹 UpExhaust Flip (fade a bullish run)
Setup:
Shift Count hits 5, then an Exhaust print occurs.
Invalidation
The local high is broken to the upside.
The chart above explains the UpExhaust Flip strategy in greater detail.
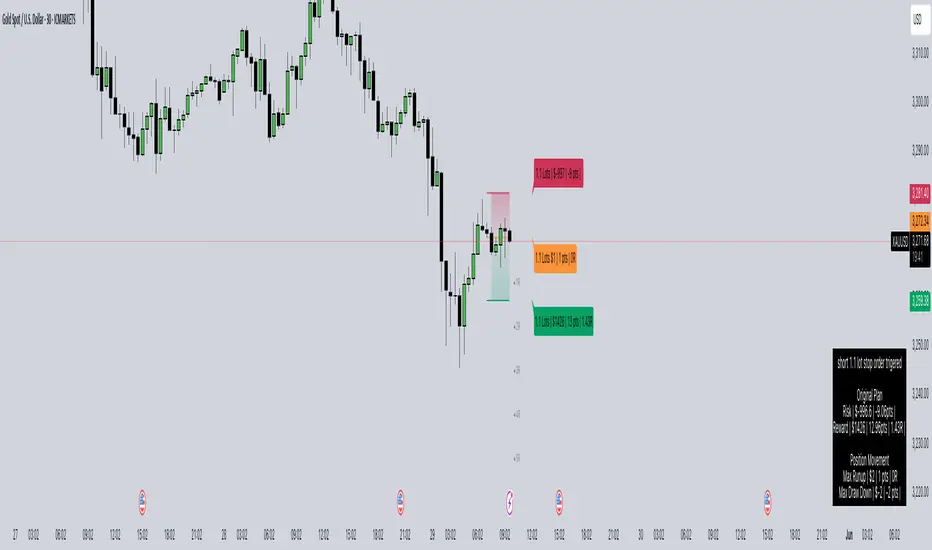
🔹 DownExhaust Flip (fade a bearish run)
Setup:
Shift Count hits -5, then an Exhaust print occurs.
Invalidation
The local low is broken to the downside.
The chart above explains the DownExhaust Flip strategy in greater detail.
Bonus Confluence (optional, not required)
Rift assist: An UpShift Rift (for longs) or DownShift Rift (for shorts) near Exhaust strengthens the flip.
MaSO context: Neutral or opposite-leaning MaSO helps. Avoid flips straight against a strong MaSO bias unless you have a structure break.
Why It Works
Exhaust marks climax behavior: the prior side has pushed hard, then failed to extend after meeting significant pushback. Liquidity gets thin at the edges; aggressive profit-taking meets early contrarians. A small confirmation (micro structure break or HSO turn) is often enough to flip the tape for a snapback.
Best Market Conditions
After extended, one-sided runs (multiple Shift Count steps without meaningful pullbacks).
Near Shift Gates or obvious swing extremes where trapped orders cluster.
When higher-timeframe momentum is neutral or softening (you’re fading the last thrust of a decisive move, not a fresh trend).
Common Mistakes
Fading too early: Taking the trade at 5 without waiting for the Exhaust.
Fading freight trains: Fighting a fresh Shift Sync in the same direction right after Exhaust (often just a pause).
No structure reference: Entering without a clear micro swing to anchor risk.
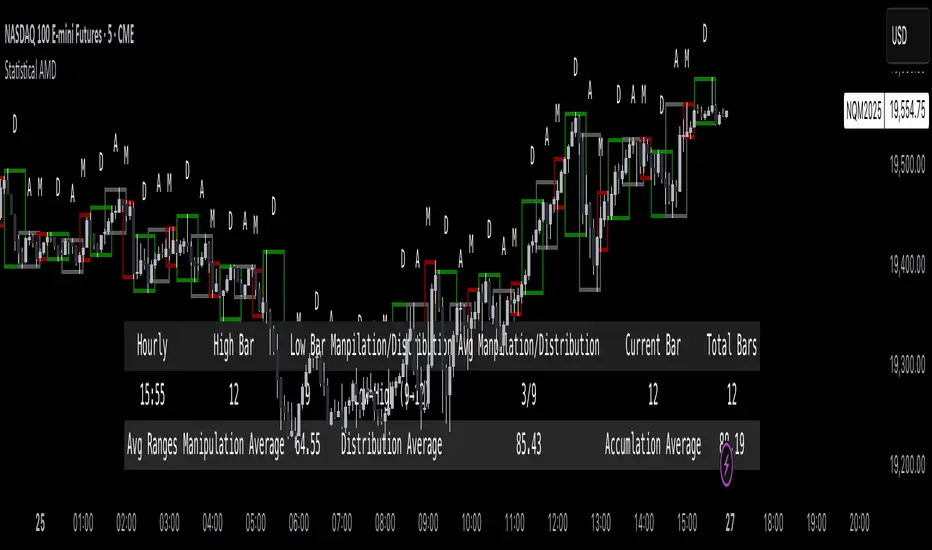
🔷 MTF Shift Table
The MTF Shift Table table provides a compact, multi-timeframe view of market momentum shifts. Each cell represents the current shift count within a given timeframe, while the classification label indicates whether momentum is strong, weak, or normal.
The chart above further outlines the MTF Shift Table.
Why It Works
Markets rarely move in a perfectly linear fashion — momentum develops, stalls, and transitions at different speeds across different timeframes. This table allows you to:
See momentum alignment at a glance – If multiple higher and lower timeframes show a sustained shift count in the same direction, the move has greater structural support.
Spot divergences early – A shorter timeframe reversing against a longer-term sustained count can warn of potential pullbacks or trend exhaustion before price confirms.
Identify “momentum stacking” opportunities – When shift counts escalate across timeframes in sequence, it often signals a stronger and more durable move.
Avoid false enthusiasm – A single timeframe spike without agreement from other periods may be noise rather than genuine momentum.
The Trend Score provides a concise, at-a-glance evaluation of an asset’s directional strength across multiple timeframes. It distills complex momentum and Shift data into a single, easy-to-read metric, allowing traders to quickly determine whether the prevailing conditions favor bullish or bearish continuation. The Trend Scale scales from -100 to 100.
How to Use It in Practice
Trend Confirmation – Confirm that your intended trade direction is backed by multiple timeframes maintaining consistent momentum.
Risk Timing – Reduce position size or take partial profits when lower timeframes begin shifting against the dominant momentum classification.
Multi-timeframe Confluence – Combine with other system signals (e.g., FSO, HSO) for higher-probability entries.
This table effectively turns a complex multi-timeframe read into a single, glanceable heatmap of momentum structure, enabling quicker and more confident decision-making.
The MTF Shift Table is the confluence backbone of every playbook strategy for Kio IQ.
🔷 Momentum Meter
The Momentum Meter is a composite gauge built from three of Kio IQ’s core momentum engines:
HSO – Short-term momentum scout
FSO – Mid-term momentum backbone
MaSO – Macro trend context
By combining these three readings, the meter provides the most strict and lagging momentum classification in Kio IQ.
It only flips direction when a composite score of all three oscillators reach defined thresholds, filtering out short-lived counter-moves and false starts.
Why It Works
Many momentum tools flip too quickly — reacting to short-lived spikes that don’t represent real directional commitment. The Momentum Meter avoids this by requiring alignment across short, mid, and macro momentum engines before it shifts bias.
This triple-confirmation rule filters out noise, catching only those moments when traders of all speeds — scalpers, swing traders, and long-term participants — are leaning in the same direction. When that happens, price movement tends to be more sustained and less prone to immediate reversal.
In other words, the Momentum Meter doesn’t just tell you “momentum looks good” — it tells you momentum looks good to everyone who matters, across all horizons.
How It Works
Blue = All three engines align bullish.
Pink = All three engines align bearish.
The meter ignores smaller pullbacks or temporary oscillations that might flip the faster indicators — it waits for total alignment before changing state.
Because of this strict confirmation requirement, the Momentum Meter reacts slower but delivers higher-conviction shifts.
How to Interpret Readings
Blue (Bullish Alignment):
Sustained buying pressure across short, mid, and macro views. Often marks the “full confirmation” stage of a move.
Pink (Bearish Alignment):
Sustained selling pressure across all views. Confirms sellers are in control.
Practical Uses
Trend Followers – Use as a “stay-in” confirmation once a position is already open.
Swing Traders – Great for filtering out low-conviction setups; if the Momentum Meter disagrees with your intended direction, conditions aren’t fully aligned.
Confluence and Direction Filter – The Momentum Meter can be used as a form of confluence i.e. blue = longs only, pink = shorts only.
Limitations
Will always turn after the faster oscillators (HSO/MSO). This is intentional.
Works best in trending markets — in choppy conditions it may lag shifts significantly.
Should be used as a bias filter, not a standalone entry signal.
🔷 Trend Strength Meter
The Trend Strength Meter is a compact visual gauge that scores the current trend’s strength on a scale from -5 to +5:
+5 = Extremely strong bullish trend
0 = Neutral, no clear trend
-5 = Extremely strong bearish trend
This is an optional tool in Kio IQ — designed for quick reference rather than as a primary trading trigger.
Why it works
Single-indicator trend reads can be misleading — they might look strong on one metric while quietly weakening on another. The Trend Strength Meter solves this by blending multiple inputs (momentum alignment, structure persistence, and multi-timeframe data) into one composite score.
This matters because trend health isn’t just about direction — it’s about persistence. A +5 or -5 score means the market is not only trending but holding that trend with structural support across multiple timeframes.
By tracking both direction and staying power, the Trend Strength Meter flags when a move is at risk of fading before price action fully confirms it — giving you a head start on adjusting your position or taking profits.
How It Works
The Trend Strength Meter evaluates multiple market inputs — including momentum alignment, price structure, and persistence — to assign a numeric value representing how firmly the current move is holding.
The scoring logic:
Positive values indicate bullish conditions.
Negative values indicate bearish conditions.
Higher magnitude (closer to ±5) = stronger conviction in that direction.
Values near zero suggest the market is in a transition or range.
How to Interpret Readings
+4 to +5 (Strong Up) – Trend is well-established, often with multi-timeframe agreement.
+1 to +3 (Up) – Bullish bias present, but not at maximum conviction.
0 (Neutral) – No dominant trend; could be consolidation or pre-shift phase.
-1 to -3 (Down) – Bearish bias present but moderate.
-4 to -5 (Strong Down) – Trend is firmly bearish, with consistent downside momentum.
Why It Works
A single timeframe or momentum reading can give a false sense of trend health.
The Trend Strength Meter aggregates multiple layers of market data into one simplified score, making it easy to see whether a move has the underlying support to continue — or whether it’s more likely to stall.
Because the score considers both direction and persistence, it can flag when a move is losing strength even before price structure fully shifts.
🔷 Kio IQ – Supplemental Playbook Strategies
These phases are part of the Kio IQ Playbook—situational tools that can help you anticipate potential momentum changes.
While they can be useful for planning and tactical adjustments, they are not primary trade triggers and should be treated as early, lower-conviction cues.
🔹 1. Scouting Phase (Light Early Cue)
Purpose: Provide the earliest possible hint that momentum may be shifting.
Upshift Trigger: FSO crosses above the 0 line.
Downshift Trigger: FSO crosses below the 0 line.
Why It Works
The 0 line in the Full Shift Oscillator (FSO) acts as a neutral momentum boundary.
When the FSO moves above 0, it suggests that medium-term momentum has shifted to bullish territory.
When it moves below 0, it suggests that medium-term momentum has shifted to bearish territory.
This crossover is often the first measurable sign of a momentum reversal or acceleration, well before slower indicators confirm it.
Think of it as "momentum poking its head above water"—you’re spotting the change before it becomes obvious on price alone.
Best Use
Works best when confirmed later by Lookout Phase or other primary Kio IQ signals.
Ideal for scouting in anticipation of potential opportunities.
Helpful when monitoring multiple assets and you want a quick filter for shifts worth watching.
Can act as a trade trigger when the MTF Shift Table shows confluence (i.e., UpShift Scouting Signal + Bullish MTF Table + High Trend Strength Score).
Common Mistakes
Acting on Scouting Phase signals against the MTF Shift Table as a stand-alone trade trigger. Without higher timeframe alignment or additional confirmation, many Scouting Phase crossovers can fade quickly or reverse, leading to premature entries.
Ignoring market context
A bullish Scouting Phase in a strong downtrend can easily fail.
Always check higher timeframe trend alignment.
Overreacting to noise: On lower timeframes, small fluctuations can create false scouting signals.
Best Practices
Filter with trend: Only act on Scouting Phases that align with the dominant higher timeframe trend.
Watch volatility: In low-volatility conditions, false scouting triggers are more likely.
🔹 2. Lookout Phase (Early Momentum Alert)
Purpose:
The Lookout Phase signals an early alert that momentum is potentially strengthening in a given direction. It’s more meaningful than the Scouting Phase, but still considered a preliminary cue.
Triggers:
Upshift: FSO crosses above the HSO.
Downshift: FSO crosses below the HSO.
Why It Works:
The Lookout Phase is designed to identify moments when mid-term momentum (FSO) overtakes short-term momentum (HSO). Since the FSO is smoother and reacts more gradually, its crossover of the faster-reacting HSO can indicate a shift from short-lived fluctuations to a more sustained directional move.
This makes it a valuable early read on momentum transitions—especially when supported by higher-timeframe context.
Best Practices:
Always check the MTF Shift Table for higher-timeframe alignment before acting on a Lookout Phase signal.
Look for confluence with the Momentum Meter
Treat Lookout Phase entries as probing positions—small, exploratory trades that can be scaled into if follow-through develops.
Common Mistakes:
Treating Lookout Phase signals as a definitive trade trigger without context
Entering solely on a Lookout Phase crossover, without considering the MTF Shift Table or broader market structure, can result in chasing short-lived momentum bursts that fail to follow through.
Ignoring prevailing higher-timeframe momentum
Trading a Lookout Phase signal that is counter to the dominant trend or higher-timeframe bias increases the risk of whipsaws and false moves.
🔶 Summary
Kio IQ is an all-in-one trading indicator that combines momentum, trend strength, multi-timeframe analysis, divergences, pullbacks, and exhaustion alerts into a clear, structured view. It helps traders cut through market noise by showing whether a move is strong, weak, a trap, or simply part of a larger trend. With tools like the Full Shift Oscillator, Multi-Timeframe Shift Table, Shift Gates, and Rift Divergences, Kio IQ simplifies complex market behavior into easy-to-read signals. It’s designed to help traders spot early shifts, align with momentum, and recognize when trends are building or losing steam—all in one place.
Paid script