QUANT TRADING ENGINE [PointAlgo]Quant Trading Engine is a quantitative market-analysis indicator that combines multiple statistical factors to study trend behavior, mean reversion, volatility, execution efficiency, and market stability.
The indicator converts raw price behavior into standardized signals to help evaluate directional bias and risk conditions in a systematic way.
This script focuses on factor alignment and regime awareness, not prediction certainty.
Design Philosophy
Markets move through different regimes such as trending, ranging, volatile expansion, and instability.
This indicator attempts to model these regimes by blending:
Momentum strength
Mean-reversion pressure
Volatility risk
Trend filtering
Execution context (VWAP)
Correlation structure
Each component is normalized and combined into a single Quant Alpha framework.
Factor Construction
1. Momentum Factor
Measures directional strength using percentage price change over a rolling window.
Standardized using mean and standard deviation.
Represents trend continuation pressure.
2. Mean Reversion Factor
Measures deviation from a longer moving average.
Standardized to identify stretched conditions.
Designed to capture counter-trend behavior.
Directional Clamping
Mean-reversion signals are dynamically restricted:
No counter-trend buying during downtrends.
No counter-trend selling during uptrends.
Allows both sides only in neutral regimes.
This prevents conflicting signals in strong trends.
3. Volatility Factor
Uses realized volatility derived from price changes.
Penalizes environments where volatility deviates significantly from its norm.
Acts as a risk adjustment rather than a directional driver.
4. Composite Quant Alpha
The final Quant Alpha is a weighted blend of:
Momentum
Mean reversion (trend-clamped)
Volatility risk
The composite is standardized into a Z-score, allowing consistent interpretation across instruments and timeframes.
Signal Logic
Buy signal occurs when Quant Alpha crosses above zero.
Sell signal occurs when Quant Alpha crosses below zero.
Zero-cross logic is used to represent shifts from negative to positive statistical bias and vice versa.
Signals reflect statistical regime change, not trade instructions.
Volatility Smile Context
Measures price deviation from its statistical distribution.
Identifies skewed conditions where upside or downside volatility becomes dominant.
Highlights extreme deviations that may imply elevated derivative risk.
Exotic Risk Conditions
Detects sudden price expansion combined with volatility spikes.
Highlights environments where execution and risk become unstable.
Visual background cues are used for awareness only.
Execution Context (VWAP)
Measures price distance from VWAP.
Used to assess execution efficiency rather than direction.
Helps identify stretched conditions relative to average traded price.
Correlation Structure
Evaluates short-term return correlations.
Detects when price behavior becomes less predictable.
Flags structural instability rather than trend direction.
Visualization
The indicator plots:
Quant Alpha (scaled) with directional coloring
Volatility smile deviation
Price vs VWAP distance
Correlation structure
Signal markers indicate Quant Alpha zero-cross events and risk conditions.
Dashboard
A compact dashboard summarizes:
Trend filter state
Quant Alpha polarity and value
Individual factor readings
Current action state (Buy / Sell / Wait / Risk)
The dashboard provides a real-time snapshot of internal model conditions.
Usage Notes
Designed for analytical interpretation and research.
Best used alongside price action and risk management tools.
Factor behavior depends on instrument liquidity and volatility.
Not optimized for illiquid or irregular markets.
Disclaimer
This script is provided for educational and analytical purposes only.
It does not provide financial, investment, or trading advice.
All outputs should be independently validated before making any trading decisions.
Search in scripts for "vwap"

Multi-Timeframe VWAP DashboardMulti-Timeframe VWAP Dashboard with Advanced Customization**
Unlock the power of **Volume-Weighted Average Price (VWAP)** across multiple timeframes with this highly customizable and feature-rich Pine Script. Designed for traders who demand precision and flexibility, this script provides a **comprehensive VWAP dashboard** that adapts to your trading style and strategy. Whether you're a day trader, swing trader, or long-term investor, this tool offers unparalleled insights into market trends and price levels.
---
### **Key Features:**
1. **Multi-Timeframe VWAP Calculation:**
- Calculate VWAP across **12-minute, 48-minute, 96-minute, 192-minute, daily, weekly, monthly, and even yearly timeframes**.
- Supports **custom timeframes** for tailored analysis.
2. **Price Source Selection:**
- Choose from multiple price sources for VWAP calculation, including **Open, High, Low, Close, HL2, HLC3, HLCC4, and All**.
- Optimize VWAP for **uptrends and downtrends** by selecting the most relevant price source.
3. **Customizable Labels:**
- Add **dynamic labels** to each VWAP line for quick reference.
- Customize label **colors, sizes, and offsets** to suit your chart setup.
- Display **price values** and **session types** (e.g., "12 Min", "Daily", "Weekly") directly on the chart.
4. **Advanced Session Detection:**
- Automatically detect new sessions for **intraday, daily, weekly, monthly, and yearly timeframes**.
- Ensures accurate VWAP calculations for each session.
5. **Plot Visibility Control:**
- Toggle the visibility of individual VWAP plots to **reduce clutter** and focus on the most relevant timeframes.
- Includes options for **short-term, medium-term, and long-term VWAPs**.
6. **Comprehensive Timeframe Coverage:**
- From **12-minute intervals** to **12-month intervals**, this script covers all major timeframes.
- Perfect for traders who analyze markets across multiple horizons.
7. **User-Friendly Inputs:**
- Intuitive input options for **timeframes, colors, labels, and offsets**.
- Easily customize the script to match your trading preferences.
8. **Dynamic Label Positioning:**
- Labels adjust automatically based on price movements and session changes.
- Choose from **multiple offset options** to position labels precisely.
9. **Miscellaneous Customization:**
- Adjust **text color, label size, and price display settings**.
- Enable or disable **price values** and **session type labels** for a cleaner chart.
---
### **Why Use This Script?**
- **Versatility:** Suitable for all trading styles, including scalping, day trading, swing trading, and long-term investing.
- **Precision:** Accurate VWAP calculations across multiple timeframes ensure you never miss key price levels.
- **Customization:** Tailor the script to your specific needs with a wide range of input options.
- **Clarity:** Dynamic labels and customizable plots make it easy to interpret market trends at a glance.
---
### **How It Works:**
1. **Select Your Price Source:**
- Choose the price source (e.g., Open, Close, HL2) for VWAP calculation based on your trading strategy.
2. **Choose Timeframes:**
- Define the timeframes for VWAP calculation, from intraday to yearly intervals.
3. **Customize Labels and Plots:**
- Enable or disable labels and plots for each timeframe.
- Adjust colors, sizes, and offsets to match your chart setup.
4. **Analyze Market Trends:**
- Use the VWAP lines and labels to identify **support/resistance levels**, **trend direction**, and **potential reversal points**.
5. **Adapt to Market Conditions:**
- Switch between timeframes and price sources to adapt to changing market conditions.
---
### **Ideal For:**
- **Day Traders:** Use short-term VWAPs (e.g., 12-minute, 48-minute) to identify intraday trends and key levels.
- **Swing Traders:** Leverage medium-term VWAPs (e.g., 96-minute, daily) to spot swing opportunities.
- **Long-Term Investors:** Analyze long-term VWAPs (e.g., weekly, monthly) to gauge overall market direction.
---
### **How to Get Started:**
1. Add the script to your TradingView chart.
2. Customize the inputs to match your trading preferences.
3. Analyze the VWAP lines and labels to make informed trading decisions.
---
### **Pro Tip:**
Combine this script with other technical indicators (e.g., moving averages, RSI) for a **holistic view** of the market. Use the VWAP lines as dynamic support/resistance levels to enhance your entry and exit strategies.
This script is a must-have tool for traders who value precision, flexibility, and clarity. Share it with your audience to help them elevate their trading game. Whether they're beginners or seasoned professionals, this **Multi-Timeframe VWAP Dashboard** will become an essential part of their toolkit.

PRO Scalper(EN)
## What it is
**PRO Scalper** is an intraday price–action and liquidity map that helps you see where the market is likely to move **now**, not just where it has been.
It combines five building blocks that professional scalpers often watch together:
1. **Session Volume-Weighted Average Price (VWAP)** — the intraday “fair value” anchor.
2. **Opening Range** — the first minutes of the session that set the day’s balance.
3. **Trend filter** — higher-timeframe bias using **Exponential Moving Averages (EMA)** and optional **Average Directional Index (ADX)** strength.
4. **Two independent Supply/Demand zone engines** — zones are drawn from confirmed swing pivots, with midlines and **touch counters**.
5. **Order-flow style visuals**:
* **Delta bubbles** (green/red circles) show where buying or selling pressure was unusually strong, using a safe **delta proxy** (no external feeds).
* **Liquidity densities** (subtle rectangular bands) highlight clusters of large activity that often act as magnets or barriers and disappear when “eaten” by strong moves.
This mix gives you a **complete intraday picture**: the mean (VWAP), the day’s initial balance (Opening Range), the higher-timeframe push (trend filter), the nearby fuel or brakes (zones), and the live pressure points (bubbles and densities).
---
## Why these components
* **VWAP** tracks where the bulk of traded value sits. Price tends to rotate around it or accelerate away from it — a perfect compass for scalps.
* **Opening Range** frames the early auction. Many intraday breaks, fades and retests start at its boundaries.
* **EMA bias + ADX strength** separates trending conditions from chop, so you can keep only the zones that agree with the bigger push.
* **Pivot-based zones (two pairs at once)** are simple, objective and fast. Midlines help with confirmations; touch counters quantify how many times the zone was tested.
* **Bubbles and densities** add the “effort” layer: where the push appeared and where liquidity is concentrated. You see **where** a move is likely to continue or fail.
Together they reduce ambiguity: **context + level + effort** — all on one screen.
---
## How it works (plain language)
* **VWAP** resets each day and is calculated as the cumulative sum of typical price multiplied by volume divided by total volume.
* **Opening Range** is either automatic (a multiple of your chart timeframe) or a manual number of minutes. While it is forming, the highest high and lowest low are captured and plotted as the range.
* **Trend filter**
* **EMA Fast** and **EMA Slow** define directional bias.
* **ADX (optional)** adds “trend strength”: only when the Average Directional Index is above the chosen threshold do we treat the move as strong. You can source this from a higher timeframe.
* **Zones**
* There are **two independent pairs** of pivots at the same time (for example 10-left 10-right and 5-left 5-right).
* Each detected pivot creates a **Supply** (from a swing high) or **Demand** (from a swing low) box. Box depth = **zone depth × Average True Range** for adaptive sizing; the boxes **extend forward**.
* Midline (optional dashed line inside the box) is the “balance” of the zone.
* **“Only in trend”** mode can hide boxes that go against the higher-timeframe bias.
* The **touch counter** increases when price revisits the box. Labels show the pair name and the number of touches.
* **Bubbles**
* A safe **delta proxy** measures bar pressure (for example, range-weighted close vs open).
* A **quantile filter** shows only unusually large pressure: choose lookback and percentile, and the script draws a circle sized by intensity (green = bullish pressure, red = bearish).
* **Densities**
* The script marks heavy activity clusters as **subtle bands** around price (depth = fraction of Average True Range).
* If price **breaks** a density with volume above its moving average, the band **disappears** (“eaten”), which often precedes continuation.
---
## How to use — practical playbooks
> Recommended chart: crypto or index futures, one to five minutes. Use **one hour** or **fifteen minutes** for the higher-timeframe bias.
### 1) Trend pullback scalp (continuation)
1. Enable **Only in trend** zones.
2. In an uptrend: wait for a pullback into a **Demand** zone that overlaps with VWAP or sits just below the Opening Range midpoint.
3. Look for **green bubbles** near the zone’s bottom or a fresh **density** under price.
4. Enter on a candle closing **back above the zone midline**.
5. Stop-loss: below the bottom of the zone or a small multiple of Average True Range.
6. Targets: previous swing high, Opening Range high, fixed risk multiples, or VWAP.
Mirror the logic for downtrends using Supply zones, red bubbles and densities above price.
### 2) Reversion with liquidity sweep (fade)
1. Bias neutral or countertrend allowed.
2. Price **wicks through** a zone boundary (or an Opening Range line) and **closes back inside** the zone.
3. The bubble color often flips (absorption).
4. Enter toward the **inside** of the zone; stop beyond the sweep wick; first target = zone midline, second = opposite side of the zone or VWAP.
### 3) Opening Range break and retest
1. Wait for the Opening Range to complete.
2. A break with a large bubble suggests intent.
3. Look for a **retest** into a nearby zone aligned with VWAP.
4. Trade continuation toward the next zone or the session extremes.
### 4) Density “eaten” continuation
1. When a density band **disappears** on high volume, it often means the resting liquidity was consumed.
2. Trade in the direction of the break, toward the nearest opposing zone.
---
## Settings — quick guide
**Core**
* *ATR Length* — used for zone and density depths.
* *Show VWAP / Show Opening Range*.
* *Opening Range*: Auto (multiple of timeframe minutes) or Manual minutes.
**Trend Filter**
* *Mode*: Off, EMA only, or EMA with ADX strength.
* *Use higher timeframe* and its value.
* *EMA Fast / EMA Slow*, *ADX Length*, *ADX threshold*.
* *Plot EMA filter* to display the moving averages.
**Zones (two pairs)**
* *Pivot A Left / Right* and *Pivot B Left / Right*.
* *Zone depth × ATR*, *Extend bars*.
* *Show zone midline*, *Only in trend zones*.
* Labels automatically show the touch counters.
**Bubbles**
* *Show Bubbles*.
* *Quantile lookback* and *Quantile percent* (higher percent = stricter filter, fewer bubbles).
**Densities**
* *Metric*: absolute delta proxy or raw volume.
* *Quantile lookback / percent*.
* *Depth × ATR*, *Extend bars*, *Merge distance* (in ATR),
* *Break condition*: volume moving average length and multiplier,
* *Midline for densities* (optional dashed line).
---
## Tips and risk management
* This script **does not use external order-flow feeds**. Delta is a **proxy** suitable for TradingView; tune quantiles per symbol and timeframe.
* Do not trade every bubble. Combine **context (trend + VWAP + Opening Range)** with **level (zone)** and **effort (bubble/density)**.
* Set stop-losses beyond the zone or at a fraction of Average True Range. Predefine risk per trade.
* Backtest your rules with a strategy script before using real funds.
* Markets differ. Parameters that work on Bitcoin may not transfer to low-liquidity altcoins or stocks.
* Nothing here is financial advice. Scalping is high-risk; slippage and over-trading can quickly damage your account.
---
## What makes PRO Scalper unique
* Two **independent** zone engines run in parallel, so you can see both **larger structure** and **fine intraday levels** at the same time.
* Clean **“only in trend” rendering** — zones and midlines against the bias can be hidden, reducing clutter and hesitation.
* **Touch counters** convert “feel” into numbers.
* **Self-contained order-flow visuals** (bubbles and densities) that require no extra data sources.
* Careful defaults: subtle colors for densities, clearer zones, and responsive auto Opening Range.
---
(RU)
## Что это такое
**PRO Scalper** — это индикатор для внутридневной торговли, который показывает **контекст и ликвидность прямо сейчас**.
Он объединяет пять модулей, которыми профессиональные скальперы пользуются вместе:
1. **VWAP** — средневзвешенная по объему цена за сессию, «справедливая стоимость» дня.
2. **Opening Range** — первая часть сессии, задающая баланс дня.
3. **Фильтр тренда** — направление старшего таймфрейма по **экспоненциальным средним** и при желании по силе тренда **Average Directional Index**.
4. **Две независимые системы зон спроса/предложения** — зоны строятся от подтвержденных экстремумов (пивотов), имеют **среднюю линию** и **счетчик касаний**.
5. **Визуализация «ордер-флоу»**:
* **Пузыри дельты** (зеленые/красные круги) — места повышенного покупательного/продажного давления, рассчитанные через безопасный **прокси-дельты**.
* **Плотности ликвидности** (ненавязчивые прямоугольные ленты) — скопления объема, которые нередко притягивают цену или удерживают ее и исчезают, когда «разъедаются» сильным движением.
Итог — **полная картинка момента**: среднее (VWAP), баланс дня (Opening Range), старшая сила (фильтр тренда), ближайшие уровни топлива/тормозов (зоны), текущие точки усилия (пузыри и плотности).
---
## Почему именно эти элементы
* **VWAP** показывает, где сосредоточена стоимость; цена либо вращается вокруг него, либо быстро уходит — идеальный ориентир скальпера.
* **Opening Range** фиксирует ранний аукцион — от его границ часто начинаются пробои, возвраты и ретесты.
* **EMA + ADX** отделяют тренд от «пилы», позволяя оставлять на графике только зоны по направлению старшего таймфрейма.
* **Зоны от пивотов** просты, объективны и быстры; средняя линия помогает подтверждать разворот, счетчик касаний переводит субъективность в цифры.
* **Пузыри и плотности** добавляют слой «усилия»: где именно возник толчок и где сконцентрирована ликвидность.
Комбинация **контекста + уровня + усилия** уменьшает двусмысленность и ускоряет принятие решения.
---
## Как это работает (простыми словами)
* **VWAP** каждый день стартует заново: сумма «типичной цены × объем» делится на суммарный объем.
* **Opening Range** — автоматический (кратный минутам вашего таймфрейма) или вручную заданный период; пока он формируется, фиксируются максимум и минимум.
* **Фильтр тренда**
* Две экспоненциальные средние задают направление.
* **ADX** (по желанию) добавляет «силу». Источник можно взять со старшего таймфрейма.
* **Зоны**
* Одновременно работает **две пары** пивотов (например 10-лево 10-право и 5-лево 5-право).
* От пивота строится зона **предложения** (от максимума) или **спроса** (от минимума). Глубина зоны = **коэффициент × Average True Range**; зона тянется вперед.
* Внутри рисуется **средняя линия** (по желанию).
* Режим **«только по тренду»** скрывает зоны против старшего направления.
* **Счетчик касаний** увеличивается, когда цена снова входит в зону; подпись показывает пару и количество касаний.
* **Пузыри**
* Используется безопасный **прокси-дельты** — измерение «напряжения» внутри свечи.
* Через **квантильный фильтр** выводятся только необычно сильные места: настраиваются окно и процент квантиля; размер кружка — сила, цвет: зеленый покупатели, красный продавцы.
* **Плотности**
* Крупные активности отмечаются **ненавязчивыми прямоугольниками** (глубина — доля Average True Range).
* Если плотность **пробивается** объемом выше среднего, она **исчезает** — часто это предвещает продолжение.
---
## Как пользоваться — практические схемы
> Рекомендация: крипто или фьючерсы, таймфрейм 1–5 минут. Для старшего фильтра удобно взять **1 час** или **15 минут**.
### 1) Скальп на откат по тренду
1. Включите **«только по тренду»**.
2. В восходящем тренде дождитесь отката в **зону спроса**, желательно рядом с **VWAP** или серединой **Opening Range**.
3. Подтверждение — **зеленые пузыри** у нижней границы зоны или свежая **плотность** под ценой.
4. Вход после закрытия свечи **выше средней линии** зоны.
5. Стоп-лосс: за нижнюю границу зоны или небольшой множитель Average True Range.
6. Цели: предыдущий максимум, верх Opening Range, фиксированные R-множители, либо VWAP.
Для нисходящего тренда зеркально: зоны предложения, красные пузыри и плотности над ценой.
### 2) Контрдвижение с «выбиванием ликвидности»
1. Нейтральный или контртрендовый режим.
2. Цена **выносит хвостом** границу зоны (или линию Opening Range) и **закрывается обратно внутри**.
3. Цвет пузыря часто меняется (поглощение).
4. Вход внутрь зоны; стоп — за хвост выбивания; цели: средняя линия, противоположная граница зоны или VWAP.
### 3) Пробой Opening Range + ретест
1. Дождитесь завершения диапазона.
2. Сильный пробой с крупным пузырем — признак намерения.
3. Ищите **ретест** в зоне по тренду рядом с линией диапазона и VWAP.
4. Торгуйте продолжение к следующей зоне.
### 4) Продолжение после «съеденной» плотности
1. Когда прямоугольник плотности **исчезает** на повышенном объеме, это значит, что ликвидность поглощена.
2. Торгуйте в сторону пробоя к ближайшей противоположной зоне.
---
## Настройки — краткая шпаргалка
**Core**
— Длина Average True Range (для размеров зон и плотностей).
— Включение VWAP и Opening Range.
— Длина Opening Range: автоматическая (кратная минутам ТФ) или ручная.
**Trend Filter**
— Режим: выкл., только средние, либо средние + ADX.
— Источник со старшего таймфрейма и его значение.
— Длины средних, длина ADX и порог силы.
— Показать/скрыть линий средних.
**Zones (две пары одновременно)**
— Пара A: лев/прав; Пара B: лев/прав.
— Глубина зоны × Average True Range, продление по барам.
— Средняя линия, режим **«только по тренду»**.
— Подписи со счетчиком касаний.
**Bubbles**
— Вкл./выкл., окно поиска и процент квантиля (чем выше процент — тем реже пузыри).
**Densities**
— Метрика: абсолютная прокси-дельты или чистый объем.
— Окно/квантиль, глубина × Average True Range, продление,
— Порог объединения (в Average True Range),
— Условие «разъедания» по объему,
— Средняя линия плотности (по желанию).
---
## Советы и риски
* Индикатор **не использует внешние потоки ордер-флоу**. Дельта — **прокси**, подходящая для TradingView; подбирайте квантили под инструмент и таймфрейм.
* Не торгуйте каждый пузырь. Склейте **контекст (тренд + VWAP + Opening Range)** с **уровнем (зона)** и **усилием (пузырь/плотность)**.
* Стоп-лосс — за границей зоны или по Average True Range. Риск на сделку задавайте заранее.
* Перед реальными деньгами протестируйте правила в стратегии.
* Разные рынки ведут себя по-разному; настройки из Биткоина могут не подойти малоликвидным альткоинам или акциям.
* Это не инвестиционная рекомендация. Скальпинг — высокий риск; проскальзывание и переизбыток сделок быстро наносят ущерб капиталу.
---
## Чем уникален PRO Scalper
* Две **одновременные** системы зон показывают и **крупную структуру**, и **точные локальные уровни**.
* Режим **«только по тренду»** чистит экран от лишних уровней и ускоряет решение.
* **Счетчики касаний** дают количественную опору.
* **Самодостаточные визуализации усилия** (пузыри и плотности) — без сторонних источников данных.
* Аккуратная цветовая схема: плотности — мягко, зоны — ясно; Opening Range — адаптивный.
Пусть он станет вашей «картой местности» для быстрых и дисциплинированных решений внутри дня.

Apex ICT Delivery & Session Flow ProDescription
The Apex ICT Delivery & Session Flow Pro is a high-precision technical analysis indicator designed for inner-circle traders who prioritize a clean, institutional-grade chart. This script specializes in identifying real-time liquidity levels and displacement zones while utilizing an automated "Cleanup Engine" to ensure that only the most relevant, unmitigated data remains visible.
Core Functionalities
Multi-Timeframe Displacement Engine: The script scans across multiple timeframes (1m, 5m, 15m, 1H) to identify Fair Value Gaps (FVG) created by high-displacement price action. It automatically plots the FVG boxes and the 50% Consequent Encroachment (CE) line for precise entry and target mapping.
Dynamic Session Liquidity: Automatically identifies and tracks the Highs and Lows of the Asia, London, and New York sessions. These levels are explicitly labeled and extended to act as magnet levels for price or points of liquidity reversal.
CISD (Change in State of Delivery): Visualizes shifts in order flow by marking the opening prices of the last opposite candle when price action confirms a change in delivery state. This provides immediate visual feedback on market sentiment shifts.
NY-Specific VWAP: Features a strict New York Session VWAP that resets daily at the NY open (08:00). This serves as the "Mean" for the session, helping traders identify premium and discount zones specifically within the high-volume New York hours.
The "Clean Chart" Cleanup Engine: Unlike standard indicators that clutter the screen with historical data, this script features an intelligent removal system:
FVGs & Order Blocks: Automatically deleted once price trades through them or if they move too far from current price (Proximity Filter).
Broken Session Levels: Highs and Lows are instantly removed once they are breached by price.
Temporal Decay: CISD markers are automatically cleared after 20 candles to keep the focus on immediate delivery.

HMK-2 | PCA-1 + Rejim + Chebyshev + VWAP (Input'lu, v6)📌 HMK-2 | PCA-1 + Regime + Chebyshev + VWAP Strategy
1️⃣ Core Structure
Instead of relying on a single indicator, this system uses the Z-Score normalized average of three oscillators (RSI, MFI, ROC).
Signal (PCA-1):
RSI(14), MFI(14), ROC(5) → each is converted into a z-score.
Their average becomes the “composite signal,” our PCA-1 value.
Trend direction: If the Z-score EMA is rising → trend UP. If falling → trend DOWN.
2️⃣ Side Filters
Regime Filter (ADX + EMA)
ADX is calculated manually.
If ADX > 20 → trend exists → a 50-period EMA of this value smooths it.
This turns “trend regime” into a probability between 0–1.
Chebyshev Filter
A return series is checked against mean ± k*sigma bands.
If the return is within this band → valid signal. Extreme moves are filtered out.
VWAP Filter
Long trades: price must be above VWAP.
Short trades: price must be below VWAP.
Trades are only taken on the correct side of institutional cost averages.
3️⃣ Entry Conditions
Long:
PCA-1 signal crosses above threshold.
Trend Up + Regime OK + Chebyshev OK + Above VWAP.
Short:
PCA-1 signal crosses below threshold.
Trend Down + Regime OK + Chebyshev OK + Below VWAP.
4️⃣ Exit Mechanism
Main Exit: ATR-based stop/target.
Stop = entry price – ATR × (SL factor).
Take profit = entry price + ATR × (TP factor).
Additional Exit:
If price crosses to the opposite side of VWAP.
If PCA-1 signal crosses zero.
👉 Prevents trades from being locked, makes exits adaptive.
5️⃣ Labels / Visualization
AL / SHORT → entry points.
SAT / COVER → exit points.
VWAP line plotted in blue.
🧩 Strategy Features
Optimizable parameters:
Z-window (zWin)
Threshold
Chebyshev factor
ATR stop/target multipliers
This system works with:
Disciplined core (PCA-1 signal)
Triple protection (Regime + Chebyshev + VWAP)
Adaptive exits (ATR + VWAP/signal cross)
👉 Not a “single-indicator robot,” but a multi-filtered trade direction engine.
💡 Final Note
This is a base model of the system — open for further development.
I’ve shared the logic to give you a roadmap.
If you spot errors, fix them → that’s how you’ll improve it.
Don’t waste time asking me questions — refine and build it better yourselves.
Wishing you profitable trades. Stay well 🙏

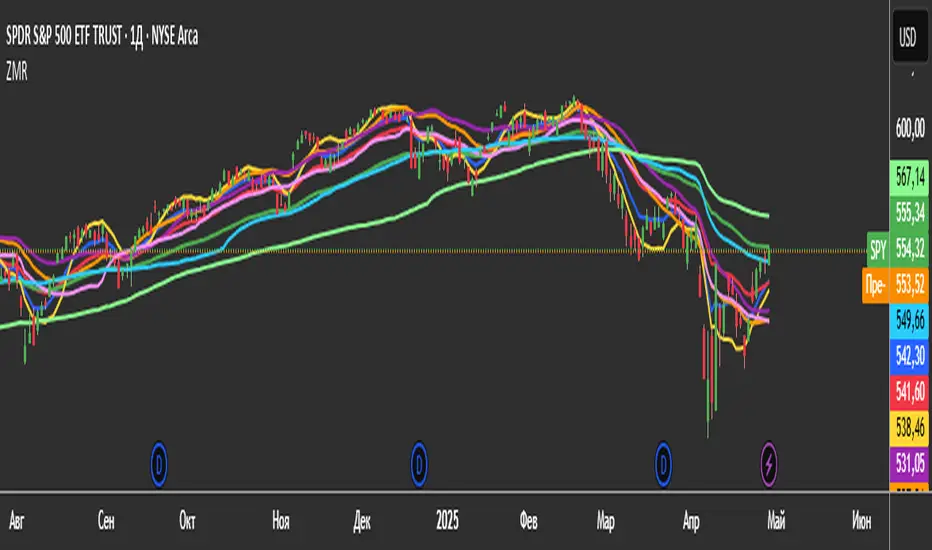
3 Zero Lag + 3 Moving Averages + 3 RVWAPThe "3 Zero Lag + 3 Moving Averages + 3 RVWAP" (ZMR) indicator combines three groups of tools for technical analysis.
1. Three Customizable Moving Averages (MAs):
Configuration for Each MA:
Choice of 7 types (SMA, EMA, WMA, HMA, VWMA, LSMA, SMMA).
Independent periods and price sources for each line.
Visualization:
MA1 (Blue), MA2 (Red), MA3 (Green).
2. Three Zero Lag EMAs (ZLEMA) with Individual Settings:
Lag Reduction: Corrects traditional EMA lag using:
Adjusted Price = 2 * Current Price - Price .
Flexibility:
Unique lengths (20, 50, 70) and individual price sources for each ZLEMA (HLC3, HL2, Close, etc.).
Colors:
ZLEMA1 (Yellow), ZLEMA2 (Orange), ZLEMA3 (Purple).
3. Three Rolling VWAPs with Custom Parameters:
Volume-Weighted Average Price (VWAP):
Calculated for three periods (20, 50, 100) with dedicated price sources for each VWAP.
Colors:
VWAP1 (Pink), VWAP2 (Light Blue), VWAP3 (Neon Green).
Rumpy's Multi Interval Extended VWAPsExperiment with various intervals of VWAPs and extending them 1 & 2 extra intervals. Uses base intervals from the standard 1 day to half yearly intervals (day/month/quarterly/half yearly).
VWAPs are calculated by the sum of typical price x volume divided by sum volume over the interval. With the 1 D (standard vwap ) the sums reset to zero at the end of the day.
The extensions instead of resetting to zero continues the calculation. Extending the interval an additional interval length.
Technically this means in the case of the standard VWAP that the 1st extension is actually the 2nd day of a 2 Day interval VWAP and the 2nd extension is the 3rd day of a 3 Day interval VWAP .
Same goes for the other intervals eg.
1 Month VWAP =>
1st extension : 2nd Month of a 2 Month interval VWAP
2nd extension : 3rd Month of a 3 Month interval VWAP
2nd extensions are disabled by default as there is usually often overlap, however there can be notable exceptions (such as the current 2nd Monthly extension on BTCUSD )
--------------------------------------
If you find it useful please consider a tip/donation :
BTC - 3BMEXEDyWJ58eXUEALYPadbn1wwWKmf6sA
--------------------------------------

FlowFusion Money Flow — FP + VWAP Drift + PVT (−100..+100)Title (ASCII only)
FlowFusion Money Flow — Flow Pressure + Rolling VWAP Drift + PVT (Normalized −100..+100)
Short Description
Original money-flow oscillator combining Flow Pressure, Rolling VWAP Drift, and PVT Momentum into one normalized score (−100..+100) with a signal line, thresholds, optional component plots, and ready-made alerts.
Full Description (meets “originality & usefulness”)
What’s original
FlowFusion Money Flow is not a generic mashup. It builds a single score from three complementary, volume-aware components that target different facets of order flow:
Flow Pressure (FP) — In-bar directional drive scaled by relative volume.
Drive
=
close
−
open
max
(
high
−
low
,
tick
)
∈
=
max(high−low, tick)
close−open
∈ .
Relative Volume
=
volume
average volume over
𝑓
𝑝
𝐿
𝑒
𝑛
=
average volume over fpLen
volume
.
𝐹
𝑃
𝑟
𝑎
𝑤
=
Drive
×
RelVol
FP
raw
=Drive×RelVol then squashed (softsign) to
.
Why it belongs: distinguishes real pushes (big body and big volume) from noise.
Rolling VWAP Drift — Direction of VWAP itself over a rolling window, normalized by ATR.
𝑉
𝑊
𝐴
𝑃
𝑡
=
∑
(
𝑇
𝑃
×
𝑉
𝑜
𝑙
)
∑
𝑉
𝑜
𝑙
VWAP
t
=
∑Vol
∑(TP×Vol)
over vwapLen.
Drift
=
𝑉
𝑊
𝐴
𝑃
𝑡
−
𝑉
𝑊
𝐴
𝑃
𝑡
−
1
𝐴
𝑇
𝑅
=
ATR
VWAP
t
−VWAP
t−1
→ squashed to
.
Why it belongs: persistent VWAP movement signals sustained accumulation/distribution.
PVT Momentum — Price-Volume Trend standardized (z-score) and squashed.
𝑃
𝑉
𝑇
𝑡
=
𝑃
𝑉
𝑇
𝑡
−
1
+
𝑉
𝑜
𝑙
×
Δ
𝐶
𝑙
𝑜
𝑠
𝑒
𝐶
𝑙
𝑜
𝑠
𝑒
𝑡
−
1
PVT
t
=PVT
t−1
+Vol×
Close
t−1
ΔClose
.
𝑧
=
𝑃
𝑉
𝑇
−
SMA
(
𝑃
𝑉
𝑇
)
StDev
(
𝑃
𝑉
𝑇
)
z=
StDev(PVT)
PVT−SMA(PVT)
→ squashed to
.
Why it belongs: captures volume-weighted trend pressure without relying on price alone.
Composite score:
Score
=
𝑤
𝐹
𝑃
⋅
𝐹
𝑃
+
𝑤
𝑉
𝑊
𝐴
𝑃
⋅
𝑉
𝑊
𝐴
𝑃
_
𝐷
𝑟
𝑖
𝑓
𝑡
+
𝑤
𝑃
𝑉
𝑇
⋅
𝑃
𝑉
𝑇
_
𝑀
𝑜
𝑚
𝑤
𝐹
𝑃
+
𝑤
𝑉
𝑊
𝐴
𝑃
+
𝑤
𝑃
𝑉
𝑇
Score=
w
FP
+w
VWAP
+w
PVT
w
FP
⋅FP+w
VWAP
⋅VWAP_Drift+w
PVT
⋅PVT_Mom
with a Signal = SMA(Score, sigLen). Thresholds mark strong accumulation/distribution zones.
How it works (step-by-step)
Compute FP, VWAP Drift, PVT Momentum.
Normalize each to the same
scale.
Weighted average → FlowFusion Score.
Smooth with a Signal line to reduce whipsaw.
Optional background shading when Score exceeds thresholds.
How to use
Direction filter:
Score > 0 favors longs; Score < 0 favors shorts.
Momentum turns:
Score crosses above Signal → setup for long; below → setup for short.
Strength zones:
Above Upper Threshold (default +40) = strong buy pressure; below Lower (−40) = strong sell pressure.
Confluence:
Best near S/R, trendlines, or HTF bias. For scalping on 1–5m, consider sigLen 9–13 and thresholds ±40 to ±50.
Alerts included: zero cross, zone entries, and Score/Signal crossovers.
Inputs (key)
fpLen (20): relative-volume lookback for Flow Pressure.
vwapLen (34): rolling VWAP window.
pvtLen (50): PVT z-score window.
sigLen (9): Signal smoothing.
Weights: wFP, wVWAP, wPVT to bias the blend.
Thresholds: upperBand / lowerBand (defaults +40/−40).
Display: toggle component plots and background shading.
Best practices
Trending markets: increase wVWAP (VWAP Drift) or widen thresholds.
Ranging markets: increase wFP and wPVT; take quicker profits.
News: wait for bar close confirmation or reduce size.
Data quality: use consistent volume feeds (especially in crypto).
Limitations
Oscillators can stay extreme in strong trends; use structure/trend filters.
Volume anomalies (illiquid pairs, API glitches) can distort signals—sanity-check with another venue when possible.
Disclaimer
This indicator is for educational purposes only and is not financial advice. Trading involves risk; past performance does not guarantee future results. Always paper-trade first and use appropriate risk controls.

Baekdoo VWAP & High-Volume Node Momentum Breakout (V6)Indicator Name: Baekdoo VWAP & High-Volume Node Momentum Breakout (V6)
Description Summary: This indicator tracks the interaction between the VWAP (Volume Weighted Average Price)—the market's "fair value"—and the High-Volume Node (Resistance) from the past 20 bars. The goal is to identify "True Breakouts" where the average entry price of all participants, not just the spot price, successfully surmounts a major supply zone.
Key Features:
Annual Cumulative VWAP: Uses a yearly-anchored VWAP to filter out daily noise on 1D charts and provide a stable trend baseline.
Volume-Based Resistance: Identifies the high of the candle with the maximum volume over 20 periods as a critical supply wall.
Institutional Volume Filter: Signals are only triggered when volume exceeds 2x the 5-day average, ensuring significant market interest.
Dual Exit Strategy: Incorporates a 1.5 ATR Trailing Stop for partial profit-taking and a 20 SMA crossunder for a full risk-off exit.
---------------
지표 명칭: 백두 VWAP 매물대 모멘텀 돌파 전략 (V6)
설명 요약: 본 지표는 시장의 평균 합의 가격인 **VWAP(Volume Weighted Average Price)**과 최근 20일간 가장 강력한 거래가 발생한 **매물대(High Volume Node)**의 상호작용을 추적합니다. 단순히 가격이 뚫는 것이 아니라, 시장 참여자들의 평균 단가 자체가 저항선을 넘어서는 '진성 돌파'를 포착하는 데 목적이 있습니다.
주요 특징:
연간 누적 VWAP: 일봉 차트에서의 노이즈를 줄이기 위해 연간 단위로 누적된 평균 단가를 사용합니다.
매물대 저항선: 지난 20일 중 최대 거래량이 터진 봉의 고점을 저항선으로 설정하여, 악성 매물이 쏟아질 수 있는 구간을 시각화합니다.
거래량 필터: 5일 평균 거래량 대비 2배 이상의 거래가 실릴 때만 신호를 발생시켜 기관 및 세력의 개입 여부를 확인합니다.
스마트 엑싯: 1.5 ATR 트레일링 스톱을 통한 수익 보존과 20일 이평선 이탈을 통한 리스크 관리를 동시에 수행합니다.

NASDAQ VWAP Distance Histogram (Multi-Symbol)📊 VWAP Distance Histogram (Multi-Symbol)
This custom indicator plots a histogram of price strength relative to the VWAP (Volume-Weighted Average Price).
The zero line is VWAP.
Histogram bars above zero = price trading above VWAP (strength).
Histogram bars below zero = price trading below VWAP (weakness).
Unlike a standard VWAP overlay, this tool lets you monitor multiple symbols at once and aggregates them into a single, easy-to-read histogram.
🔑 Features
Multi-Symbol Support → Track up to 10 different tickers plus the chart symbol.
Aggregation Options → Choose between average or median deviation across enabled symbols.
Percent or Raw Values → Display distance from VWAP as % of price or raw price points.
Smoothing → Apply EMA smoothing to calm intraday noise.
Color-Coded Histogram → Green above VWAP, red below.
Alerts → Trigger when the aggregate crosses above/below VWAP.
Heads-Up Table → Shows number of symbols tracked and current aggregate reading.
⚡ Use Cases
Market Breadth via VWAP → Monitor whether your basket of stocks is trading above or below VWAP.
Index Substitution → Create your own “mini index” by tracking a hand-picked set of tickers.
Intraday Confirmation → Use aggregate VWAP strength/weakness to confirm entries and exits.
Relative Strength Spotting → Switch on/off specific tickers to see who’s holding above VWAP vs. breaking down.
🛠️ Settings
Include Chart Symbol → Toggle to include the current chart’s ticker.
Smoothing → EMA length (set to 0 to disable).
Percent Mode → Show results as % of price vs. raw difference.
Aggregate Mode → Average or median across all active symbols.
Symbol Slots (S1–S10) → Enter tickers to track alongside the chart.
⚠️ Notes
Works best on intraday charts since VWAP is session-based.
Designed for confirmation, not as a standalone entry/exit signal.
Ensure correct symbol format (e.g., NASDAQ:AAPL if needed).
✅ Tip: Combine this with your regular price action strategy. For example, if your setup triggers long and the histogram is well above zero, that’s added confirmation. If it’s below zero, caution — the basket shows weakness.

Intraday Sentiment DynamicsThe purpose of this script is to create a structured model of intraday sentiment by analyzing how price behaves relative to VWAP. Instead of treating VWAP deviation as a simple overbought or oversold measure, the script aims to understand the dynamics behind that deviation — how quickly sentiment is shifting, whether that shift is strengthening or weakening, and when abrupt changes in behaviour occur. Its goal is to provide a standardized, volatility‑adjusted framework that helps traders identify trend continuation, trend exhaustion, mean‑reversion setups, and early regime shifts.
To achieve this, the script begins by calculating the difference between the bar’s midpoint and VWAP. This raw deviation is then standardized using a rolling mean and standard deviation, producing a z‑score that expresses how far price is from VWAP in statistical terms. Standardization removes volatility bias, session drift, and asset‑specific scaling issues, making the signal comparable across different market conditions. A weighted moving average smooths this standardized deviation to reduce noise and prepare it for slope‑based analysis.
The core of the script is a slope‑normalization mechanism that measures how the standardized VWAP deviation changes over time. For each bar, the script computes the slope over a user‑defined length, separates positive and negative slope events, and maintains these in arrays that track their recent behaviour. From these arrays, it calculates average magnitudes and standard deviations, allowing it to normalize the current slope into a consistent, volatility‑adjusted scale. This ensures that both small and extreme slope events are interpreted meaningfully.
This normalization function is applied recursively to generate three higher‑order derivatives. The first derivative, velocity, represents the rate at which sentiment is moving toward or away from VWAP. The second derivative, acceleration, measures whether this movement is strengthening or weakening. The third derivative, jerk, captures sudden changes in acceleration and serves as an early indicator of shifts in market behaviour. Together, these derivatives form a multi‑layered behavioural model that reveals the internal structure of intraday sentiment.
The script visualizes these components using distinct color families and filled regions that highlight positive and negative behaviour. Background shading reinforces the dominant direction of each derivative, making it easy to see when sentiment is building, fading, or reversing. The standardized VWAP deviation is plotted alongside these derivatives, and horizontal lines at ±1, ±2, and ±3 standard deviations provide a statistical frame of reference for identifying extreme conditions.
In practical trading terms, the indicator helps identify strong continuation environments when velocity, acceleration, and jerk align in the same direction. It highlights early signs of trend exhaustion when jerk flips before acceleration, often preceding reversals. It supports mean‑reversion trades when VWAP deviation reaches extreme levels and the derivative chain begins to weaken. It also detects regime shifts when jerk spikes, helping traders avoid traps during sudden liquidity events or fake breakouts. By converting VWAP deviation into a structured, derivative‑based model, the script provides a clear and actionable view of intraday sentiment dynamics.

PivotBoss VWAP Bands (Auto TF) - FixedWhat this indicator shows (high level)
The indicator plots a VWAP line and three bands above (R1, R2, R3) and three bands below (S1, S2, S3).
Band spacing is computed from STD(abs(VWAP − price), N) and multiplied by 1, 2 and 3 to form R1–R3 / S1–S3. The script is timeframe-aware: on 30m/1H charts it uses Weekly VWAP and weekly bands; on Daily charts it uses Monthly VWAP and monthly bands; otherwise it uses the session/chart VWAP.
VWAP = the market’s volume-weighted average price (a measure of fair value). Bands = volatility-scaled zones around that fair value.
Trading idea — concept summary
VWAP = fair value. Price above VWAP implies bullish bias; below VWAP implies bearish bias.
Bands = graded overbought/oversold zones. R1/S1 are near-term limits, R2/S2 are stronger, R3/S3 are extreme.
Use trend alignment + price action + volume to choose higher-probability trades. VWAP bands give location and magnitude; confirmations reduce false signals.
Entry rules (multiple strategies with examples)
A. Momentum breakout (trend-following) — preferred on trending markets
Setup: Price consolidates near or below R1 and then closes above R1 with above-average volume. Chart: 30m/1H (Weekly VWAP) or Daily (Monthly VWAP) depending on your timeframe.
Entry: Enter long at the close of the breakout bar that closes above R1.
Stop-loss: Place initial stop below the higher of (VWAP or recent swing low). Example: if price broke R1 at ₹1,200 and VWAP = ₹1,150, set stop at ₹1,145 (5 rupee buffer below VWAP) or below the last swing low if that is wider.
Target: Partial target at R2, full target at R3. Trail stop to VWAP or to R1 after price reaches R2.
Example numeric: Weekly VWAP = ₹1,150, R1 = ₹1,200, R2 = ₹1,260. Buy at ₹1,205 (close above R1), stop ₹1,145, target1 ₹1,260 (R2), target2 ₹1,320 (R3).
B. Mean-reversion fade near bands — for range-bound markets
Setup: Market is not trending (VWAP flatish). Price rallies up to R2 or R3 and shows rejection (pin bar, bearish engulfing) on increasing or neutral volume.
Entry: Enter short after a confirmed rejection candle that fails to sustain above R2 or R3 (prefer confirmation: close back below R1 or below the rejection candle low).
Stop-loss: Just above the recent high (e.g., 1–2 ATR or a fixed buffer above R2/R3).
Target: First target VWAP, second target S1. Reduce size if taking R3 fade as it’s an extreme.
Example numeric: VWAP = ₹950, R2 = ₹1,020. Price spikes to ₹1,025 and forms a bearish engulfing candle. Enter short at ₹1,015 after the next close below ₹1,020. Stop at ₹1,035, target VWAP ₹950.
C. Pullback entries in trending markets — higher probability
Setup: Price is above VWAP and trending higher (higher highs and higher lows). Price pulls back toward VWAP or S1 with decreasing downside volume and a reversal candle forms.
Entry: Long when price forms a bullish reversal (hammer/inside-bar) with a close back above the pullback candle.
Stop-loss: Below the pullback low (or below S2 if a larger stop is justified).
Target: VWAP then R1; if momentum resumes, trail toward R2/R3.
Example numeric: Price trending above Weekly VWAP at ₹1,400; pullback to S1 at ₹1,360. Enter long at ₹1,370 when a bullish candle closes; stop at ₹1,350; first target VWAP ₹1,400, second target R1 ₹1,450.
Exit rules and money management
Basic exit hierarchy
Hard stop exit — when price hits initial stop-loss. Always use.
Target exit — take partial profits at R1/R2 (for longs) or S1/S2 (for shorts). Use trailing stops for the remainder.
VWAP invalidation — if you entered long above VWAP and price returns and closes significantly below VWAP, consider exiting (condition depends on timeframe and trade size).
Price action exit — reversal patterns (strong opposite candle, bearish/bullish engulfing) near targets or beyond signals to exit.
Trailing rules
After price reaches R2, move stop to breakeven + a small buffer or to VWAP.
After price reaches R3, trail by 1 ATR or lock a defined profit percentage.
Position sizing & risk
Risk per trade: commonly 0.5–2% of account equity.
Determine position size by RiskAmount ÷ (EntryPrice − StopPrice).
If the stop distance is large (e.g., trading R3 fades), reduce position size.
Filters & confirmation (to reduce false signals)
Volume filter: For breakouts, require volume above short-term average (e.g., >20-period average). Breakouts on low volume are suspect.
Trend filter: Only take breakouts in the direction of the higher-timeframe trend (for example, use Daily/Weekly trend when trading 30m/1H).
Candle confirmation: Prefer entries on close of the confirming candle (not intrabar noise).
Multiple confirmations: When R1 break happens but RSI/plotted momentum indicator does not confirm, treat signal as lower probability.
Special considerations for timeframe-aware logic
On 30m/1H the script uses Weekly VWAP/bands. That means band levels change only on weekly candles — they are strong, structural levels. Treat R1/R2/R3 as significant and expect fewer, stronger signals.
On Daily, the script uses Monthly VWAP/bands. These are wider; trades should allow larger stops and smaller position sizes (or be used for swing trades).
On other intraday charts you get session VWAP (useful for intraday scalps).
Example: If you trade 1H and the Weekly R1 is at ₹2,400 while session VWAP is ₹2,350, a close above Weekly R1 represents a weekly-level breakout — prefer that for swing entries rather than scalps.
Example trade walkthrough (step-by-step)
Context: 1H chart, auto-mapped → Weekly VWAP used.
Weekly VWAP = ₹3,000; R1 = ₹3,080; R2 = ₹3,150.
Price consolidates below R1. A large bullish candle closes at ₹3,085 with volume 40% above the 20-bar average.
Entry: Buy at close ₹3,085.
Stop: Place stop at ₹2,995 (just under Weekly VWAP). Risk = ₹90.
Position size: If risking ₹900 per trade → size = 900 ÷ 90 = 10 units.
Targets: Partial take-profit at R2 = ₹3,150; rest trailed with stop moved to breakeven after R2 is hit.
If price reverses and closes below VWAP within two bars, exit immediately to limit drawdown.
When to avoid trading these signals
High-impact news (earnings, macro announcements) that can gap through bands unpredictably.
Thin markets with low volume — VWAP loses significance when volumes are extremely low.
When weekly/monthly bands are flat but intraday price is volatile without clear structure — prefer session VWAP on smaller timeframes.
Alerts & automation suggestions
Alert on close above R1 / below S1 (use the built-in alertcondition the script adds). For higher-confidence alerts, require volume filter in the alert condition.
Automated order rules (if you automate): use limit entry at breakout close plus a small slippage buffer, immediate stop order, and OCO for TP and SL.

MJBFX VWAP WITH SIGNALSThe MJBFX VWAP Channel is a custom-built volume-weighted average price indicator designed around the MJBFX trading methodology.
This tool tracks multiple rolling VWAPs anchored to a user-defined timeframe (default: 1H), then calculates percentile levels (Max, Upper, Median, Lower, Min) to create a dynamic channel. These levels act as key support and resistance zones that adapt to market conditions.
🔶 Features:
Adjustable anchor period and VWAP count (up to 500 VWAPs)
Percentile-based VWAP levels (Max, Upper, Median, Lower, Min)
Customisable colours, widths, and line styles
Optional gradient channel fills
Anchor period highlights for session awareness
MJBFX Branded Signals:
🟠 Buy – Triggered when price crosses above the lower VWAP (MJBFX Orange)
⚪ Sell – Triggered when price crosses below the upper VWAP (MJBFX Grey)
Built-in alert conditions for automated trade notifications
🔶 How to Use:
The VWAP channel provides a dynamic structure for intraday trading.
Buy opportunities often occur when price sweeps below the lower band and reclaims it.
Sell opportunities often occur when price sweeps above the upper band and rejects.
Use in confluence with market structure, session timing, and your trading plan (e.g., MJB-FX Asian Sweep strategy).

MVSF 6.0[ELPANO]The "MVSF 6.0 " indicator, which stands for Multi-Variable Strategy Framework, overlays on price charts to aid in trading decisions. It combines various moving averages and volume data to generate buy and sell signals based on predefined conditions.
Key features of the indicator include:
Moving Averages: It uses three exponential moving averages (EMAs) with lengths of 200, 100, and 50, and two simple moving averages (SMAs) with lengths of 14 and 9. These averages are combined into a single average line to detect trends.
Volume Analysis: The volume is assessed over a specified period (default is 2 bars) to determine its trend relative to its average, influencing the color and interpretation of signals.
Price Source and VWAP: Users can select the price (close, low, or high) used for calculations. The volume-weighted average price (VWAP) serves as a potential benchmark or condition in signal generation.
Signal Generation: Buy and sell signals are based on the relationship of the price to the average line and VWAP, the direction of the last candle, and the trend direction of the average line. These signals are visually represented on the chart.
Customization: Traders can toggle the visibility of signals, entry points, the average line, and even use these elements as conditions for filtering signals.
This script is designed to be flexible, allowing traders to modify settings according to their strategy needs. The description and implementation aim to provide clarity on how each component works together to assist in trading decisions, adhering to best practices for creating and publishing trading scripts.
*************************************
Der Indikator "MVSF 6.0 ", der für Multi-Variable Strategy Framework steht, wird über Preisdiagramme gelegt, um bei Handelsentscheidungen zu helfen. Er kombiniert verschiedene gleitende Durchschnitte und Volumendaten, um Kauf- und Verkaufssignale basierend auf vordefinierten Bedingungen zu generieren.
Wesentliche Merkmale des Indikators umfassen:
Gleitende Durchschnitte: Es werden drei exponentielle gleitende Durchschnitte (EMAs) mit Längen von 200, 100 und 50 sowie zwei einfache gleitende Durchschnitte (SMAs) mit Längen von 14 und 9 verwendet. Diese Durchschnitte werden zu einer einzelnen Durchschnittslinie kombiniert, um Trends zu erkennen.
Volumenanalyse: Das Volumen wird über einen festgelegten Zeitraum (standardmäßig 2 Balken) bewertet, um seinen Trend im Vergleich zum Durchschnitt zu bestimmen, was die Farbe und Interpretation der Signale beeinflusst.
Preisquelle und VWAP: Benutzer können den für Berechnungen verwendeten Preis (Schluss-, Tief- oder Hochkurs) auswählen. Der volumengewichtete Durchschnittspreis (VWAP) dient als mögliche Benchmark oder Bedingung bei der Generierung von Signalen.
Signalgenerierung: Kauf- und Verkaufssignale basieren auf dem Verhältnis des Preises zur Durchschnittslinie und zum VWAP, der Richtung der letzten Kerze und der Trendrichtung der Durchschnittslinie. Diese Signale werden visuell auf dem Diagramm dargestellt.
Anpassung: Händler können die Sichtbarkeit von Signalen, Einstiegspunkten, der Durchschnittslinie und sogar deren Verwendung als Bedingungen für die Filterung von Signalen ein- und ausschalten.
Dieses Skript ist so konzipiert, dass es flexibel ist und Händlern erlaubt, die Einstellungen gemäß ihren Strategiebedürfnissen zu modifizieren. Die Beschreibung und Implementierung zielen darauf ab, Klarheit darüber zu schaffen, wie jede Komponente zusammenarbeitet, um bei Handelsentscheidungen zu helfen, und halten sich an die besten Praktiken für die Erstellung und Veröffentlichung von Handelsskripten.

Stock trending strategy This is a long only strategy designed maily for stock markets and futures. In general it works best with 1h, however it can be optimized with other timeframes as well.
Components:
VWAP
MACD histogram
EMA 9
Rules for entry
Long :
For VWAP: close is above the vwap daily
EMA: close is above the moving average
MACD histogram is above 0
Short:
For VWAP: close is belowthe vwap daily
EMA: close is below the moving average
MACD histogram is below 0
Rules for exit
This strategy does not have any risk management inside. Instead it exits whenver it receives an opposite signal form the original one used for entry.
If you have any questions let me know !

cd_VW_Cx IMPROVED - Quant VWAP System: Regime, Magnets & Z-ScoQuant VWAP System: Regime, Magnets & Z-Score Matrix
This indicator is a comprehensive Quantitative Trading System designed to move beyond simple support and resistance. Instead of static lines, it uses Statistical Probability (Z-Score) and Standard Deviation to define the current market regime, identify institutional value zones, and project high-probability liquidity targets.
It is engineered for Day Traders and Scalpers (Crypto & Futures) who need to know if the market is Trending, Ranging, or preparing for a Breakout.
1. The "Regime" System (Standard Deviation Bands)
The core engine anchors a VWAP (Volume Weighted Average Price) to your chosen timeframe (Daily, Weekly, or Monthly) and projects volatility bands based on market variance.
The Trend Zone (Inner Band / 1.0 SD): This is the "Fair Value" zone. In a healthy trend, price will pull back into this zone and hold. A hold here signals a high-probability continuation (Trend Following).
The Reversion Zone (Outer Band / 2.0 SD): This represents a statistical extreme. Price rarely sustains movement beyond 2 Standard Deviations without a reversion. A touch of this band signals "Overbought" or "Oversold" conditions.
2. Liquidity Magnets (Virgin VWAPs)
The script automatically tracks "Unvisited VWAPs" from previous sessions. These are price levels where significant volume occurred but have not yet been re-tested.
The Logic: Algorithms often target these "open loops." The script visualizes them as Blue Dashed Lines with price tags.
Smart Scaling (Anti-Scrunch): Includes a custom "Ghost Engine" that automatically hides or "ghosts" magnets that are too far away. This prevents your chart from being squashed (scrunched) on lower timeframes, keeping your candles perfectly readable while still tracking targets in the background.
3. The Quant Matrix (Dashboard)
A real-time Heads-Up Display (HUD) that interprets the data for you:
Regime: Detects Volatility Squeezes. If the bands compress, it signals "⚠ SQUEEZE", warning you to stop mean-reversion trading and prepare for an explosive breakout.
Bias: Color-coded Trend Direction (Bullish/Bearish) based on VWAP slope.
Signal: actionable text prompts such as "BUY DIP" (Trend Following), "FADE EXT" (Mean Reversion), or "PREP BREAK" (Squeeze).
4. Visual Intelligence
Bold Day Separators: Clear, vertical dotted dividers with Date Stamps to instantly separate trading sessions.
Dynamic Labels: Floating labels on the right axis identify exactly which deviation level is which, preventing chart confusion.
How to Use
Strategy A: The Trend Pullback (continuation)
Check Matrix: Ensure Bias is BULLISH (Green).
Wait: Allow price to pull back into the Inner Band (Dark Green Zone).
Trigger: If price holds the Center VWAP or the -1.0 SD line, enter Long.
Target: The next Liquidity Magnet above or the +2.0 SD band.
Strategy B: The Reversion Fade (Counter-Trend)
Check Matrix: Ensure price is labeled "EXTREME" or Signal says "FADE EXT".
Trigger: Price touches or pierces the Outer Band (2.0 SD).
Action: Enter counter-trend (Short) with a target back to the Center VWAP (Mean Reversion).
Strategy C: The Magnet Target
Identify a "MAGNET" line (Blue Dashed) near current price.
These act as high-probability Take Profit levels. Price will often rush to these levels to "close the loop" before reversing.
Settings
Anchor: Daily (default), Weekly, or Monthly.
Magnet Focus Range: Adjusts how aggressively the script hides distant magnets to fix chart scaling (Default: 2%).
Visuals: Fully customizable colors, label sizes, and dashboard position.

Smoothed SuperTrend with VWAP Confirmation [CHE] Smoothed SuperTrend with Automated Optimization and VWAP Confirmation
Overview
The "Smoothed SuperTrend with VWAP Confirmation" is an advanced technical analysis indicator designed for precise trend identification and trading signal generation. This script integrates a smoothed version of the popular SuperTrend indicator with an additional layer of confirmation using the Volume-Weighted Average Price (VWAP). The combination of these two elements offers traders a powerful tool for identifying optimal entry and exit points in the market.
Key Features
1. Smoothed SuperTrend
- Super Smoother Algorithm: The SuperTrend in this script is not just a regular one; it is enhanced by the Super Smoother filter, which reduces market noise and provides more reliable trend signals.
- Customizable Parameters: Traders can adjust three different sets of SuperTrend parameters (factor and ATR length), allowing them to tailor the indicator to their specific trading strategies.
- Automatic Optimization: The script automatically evaluates the performance of each SuperTrend parameter set and selects the one with the best cumulative performance. This selection process can be set to pick either the best or the worst performing parameter set, depending on the trader's preference.
2. VWAP Confirmation
- Precise Trend Confirmation: Once the best-performing SuperTrend is identified, the script further refines the signals by using VWAP as a confirmation tool. VWAP is a highly respected indicator in the trading community, often used to assess the true average price of an asset.
- Long and Short Signal Generation: The script generates Long and Short signals only when the price action is confirmed by both the SuperTrend and VWAP. For a Long signal, the price must be above the VWAP, and for a Short signal, it must be below the VWAP. This dual confirmation ensures higher accuracy and reduces the likelihood of false signals.
3. Visual and Informative Labels
- Signal Labels: Upon confirmation of a trend reversal by both the SuperTrend and VWAP, the script plots clear labels on the chart, indicating confirmed Long or Short signals. These labels are customizable in terms of color, text, and size, ensuring they fit seamlessly into any chart setup.
- Best Parameters Display: At the close of the most recent bar, the script displays a label that provides detailed information about the best-performing SuperTrend parameters and their cumulative performance. This feature keeps traders informed about which settings are currently most effective.
Input Customization Options
1. Super Smoother Length
- Traders can define the length of the Super Smoother filter, which is used to smooth both price data and ATR (Average True Range) values. This input allows traders to control the sensitivity of the indicator, with shorter lengths providing faster responses and longer lengths offering smoother trends.
2. SuperTrend Parameters
- Factor: For each of the three SuperTrends, traders can set a unique factor that determines the distance of the SuperTrend bands from the average price. A higher factor results in wider bands and fewer signals, while a lower factor results in narrower bands and more signals.
- ATR Length: Traders can also specify the length of the ATR used in each SuperTrend calculation. A longer ATR period captures broader market volatility, while a shorter period focuses on more immediate price movements.
3. Label Settings
- Label Colors: The script allows full customization of label colors for Long and Short signals, ensuring that they match the trader’s chart aesthetics.
- Label Text Colors and Sizes: Traders can adjust the text color and size of the labels for Long, Short, and information labels, allowing them to prioritize visibility and readability on their charts.
4. Performance Selection Mode
- Best or Worst Performer: This input allows traders to select whether the script should optimize for the best or worst performing SuperTrend parameter set. This flexibility is useful in different market conditions, where a trader might want to analyze either the strongest trend or focus on a contrarian strategy.
5. VWAP Calculation
- The script automatically recalculates the VWAP based on trend changes, ensuring that the confirmation signals are as accurate and relevant as possible to the current market context.
Important Note
This script is designed to provide more accurate trend signals and confirmations, but like all technical indicators, it should not be used in isolation. It is recommended to use this tool as part of a broader trading strategy, including proper risk management and consideration of fundamental market conditions.
Conclusion
The "Smoothed SuperTrend with VWAP Confirmation" script is an innovative trading tool that combines the strengths of the SuperTrend and VWAP indicators. By integrating smoothing techniques and automatic parameter optimization, this indicator provides traders with more accurate and reliable trend signals. The added confirmation by VWAP further enhances the precision of the entry and exit points, making it an excellent choice for traders looking to improve their technical analysis and trading outcomes. This tool is especially valuable for those who prefer customizable inputs and a systematic approach to trading, ensuring that the indicator adapts to various market conditions and individual trading styles.
Best regards
Chervolino

Daily maximum price range for Credit SpreadsVolatility & Momentum for Credit Spreads
It is a specialized mean-reversion tool designed primarily for options traders focusing on Credit Spreads (specifically 0DTE on SPX) and intraday reversals. By combining Volume Weighted Average Price (VWAP) with VIX-adjusted volatility bands, this indicator identifies statistical extremes where price is likely to revert.
Unlike standard Bollinger Bands or Keltner Channels, TITAN adapts its width based on real-time implied volatility (VIX), ensuring that your "overextended" zones are accurate whether the market is calm or chaotic.
🎯 Core Concept
The indicator relies on the principle that price moves within a definable "Daily Range" relative to the VWAP. When price pushes to the outer limits of this range while simultaneously hitting RSI extremes; it signals a high-probability reversal setup ideal for selling premium.
🛠 How It Works
The engine is built on three pillars:
Volatility-Adaptive Bands: The bands are calculated using a 14-day Average Daily Range (ADR), which is then dynamically scaled by the current VIX relative to a baseline. If VIX spikes, the bands widen instantly to keep you safe from premature entries.
Momentum Triggers: Signals are generated only when the RSI (14) hits extreme Overbought (>70) or Oversold (<30) levels.
"Golden Hour" Filtering: To avoid market open noise or late-day chop, the indicator includes a customizable time filter (Default: 10:15 – 11:30 AM EST). Signals outside this window are suppressed to enforce trading discipline.
🚀 Key Features
Visual Strategy Simulation: The indicator now includes a built-in "Strike Simulator." Upon the first valid signal of the session, it automatically plots a horizontal "Strike Line" at the Outer Band ± a user-defined buffer (e.g., 10 points). This helps you visualize your theoretical strike price for the rest of the day.
Bull & Bear Zones: Color-coded fills (Green for Bullish Buy Zones, Red for Bearish Sell Zones) make it easy to see market context at a glance.
Live Dashboard: A Heads-Up Display (HUD) in the bottom right shows real-time RSI values, Golden Hour status, and current signal state.
Unified Alert System: A single master alert condition triggers if price hits an RSI extreme OR touches a volatility band during your active trading window.
📉 How to Trade It (Example Strategy)
Wait for the Window: Ensure the "Golden Hour" on the dashboard reads ACTIVE (Default 10:15 AM EST).
Identify the Zone: Short Setup (Call Credit Spread): Price pushes into the Red Zone (Outer High). Long Setup (Put Credit Spread): Price pushes into the Green Zone (Outer Low).
Confirm the Signal: Look for the Diamond Icon. This confirms RSI has hit the extreme threshold.
Check the "Strike Line": Use the simulated horizontal line to identify where your short strike would be (Outer Band + Buffer) to verify it is at a safe distance from current price.
⚙️ Settings
ADR Length: Lookback period for daily range calculation (Default: 10).
Baseline VIX:* The standard VIX level used for normalization (Default: 15.0).
Inner/Outer Multipliers: Controls the width of the bands.
Golden Hour: The specific time window for valid signals.
Strike Buffer: Points added to the outer band to simulate your option strike price.
⚠️ Disclaimer
This tool is for informational purposes only. Trading options, especially 0DTE credit spreads, involves significant risk. Always backtest strategies and manage risk accordingly.

Volume Momentum Strategy [MA/VWAP Cross]Deconstructing the Volume Momentum Strategy: An Analysis of MA-VWAP Cross Mechanics
Introduction
The "Volume Momentum Strategy " is a technical trading algorithm programmed in Pine Script v6 for the TradingView platform. At its core, the strategy is a trend-following system that utilizes the interaction between a specific Moving Average (MA) and the Volume Weighted Average Price (VWAP) to generate trade signals. While the primary execution logic relies on price crossovers, the strategy incorporates a sophisticated secondary layer of analysis using the Commodity Channel Index (CCI) and Stochastic Oscillator. Uniquely, these secondary indicators are applied to volume data rather than price, serving as a gauge for market participation and momentum intensity.
The Core Engine: MA and VWAP Crossover
The primary engine driving the strategy's buy and sell decisions is the crossover relationship between a user-defined Moving Average and the VWAP.
1. The Anchor (VWAP): The strategy calculates the Volume Weighted Average Price based on the HLC3 (High, Low, Close divided by 3) source. VWAP serves as the dynamic benchmark for "fair value" throughout the trading session.
2. The Trigger (Moving Average): The script allows for flexibility in defining the "fast" line, offering options such as Simple (SMA), Exponential (EMA), or Hull Moving Averages.
3. The Signal:
o A Long (Buy) signal is generated when the chosen MA crosses over the VWAP. This suggests that short-term price momentum is exceeding the average volume-weighted price of the session, indicating bullish sentiment.
o A Short (Sell) signal is generated when the MA crosses under the VWAP, indicating bearish pressure where price is being pushed below the session's volume-weighted average.
The Role of CCI and Stochastic: Analyzing Volume Momentum
The prompt specifically inquires about how the CCI and Stochastic indicators fit into this process. In standard technical analysis, these oscillators are used to identify overbought or oversold price conditions. However, this strategy repurposes them to analyze Volume Momentum.
1. The Calculation
Instead of using close prices as the input source, the script passes volume data into both indicator functions:
• Volume CCI: Calculated as ta.cci(volume, cciLength). This measures the deviation of current volume from its statistical average.
• Volume Stochastic: Calculated as ta.stoch(volume, volume, volume, stochLength). This gauges the current volume relative to its recent range.
2. The "Volume Spike" Condition
The strategy combines these two indicators to define a specific market condition labeled isVolumeSpike. A volume spike is confirmed only when both conditions are met simultaneously:
• The Volume CCI must be greater than a defined threshold (default: 100).
• The Volume Stochastic must be greater than a defined threshold (default: 80).
3. Integration into the Process
It is critical to note how this script currently applies this "Volume Spike" logic:
• Visual Confirmation: In the current version of the code, the isVolumeSpike boolean is used strictly for visual feedback. When a spike is detected, the script paints the specific price bar yellow and plots a small triangle marker below the bar.
• Strategic Implication: While the code calculates these metrics, the variables long_condition and short_condition currently rely solely on the MA/VWAP crossover. The developer has left the volume logic as a visual overlay, noting in the comments that it serves as a "visual/alert" or a potential filter.
• Potential Alpha: Conceptually, this setup implies that a trader should look for the MA/VWAP crossover to occur coincidentally with—or shortly after—a "Volume Spike" (yellow bar). This would confirm that the price move is backed by significant institutional participation (volume) rather than just retail noise.
Risk Management and Time Constraints
The strategy wraps these technical signals in a robust risk management framework. It includes hard-coded time windows (start/stop trading times) and a "Close All" function to prevent holding positions overnight. Furthermore, it employs both percentage-based and dollar-based Stop Loss and Take Profit mechanisms, ensuring that every entry—whether generated by a high-momentum crossover or a standard trend move—has a predefined exit plan.
Conclusion
The "Volume Momentum Strategy" is a hybrid system. It executes trades based on the reliable trend signal of MA crossing VWAP but informs the trader with advanced volume analytics. By processing volume through the CCI and Stochastic calculations, it provides a "heads-up" display regarding the intensity of market participation, allowing the trader to distinguish between low-volume drifts and high-volume breakout moves.

Daily vs Monthly VWAP CrossoverDaily vs Monthly VWAP Crossover Strategy
Description:
Overview This indicator is a trend-following tool designed to identify significant shifts in market sentiment by comparing short-term institutional value against the longer-term trend. It utilizes Anchored VWAP (Volume Weighted Average Price) logic to track the average price paid by traders for the current Day versus the current Month.
How It Works Unlike standard Moving Averages which lag significantly, VWAP factors in volume, making it a preferred benchmark for institutional traders.
Daily VWAP (Fast Line): Anchors at the start of the current trading day. It represents the intraday equilibrium price.
Monthly VWAP (Slow Line): Anchors at the start of the current month. It represents the broader value consensus for the month.
The indicator calculates these values cumulatively on every tick/bar, regardless of the chart timeframe selected (e.g., 30m, 1h).
Trading Logic & Signals The strategy is based on the concept of value migration:
BUY Signal (Bullish Reversal): Triggers when the Daily VWAP crosses ABOVE the Monthly VWAP. This suggests that short-term buying pressure and volume are pushing the price higher than the monthly average cost basis, indicating a potential breakout or trend continuation.
SELL Signal (Bearish Reversal): Triggers when the Daily VWAP crosses BELOW the Monthly VWAP. This indicates that intraday weakness has dragged the price below the month's average value, signaling potential downside momentum.
Features
Visual Crossovers: Clearly marked "B" (Buy) and "S" (Sell) labels on the chart.
Trend Background: The background color changes subtly (Green/Red) to indicate the current dominance of the Daily vs. Monthly trend.
Alerts: Fully compatible with TradingView alerts for real-time notifications on crossovers.
Best Practices
Timeframe: Designed optimally for intraday charts such as 30-minute or 1-hour timeframes.
Confirmation: As with any VWAP strategy, this works best when combined with price action analysis (e.g., breakout of key resistance) rather than used blindly in choppy, sideways markets.
Ultimate Scalping Strategy v2Strategy Overview
This is a versatile scalping strategy designed primarily for low timeframes (like 1-min, 3-min, or 5-min charts). Its core logic is based on a classic EMA (Exponential Moving Average) crossover system, which is then filtered by the VWAP (Volume-Weighted Average Price) to confirm the trade's direction in alignment with the market's current intraday sentiment.
The strategy is highly customizable, allowing traders to add layers of confirmation, control trade direction, and manage exits with precision.
Core Strategy Logic
The strategy's entry signals are generated when two primary conditions are met simultaneously:
Momentum Shift (EMA Crossover): It looks for a crossover between a fast EMA (default length 9) and a slow EMA (default length 21).
Buy Signal: The fast EMA crosses above the slow EMA, indicating a potential shift to bullish momentum.
Sell Signal: The fast EMA crosses below the slow EMA, indicating a potential shift to bearish momentum.
Trend/Sentiment Filter (VWAP): The crossover signal is only considered valid if the price is on the "correct" side of the VWAP.
For a Buy Signal: The price must be trading above the VWAP. This confirms that, on average, buyers are in control for the day.
For a Sell Signal: The price must be trading below the VWAP. This confirms that sellers are generally in control.
Confirmation Filters (Optional)
To increase the reliability of the signals and reduce false entries, the strategy includes two optional confirmation filters:
Price Action Filter (Engulfing Candle): If enabled (Use Price Action), the entry signal is only valid if the crossover candle is also an "engulfing" candle.
A Bullish Engulfing candle is a large green candle that completely "engulfs" the body of the previous smaller red candle, signaling strong buying pressure.
A Bearish Engulfing candle is a large red candle that engulfs the previous smaller green candle, signaling strong selling pressure.
Volume Filter (Volume Spike): If enabled (Use Volume Confirmation), the entry signal must be accompanied by a surge in volume. This is confirmed if the volume of the entry candle is greater than its recent moving average (default 20 periods). This ensures the move has strong participation behind it.
Exit Strategy
A position can be closed in one of three ways, creating a comprehensive exit plan:
Stop Loss (SL): A fixed stop loss is set at a level determined by a multiple of the Average True Range (ATR). For example, a 1.5 multiplier places the stop 1.5 times the current ATR value away from the entry price. This makes the stop dynamic, adapting to market volatility.
Take Profit (TP): A fixed take profit is also set using an ATR multiplier. By setting the TP multiplier higher than the SL multiplier (e.g., 2.0 for TP vs. 1.5 for SL), the strategy aims for a positive risk-to-reward ratio on each trade.
Exit on Opposite Signal (Reversal): If enabled, an open position will be closed automatically if a valid entry signal in the opposite direction appears. For example, if you are in a long trade and a valid short signal occurs, the strategy will exit the long position immediately. This feature turns the strategy into more of a reversal system.
Key Features & Customization
Trade Direction Control: You can enable or disable long and short trades independently using the Allow Longs and Allow Shorts toggles. This is useful for trading in harmony with a higher-timeframe trend (e.g., only allowing longs in a bull market).
Visual Plots: The strategy plots the Fast EMA, Slow EMA, and VWAP on the chart for easy visualization of the setup. It also plots up/down arrows to mark where valid buy and sell signals occurred.
Dynamic SL/TP Line Plotting: A standout feature is that the strategy automatically draws the exact Stop Loss and Take Profit price lines on the chart for every active trade. These lines appear when a trade is entered and disappear as soon as it is closed, providing a clear visual of your risk and reward targets.
Alerts: The script includes built-in alertcondition calls. This allows you to create alerts in TradingView that can notify you on your phone or execute trades automatically via a webhook when a long or short signal is generated.

True Moving VWAPHaven't found any moving VWAPs that calculate correctly (were weighted by time rather than volume) - this is correctly weighted VWAP.

Microstructure Participation & Acceptance Indicator📊 Microstructure Participation & Acceptance Indicator
An advanced participation-based filter combining VWAP distance analysis, volume delta detection, and real-time acceptance/rejection state identification—designed for smaller timeframe trading.
📊 FEATURES
VWAP Distance Normalization
Context-aware fair value measurement:
Automatically resets based on selected anchor (Session/Week/Month)
ATR-normalized distance calculation for universal application
Identifies when price is extended or compressed relative to equilibrium
Configurable extreme distance threshold (default: 1.5 ATR)
Adjustable source input (default: HLC3)
Volume Delta Proxy
Bull vs Bear participation tracking:
Calculates volume imbalance between bullish and bearish candles
EMA smoothing for cleaner signal generation (default: 9 periods)
Delta ratio measurement to identify dominant side
Expansion/compression detection to gauge momentum commitment
Configurable expansion threshold (default: 1.3x)
Acceptance/Rejection State Machine
Real-time market regime identification with six distinct states:
🟢 Accepted Long
Price moving away from VWAP with expanding bullish delta
Distance from VWAP increasing
Volume confirming the move
Indicates real buying pressure—trade WITH the move
🟢 Accepted Short
Price moving away from VWAP with expanding bearish delta
Distance from VWAP increasing
Volume confirming the move
Indicates real selling pressure—trade WITH the move
🟠 Fade Long
Price extended beyond threshold (>1.5 ATR above VWAP)
Delta not supporting the extension
Volume participation absent or diminishing
Potential mean-reversion short setup
🟠 Fade Short
Price extended beyond threshold (>1.5 ATR below VWAP)
Delta not supporting the extension
Volume participation absent or diminishing
Potential mean-reversion long setup
⚪ Chop
Price compressed near VWAP
Bollinger Bands tight (width compressed)
Delta neutral—no clear commitment
NO TRADE ZONE—wait for expansion
⚪ Neutral
Transitional state between regimes
Momentum shifting but not yet confirmed
Monitor for next acceptance signal
Bollinger Bands
Standard volatility measurement with TradingView default styling:
Adjustable period length (default: 20)
Configurable standard deviation multiplier (default: 2.0)
Visual fill between bands for volatility context
Used internally for chop/compression detection
Live Dashboard
Real-time metrics display (top-right corner):
Current market state with color coding
VWAP distance in ATR units
Delta ratio (bull/bear volume balance)
Delta state (Expanding/Compressing)
High-contrast design for instant readability
🎯 HOW TO USE
For Trend Trading:
Accepted Long/Short backgrounds indicate confirmed participation—stay with the trend
Strong moves typically travel 1-1.5 ATR from VWAP with delta support
Use VWAP as dynamic support/resistance
Combine with momentum indicators (MACD, RSI) for confluence
Price above VWAP + Accepted Long state = bullish bias
Price below VWAP + Accepted Short state = bearish bias
For Mean Reversion:
Fade Long/Short states signal overextension without participation
Price beyond 1.5 ATR from VWAP with weak delta = potential reversal
Look for price return to VWAP when extended
Bollinger Band extremes + Fade state = high-probability mean reversion setup
VWAP acts as mean reversion anchor during range-bound sessions
For Risk Management:
Chop state = avoid new entries
Bollinger Band compression + Chop = pre-expansion zone (wait for breakout)
Delta compression after strong move = early exhaustion warning
State transitions (Accepted → Neutral → Fade) = tighten stops
Signal Confirmation:
Strongest setups occur when multiple factors align:
BB breakout + Accepted state + price above/below VWAP
Price rejection at BB bands + Fade state
VWAP support/resistance hold + state transition
Delta expansion + distance increasing + trend direction
⚙️ SETTINGS
All components are fully customizable through organized input groups:
VWAP Distance Group:
VWAP source (default: HLC3)
Anchor period (Session/Week/Month)
ATR length for normalization (default: 14)
Extreme distance threshold in ATR multiples (default: 1.5)
Volume Delta Group:
Delta EMA length (default: 9)
Delta expansion threshold (default: 1.3)
Acceptance Logic Group:
Acceptance lookback period (default: 5)
Chop threshold in VWAP/ATR units (default: 0.3)
Bollinger Bands Group:
BB length (default: 20)
Standard deviation multiplier (default: 2.0)
Display Group:
Toggle state backgrounds
Toggle state change labels
Toggle VWAP line
Toggle Bollinger Bands
💡 EDUCATIONAL VALUE
This indicator teaches important concepts:
How institutional money identifies fair value (VWAP)
The difference between price movement and market acceptance
Why volume participation matters more than price action alone
How to distinguish between noise and committed directional moves
The relationship between volatility compression and expansion cycles
Why distance from equilibrium predicts mean reversion probability
⚠️ IMPORTANT NOTES
This indicator is for educational and informational purposes only
This is a filter, not a standalone trading system
No indicator is perfect—always use proper risk management
Past performance does not guarantee future results
Combine with your own analysis and risk tolerance
Test thoroughly on historical data before live trading
This is not financial advice—use at your own risk
🔧 TECHNICAL DETAILS
Pine Script Version 6
Overlay indicator (displays on price chart)
All calculations use standard, well-documented formulas
No repainting—all signals are confirmed on bar close
Compatible with all timeframes and instruments
Optimized for smaller timeframes (1-5 minute charts)
Minimal computational overhead
📝 CHANGELOG
Version 1.0
Initial release
VWAP distance normalization with ATR scaling
Volume delta proxy system (bull/bear EMA)
6-state acceptance/rejection state machine
Bollinger Bands integration
Real-time dashboard with live metrics
State change labels and background coloring
Full customization options
Developed for traders who need objective participation filters to distinguish high-probability setups from low-quality noise—without cluttering their charts with multiple indicator panels.
