Dynamic Sigma VWAP and Volume Sigma LevelsEver Wondered How can you confidently Identify Reversals / and Trend Direction with Volume ?
So this Script will help you out with that!
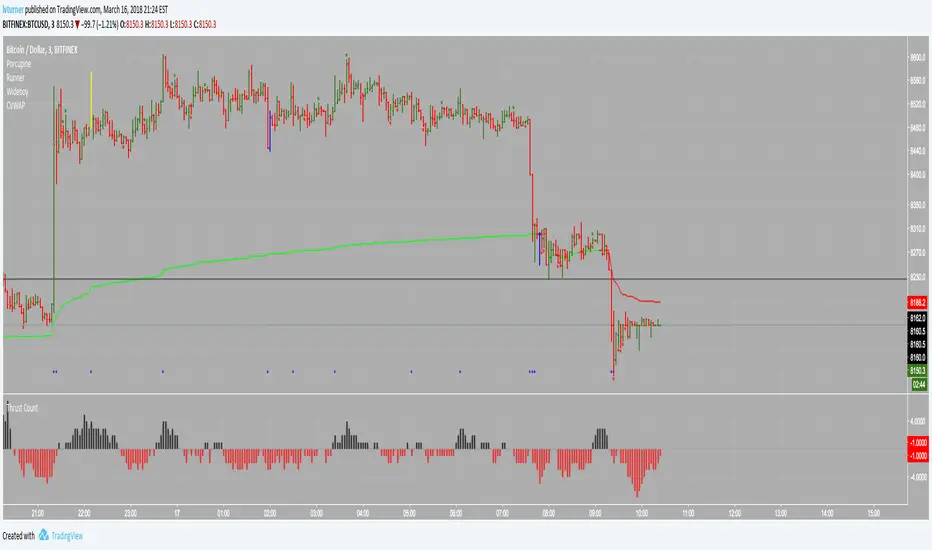
What I am talking About?
1. Volume Standard Deviations Spikes being Projected Over the Price
2. Dynamic VWAP being Calculated from the Points of extremities in Volume Action {estimated using Standard Deviation Sigma Level}
So,
This is how sigma levels of 1sigma, 2sigma and 3sigma will look over the volume
Whenever Volume Spikes through these Sigma Levels,
Price Projections are Formed by this Indicator, both on Current Timeframes and Higher Timeframes Prices
So,
This is what price projection of Volume Sigma Levels (1,2,3sigmas crosses) will look if projected on Same Timeframe period
And This is how they look on chart using Higher Timeframe Period, (Default Higher Time Frame is 60mins, You can tweak as per your convenience)
Once All the Sigmas are projected Over the Price,
Dynamic VWAP is calculated from the points where volume crosses current Time Frame 2sigma and 3sigma Levels
see,
This helps out in figuring a lot of things in the price volume action!
Play with it, and Enjoy!
Search in scripts for "vwap"

Long only strategy VWAP with BB and Golden Cross EMA50/200
This is strategy, mainly designed for stock markets
It makes uses of the EMA 50/ 200 ( Golden cross) and VWAP and Bollinger bands.
It only takes long positions. It can be adapted to all time frames, but preferably to be used with longer timeframes 1h +
The rules for entry are the next ones :
1. EMA50 > EMA 200
2. if current close > vwap session value
3. check if price dipped BB lower band for any of last 10 candles
EXIT RULE
1. price closes above BB upper
STOP LOSS EXIT
1. As configured --- default is set to 1%

Stock Market Strategy : VWAP, MACD, EMA, Breakout, BBHello there,
Today I bring you a stock market strategy, specialized in NASDAQ stocks.
Its a daytrading strategy, that can only do a max of 1 trade per day. In this case it only trades the first 2 opening hours of the market.
The rules are simple :
We follow the trend based on a big EMA, in this case 200, after that, we check for VWAP direction , then, we check histogram from MACD. This is the simple logic of the strategy.
Inside there is another strategy, that not just do the above, but also uses Bollinger bands, and checks for breakout of bottom or top line. Also it uses Average directional Index, for even a bigger criteria .
So for example a long condition it would be : candle is above the ema, and candle is above vwap, and histogram is positive, and candle break the top bb level and ADI < 40 -> long signal . The opposite works for short(ADI > 20).
In this case all this criterias are between the first 2 hours of market. So we enter between the first hour, and exit in the next hour. For this we need to use very short time frames.
Hope you enjoy it.
Let me know if you have any questions

[CP]VWAP + 9 Moving Averages + 3 Jurik MA9 Adjustable EMAs with offsets, with two of them having the option of adjustable 'bands' around them.
VWAP line along with an offset and adjustable 'band'.
Incredible 3 Jurik Moving Averages!
A single indicator giving you infinite options to play around with EMAs, VWAP and the amazing JMA.
Note: The bands look best in dark mode.

BNF VWAP & MAThe script picks up Bank nifty stocks with their current respective weights and plots a Volume Weighted Average Price ( VWAP ) line along with 2 EMAs of your choice and an alert when the EMAs cross over and also when price crosses VWAP .
You can customize the script for MA type and lengths and to remove alert. Basic utility of the script is to analyse volumes driving the Bank Nifty index.
Credits to @daytraderph and his script (Custom Volume ) who's code I used to build this script. Also thanks to my friend @Varun who helped me code it.

WOMBO COMBO: EMA & VWAP & MACD & BB & STCHello my fellow investors,
After hours of reading, backtesting, and YouTube video watching I discovered that EMA, VWAP, BB, MACD, and STC produce the most consistent results for investment planning. This strategy allows you to pick between the aforementioned indicators or layer them together.
It works on the pricipal of:
1) Always follow the market trend - buy/sell above/below 200EMA
2) Follow corporate investing trends - buy/sell above/below VWAP
3) Apply MACD check - buy--> MACD line above signal line and corssover below histogram \\ sell --> MACD line below signal line and crossover above histogram.
4) Check volitility with price against BB limits upper/Sell or lower/buy
5) When STC crosses about 10 buy and when it drops below 90 sell
6) Exit position when stop loss is triggered or profit target is hit. BB also provides a parameter to exit positions.
This code is the product of many hours of hard work on the part of the greater tradingview community. The credit goes to everyone in the community who has put code out there for the greater good.

Hikkake PatternLifted description from web:
Hikkake means to trap, trick, or ensnare. Primarily, this price pattern seeks to identify inside bar breakouts and profit from their failures.
An inside bar is a price bar that is entirely within the range of the preceding price bar. Inside bars are typical on price charts of most timeframes.
While you’ll often find inside bars in congested markets, they also offer a low-risk entry point for price action traders. The contracted range of an inside bar offers a natural tight stop-loss.
Hence, inside bar breakouts seem attractive. However, if you are patient and focus on identifying false breakouts, you might be able to find more reliable trading setups in the form of Hikkakes.
In a nutshell, the Hikkake pattern offers a systematic approach to trading false inside bar breakouts.
As a filter I incorporated VWAP into the code to only trigger Bullish / Bearish signals when price is Above/Below VWAP respectively. The ATR is used to create a Stop buffer (red cross) for the Entry signal ( green dot ). The R1 and R2 (orange squares) are two possible profit targets that are customizable to different Risk multiples based upon the difference between Entry and Stop.


BAT Multi Anchored VWAPMulti Anchored VWAP which includes:
BTC Key Pivots
SPX Key Pivots
Yearly Opens
5 Adjustable Dates
Works on all assets, unlike some VWAP calculations.

Colored Volume Weighted Average PriceSimple addition to the standard VWAP indicator.
If price is above VWAP the plot is colored green. If below plot is colored red.
Colors are configurable.
You can also choose the source for price (i.e. open/low/high etc)
Adaptive Pullbacks ML v2.5Adaptive Pullbacks ML - Context-Aware Trend Trading
Overview
Adaptive Pullbacks ML is a sophisticated trend-following tool that solves the biggest problem in pullback trading: "Is this a dip to buy, or the start of a reversal?"
Unlike standard indicators that use fixed percentages or static moving averages, this script uses a 5-Dimensional k-Nearest Neighbors (k-NN) machine learning engine to learn the specific characteristics of successful pullbacks for the asset you are trading.
The 5-Dimensional ML Engine
The market is dynamic. A pullback depth that works in a low-volatility lunch session might fail during a high-volatility news event. This indicator tracks 5 key dimensions for every pullback:
Depth (ATR Normalized): How deep is the pullback relative to volatility?
Trend Slope: Is the trend steep (parabolic) or flat (grinding)?
ADX: How strong is the directional energy?
VWAP Distance: Is price extended or close to value?
Time of Day: Is this a morning drive or an afternoon fade?
When a new pullback occurs, the k-NN engine finds the 5 most similar historical events across these dimensions and predicts the probability of success.
Core Features
1. Fractal Normalization
The indicator speaks the language of ATR (Average True Range). It doesn't care if you trade the 15-second chart or the Daily chart. A "1.5 ATR Pullback" is a statistically comparable event across all timeframes, allowing for robust, scale-invariant analysis.
2. HTF Stats Bridge (Higher Timeframe Data)
You can trade on lower timeframes (e.g., 1-minute) while using statistics derived from higher timeframes (e.g., 15-minute). This ensures your signals are based on significant market structure, not microstructure noise.
3. Smart Zones
The indicator plots dynamic "Value Zones" based on learning:
Cyan Zone (Avg Depth): The "Sweet Spot". High probability bounce area.
Yellow Zone (Sigma): The "Extension". Price is stretching elastic limits.
Red Zone (Deep): The "Danger/Opportunity". Statistical anomaly.
4. PQS & k-NN Filters
Two layers of filtering protect your capital:
PQS (Probability Qualification Score): Based on raw win-rate of the zone.
k-NN Probability: Based on similarity to past winners.
Settings Guide
Stats Timeframe: The timeframe to learn from (Leave empty for Chart).
Trend/Trigger Settings: Define what constitutes a trend for your strategy.
k-Neighbors: Number of historical twins to compare (Default: 5).
Min PQS / k-NN: Thresholds for filtering weak signals.
Disclaimer: This tool is for educational purposes. Past performance of the k-NN engine does not guarantee future results.


KCP TEMA 20 & VWAP Trend [Dr.K.C.Prakash]This indicator plots TEMA 20 High and Low lines to show fast-reacting dynamic support and resistance, with VWAP displayed as an intraday reference. It helps identify short-term trend direction and price strength relative to volume-weighted levels.

KCP TEMA 50 & VWAP Trend [Dr.K.C.Prakash]This indicator displays TEMA 50 High and Low lines to capture fast-reacting dynamic support and resistance, along with VWAP as an intraday reference. It helps identify short-term trend direction and price positioning relative to volume-weighted market value.

Clean EMA VWAP Trend Pullback - SrPyeA clean, confirmation-based trend pullback indicator using EMA and VWAP alignment.
Designed to reduce noise and highlight high-probability continuation setups.
Best used on 1–2 minute charts during high-liquidity sessions.
This indicator is designed as a confirmation tool, not a standalone trading system.
Good For NY Session 9:30am - 11:00am - After Lunch 1:00pm- 3:00pm
OR Optional Alerts
- Sr.Pye

ICT Killzones & Pivots [TFO] + VWAP (NY Anchor)Made this for me, Enjoy it if it works for you ICT killzones + Vwap entry model from new york open with alerts

RTH VWAP (9:30 Anchor) with Custom BandsPlots a VWAP anchored to the 9:30 AM New York open, resetting each Regular Trading Hours session.
Includes up to three customizable standard-deviation bands with user-defined multipliers, colors, and line styles (solid, dashed, dotted).
Designed for US equities and index futures, providing a clear intraday mean price and overextension levels during RTH.

Desk Alerts: AMD / PLTR / NVDA (VWAP + EMA + Volume)Desk Alerts: AMD / PLTR / NVDA (VWAP + EMA + Volume)

Desk Alerts: AMD / PLTR / NVDA (VWAP + EMA + Volume)Desk Alerts: AMD / PLTR / NVDA (VWAP + EMA + Volume)

Breakout Alert Pro + VWAPAdvanced breakout/breakdown indicator featuring multi-pattern detection, quality tier scoring (S/A/B/C), strength analysis (0-10), VWAP integration, multi-timeframe filters, and adaptive R-based take-profit/stop-loss framework. Includes comprehensive dashboard with real-time metrics and market regime detection.

Breakout Alert Pro + VWAPAdvanced breakout/breakdown indicator featuring multi-pattern detection, quality tier scoring (S/A/B/C), strength analysis (0-10), VWAP integration, multi-timeframe filters, and adaptive R-based take-profit/stop-loss framework. Includes comprehensive dashboard with real-time metrics and market regime detection.

Weekly Debit Spread VWAP + Prior Day + Dual ConfirmOpen Debit Spreads using previous day and current vwap

Smart Money Signals - Minimal v5 (No VWAP, Manual CMF) - RajeevSmart Money Signals - Minimal v5 (No VWAP, Manual CMF) - Rajeev
