Auto AVWAP (Anchored-VWAP) with Breakout ScreenerAuto AVWAP (Anchored-VWAP) with Breakout Screener. fINAL VERSION
Search in scripts for "vwap"

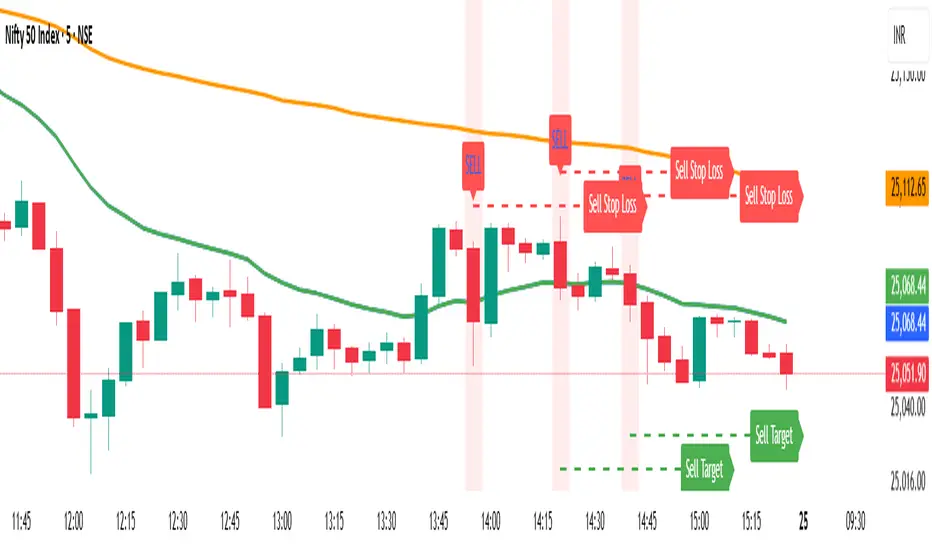
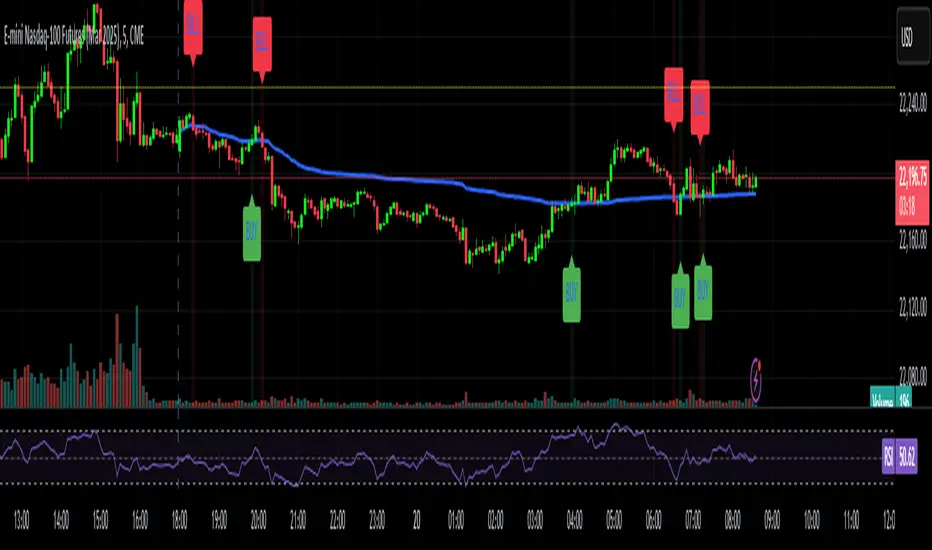
EMA 20 and Anchored VWAP with Typical PriceIntraday scalping using EMA 20 and VWAP along with targets and Stoploss
Out of the Noise Intraday Strategy with VWAP [YuL]This is my (naive) implementation of "Beat the Market An Effective Intraday Momentum Strategy for S&P500 ETF (SPY)" paper by Carlo Zarattini, Andrew Aziz, Andrea Barbon, so the credit goes to them.
It is supposed to run on SPY on 30-minute timeframe, there may be issues on other timeframes.
I've used settings that were used by the authors in the original paper to keep it close to the publication, but I understand that they are very aggressive and probably shouldn't be used like that.
Results are good, but not as good as they are stated in the paper (unsurprisingly?): returns are smaller and Sharpe is very low (which is actually weird given the returns and drawdown ratio), there are also margin calls if you enable margin check (and you should).
I have my own ideas of improvements which I will probably implement separately to keep this clean.

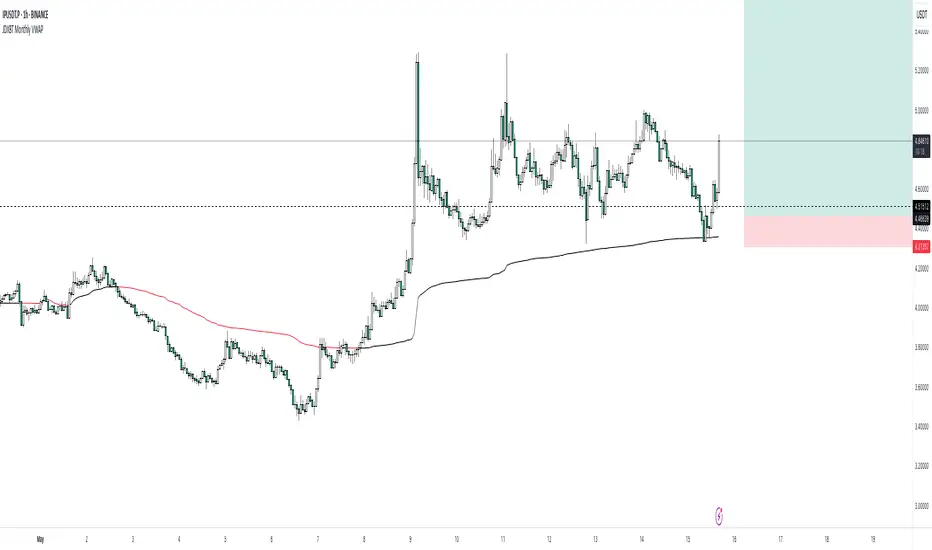
JDXBT Monthly VWAPIt calculates the average price for each month, weighted by trading volume, and automatically resets the calculation at the start of each new month. The VWAP line changes colour based on direction: black if rising, fuchsia if falling — helping traders quickly identify monthly price trends with volume context. It’s a useful tool for spotting key levels and momentum shifts on a monthly basis.
Moving Volume-Weighted Avg Price, % Channel, BBsThis script includes:
- Moving Volume-Weighted Average Price line.
- User-defined % band above and below, very useful for "breakout" signals, and mentally adjusting to the magnitude of price swings when viewing an automatic scale on the price axis.
- Volume-Weighted Bollinger Bands, which are more sensitive to volume.
More detail:
- This is like TV's basic VWAP in concept, except the major flaw in that is that it has reset periods that you can't override, and the volume is cumulative until the next hard reset. The 'reset' is OK for securities trading, that resets every day anyway. But not for crypto - and not if/when securities trading goes 24/7. Also, the denominator accumulating over the entire period is also *not* OK, because then what is shown means something different as the day progresses - which kind of makes it useless. In other words, it starts out very sensitive to volume, and gets progressively more numb to it as they day progresses, and starts flattening out.
- This fixes both problems, by using a user-definable moving window for the average. Essentially combining SMA with volume-weighting.
- You may also find an invaluable trading aid, in the % bands above and below.
- What can optionally be shown is standard deviation bands, aka Bollinger bands. The advantage over regular BB is that it's volume-weighted. Since it is already calculated on a moving average, the period for the standard deviation has been shortened by default, and the magnitude increased, to better approximate regular Bollinger Bands - but it's still more responsive to volume.

Stochastic and RSI2 entriesStochastic and RSI2 entries, v1.0
This indicator combines Stochastic and RSI to facilitate "RSI2" entry signals. Buy signals will be shown at the bottom.
The default configuration uses non-standard settings for the underlying indicators to tailor it for this type of entry strategy.
This is an entry strategy that tries to find entries close to "the dip".
A combination of Stochastic crossovers, VWAP, daily SMA50 and daily SMA200 are used to verify buy signals.
This indicator is written for bullish signals and aims to find the start of short trends or cheap entries for longer positions.
Like with any strategy, some signals will be false, and the user is advised to do some own research before using the buy signals for actual entries.
Happy trading!

Anchored VWAP with Buy/Sell SignalsAnchored VWAP Calculation:
The script calculates the AVWAP starting from a user-defined anchor point (anchor_date).
The AVWAP is calculated using the formula:
AVWAP
=
∑
(
Volume
×
Average Price
)
∑
Volume
AVWAP=
∑Volume
∑(Volume×Average Price)
where the average price is
(
h
i
g
h
+
l
o
w
+
c
l
o
s
e
)
/
3
(high+low+close)/3.
Buy Signal:
A buy signal is generated when the price closes above the AVWAP (ta.crossover(close, avwap)).
Sell Signal:
A sell signal is generated when the price closes below the AVWAP (ta.crossunder(close, avwap)).
Plotting:
The AVWAP is plotted on the chart.
Buy and sell signals are displayed as labels on the chart.
Background Highlighting:
The background is highlighted in green for buy signals and red for sell signals (optional).
Trading TimesThis script is based on the 9 and 20 EMA Strategy and combines Fibonacci Levels for added confluence.
When the price retests after breaking the EMAs, we take the trade in the same direction. That is on breakup, we take a long and on a breakdown we take a short.
VWAP can be enabled from settings for more data. institutions use it to average out their trades for both buy and sell orders.

Moonhub IndexMoonhub Index combines several popular technical indicators to create an aggregated index that aims to give a clearer overall picture of the market. The index takes into account the current market condition (trending, ranging, or volatile) to adjust its calculations accordingly.
The indicators used in this composite index are:
Hull Moving Average (HMA)
Fisher Transform (FT)
Williams Alligator
Moving Average Convergence Divergence (MACD)
Average True Range (ATR)
On-Balance Volume (OBV)
Money Flow Index (MFI)
Accumulation/Distribution (AD)
Pivot Points
True Strength Index (TSI)
Volume-Weighted Average Price (VWAP)
The script calculates the values of each indicator and then normalizes and weighs them according to predefined weights. The composite index is formed by summing the weighted values of each indicator. The final Moon Index is plotted on the chart, along with several other related lines like the exponential moving averages (EMA) and simple moving averages (SMA) of the index.
This custom index can be used by traders to get a more comprehensive view of the market and make better-informed trading decisions based on the combined insights of multiple indicators.

ZenBot Signals - Trend StrengthI developed this indicator as a "regime detection" for my algo trading bot. It uses the ADX +/- values with a few twists.
- If ADX DI+ is over 30 and DI- is below 20 and falling (inverse for shorts)
- Price action rising/falling thru various VWAP standard deviations indicates a strong trend break
- Some other custom juju (open source so have fun).
I use this primarily to monitor the SPY index as a backdrop for my long and short trades. If the colored line below price bars is red or green, a strong trend is present and there is a decent trade environment.


Bollinger BandsThis is the combination of three indicators (BOLLINGE BAND+VWAP+EMA200)
CREATED BY ANKR SINGH

Ultimate IndicatorThis is a combination of all the price chart indicators I frequently switch between. It contains my day time highlighter (for day trading), multi-timeframe long-term trend indicator for current commodity in the bottom right, customizable trend EMA which also has multi-timeframe drawing capabilities, VWAP, customizable indicators with separate settings from the trend indicator including: EMA, HL2 over time, Donchian Channels, Keltner Channels, Bollinger Bands, and Super Trend. The settings for these are right below the trend settings and can have their length and multiplier adjusted. All of those also have multi-timeframe capabilities separate from the trend multi-time settings.
The Day Trade Highlight option will draw faint yellow between 9:15-9:25, red between 9:25-9:45, yellow between 9:45-10:05. There will be one white background at 9:30am to show the opening of the market. while the market is open there will be a very faint blue background. For the end of the day there will be yellow between 15:45-15:50, red between 15:50-16:00, and yellow between 16:00-16:05. During the night hours, there is no coloring. The purpose of this highlight is to show the opening / closing times of the market and the hot times for large moves.
The indicators can also be colored in the following ways:
1. Simple = Makes all colors for the indicator Gray
2. Trend = Will use the Donchian Channels to get the short-trend direction and by default will color the short-term direction as Blue or Red. Unless using Super Trend, the Donchian Channel is used to find short-term trend direction.
3. Trend Adv = Will use the Donchian Channels to get the short-trend direction and by default will color the short-term direction as Blue or Red. Unless using Super Trend, the Donchian Channel is used to find short-term trend direction. If there is a short-term up-trend during a long-term down-trend, the Blue will become Navy. If short-term down-trend during long-term up-trend, the Red will be Brown.
4. Squeeze = Compares the Bollinger Bands width to the Keltner Channels width and will color based on relative squeeze of the market: Teal = no squeeze. Yellow = little squeeze. Red = decent squeeze. White = huge squeeze. if you do not understand this one, try drawing the Bollinger Bands while using the Squeeze color option and it should become more apparent how this works. I also recommend leaving the length and multiplier to the default 20 and 2 if using this setting and only changing the timeframe to get longer/shorter lengths as I've seen that changing the length or multiplier can more or less make it not work at all.
Along with the indicator settings are options to draw lines/labels/fills for the indicator. I enjoy having only fills for a cleaner look.
The Labels option will show Buy/Sell signals when the short-term trend flips to agree with the long-term trend.
The Trend Bars option will do the same as the Labels option but instead will color the bars white when a Buy/Sell option is given.
The Range Bars option shows will color a bar white when the Close of a candle is outside of a respective ranging indicator option (Bollinger or Keltner).
The Trend Bars will draw white candles no matter which indicator selection you make (even "Off"). However, Range Bars will only draw white when either Bollinger or Keltner are selected.
The Donchian Channels and Super Trend are trending indicators and should be used during trending markets. I like to use the MACD in conjunction with these indicators for possibly earlier entries.
The Bollinger Bands and Keltner Channel are ranging indicators and should be used during ranging markets. I like to use the RSI in conjunction with these indicators and will use 60/40 for overbought and oversold areas rather than 70/30. During a range, I wait for an overbought or oversold indication and will buy/sell when it crosses back into the middle area and close my position when it touches the opposite band.
I have a MACD/RSI combination indicator if you'd like that as well :D
As always, trade at your own risk. This is not some secret indicator that will 100% win. As always, the trades you see in the picture use a 1:1.5 or 1:2 risk to reward ratio, for today (August 8, 2022) it won 5/6 times with one trade still open at the end of the day. Manage your account correctly and you'll win in the long term. Hit me up with any questions or suggestions. Happy Trading!

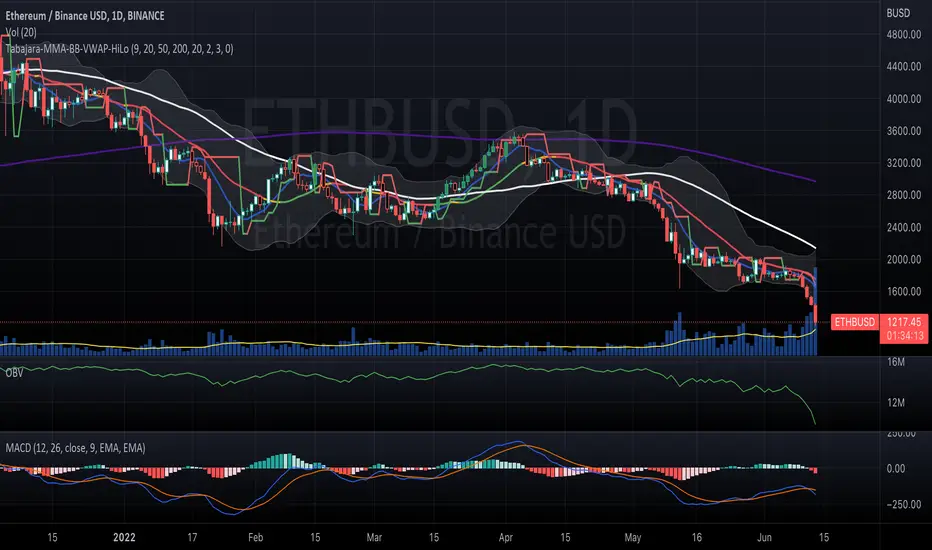
Tabajara + Multiple MA + Bollinger Bands + VWAP + HiLoSetup Tabajara
Based on several Tabajara setups published in TradingView, idealized by André Machado, aka "WallSt Ogro".
Bar colors follow trend and change based on the main direction.
Including indicators:
Simple Moving Averages and Exponential Averages
Bollinger Bands
VWAP
HiLo indicator
Rolling VWAP with Standard DeviationsAdding standard deviation bands to TradingView's Rolling VWAP tool

Rolling VWAP with stdev█ OVERVIEW
Based on TradingView's Rolling VWAP (RVWAP) indicator, this indicator includes the option of plotting lines for the first and second standard deviations of the RVWAP, which some traders like to use for entry/exit decisions and support/resistance.
█ HOW TO USE
In the Style tab, use the checkboxes to enable or disable the plots. By default, the first standard deviation lines are enabled, but the second deviation lines are disabled.
█ THANKS
Thanks to TradingView for the original RVWAP code.

Moving Average Suite + VWAP + TICKThis indicator combines some of the commonly used moving averages, VWAP, and TICK sentiment, all of which are useful for all types of trading
By default, this indicator includes:
- 21/50/100/200 period smoothed simple moving average
- great for determining trends
- also act as support / resistance line for price
- 9 period exponential moving average
- fast trend / direction indicator
- Volume Weighted Average Price
- no explanation required
- $TICK sentiment as background fill
- overall market sentiment and direction
- +/- 500 levels are colored green/red and are usually indication of institutional order flow --> critical for trading indexes such as SPY or QQQ
- deep green/red background indicates +/-1000 on the $TICK, which are usually associated with overbought or oversold

Swing Dream - PAINT BARS | MA | EMA | DMA | VWAP | TABLE | ADR %- Swing Dream -
Script created for breakout-swing traders, in the style of QullaMaggie * , Dan Zanger, Oliver Kell, and Stockbee.
The following indicators are used by most successful breakout-swing traders such as mentioned above.
(As published) it contains:
Painted Bars, also known as inside/outside candles. Used for candle analysis and to determine breakout pivots & levels. For instance; use it in different timeframes and seek formations (ex, 3-1-2). For further inspiration, study Rob Smith's The Strat .
MA, Simple Moving Averages (Basic levels = 10,20,50,200). Use this indicator to define resistance/support areas as well as the overall long/swing-term trend. In breakout strategies such as EP, Flags, etc this can be used for trailing stops; an example, post-breakout, let the price ride the 20ma before exiting your position.
EMA, Exponential Moving Averages with periods inspired by Qullamaggie (10,20,65). Use this on shorter timeframes (ex, 1h) and for the same principles as MAs.
VWAP, Volume-Weighted Average Price. As for the previous, utilize this as a level indicator to find areas of resistance/support. Good for swing-trading as it implies whenever holders are profitable or not.
DMA, Displaced Moving Average (Horizontal). Personally, I use this a lot. Works very well for trailing stops (post breakout) and "bounce" areas. Choose your own offset and period.
ADR%, Average Daily Range Percentage. Displayed in the table and used to define a symbol's volatility. A very good tool for Qullamaggie-style trading. Personally, I try to find setups with over 6% ADR. Basic definition; low ADR% = Increased chance of a symbol to move slower and in smaller ranges. A higher value equals the opposite.
Table. A table with basic symbol-related information. Could save you plenty of time whenever you scan or search for new swing setups. Looking to add more features here.
Why should you use this script? Well, instead of having tens of different indicators, use this script and combine everything together with EP, Flag, or breakout principles. Suited for every plan, and more efficient in my opinion.
View settings to turn on/off different indicators.
* If you're looking for an introduction and further explanation of how Qullamaggie uses mentioned indicators, I could recommend checking out his website, stream, or participation in "Chat With Traders".
At last, I want to credit: @jkcqld @neolao @TheScrutiniser
This Script will get updated and improved.
// TechFille006

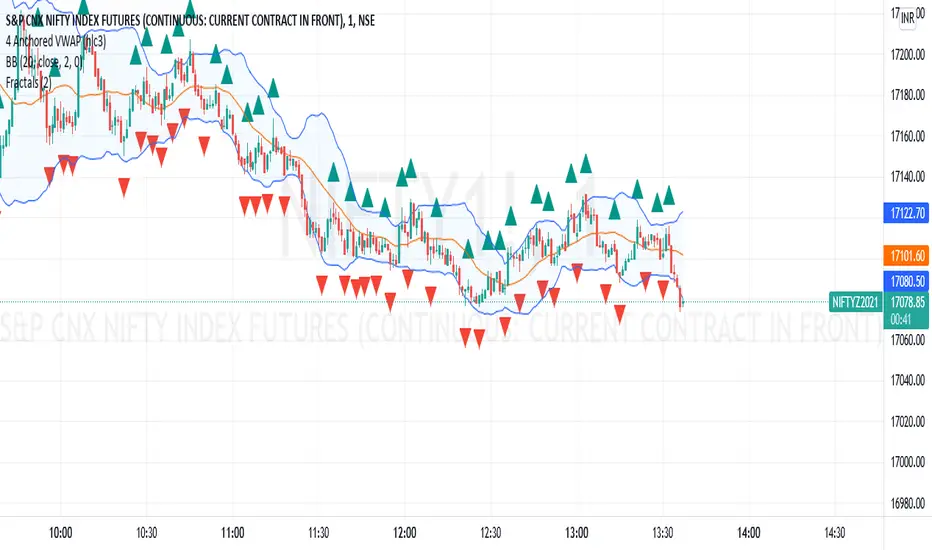
4 Anchored VWAP4 Anchored VWAP all together. This indicaor can be used as dynamic support and resistance.
Just apply and set dates
HYE Combo Market [Indicator] (Vwap Mean Reversion+Trend Hunter)Indicator version of the strategy:
* Alerts added.
TIPS AND WARNINGS
1-) The standard settings of this combo script is designed and tested with daily timeframe. For lower timeframes, you should change the indicator settings and find the best value for yourself.
2-) Only the mean vwap line is displayed on the graph. For a detailed view, you can delete the "//" marks from the plot codes in the script code.
3-) This is an indicator for educational and experimental purposes. It cannot be considered as investment advice. You should be careful and make your own risk assessment when opening real market trades using this indicator.

CCI & EMA strategy by TradeswithashishThis strategy is extremely useful for positional traders or traders using timeframe 15-minute of higher. It uses following combo of values:
VWAP, CCI, Volume and Moving average (simple and exponential)
Caution:
Avoid taking trade if candle size is greater than twice the average candle size. for that wait for the retracement to near trailing stoploss

MTF VWAPA simple wavetrend oscillator based off WaveTrend Oscillator by @LazyBear to visualise 4 different timeframe vwap under 1 chart.
Timeframe can be changed in indicator settings in minutes. Unnecessary waves can be removed by unchecking said TF wave in Style settings.
