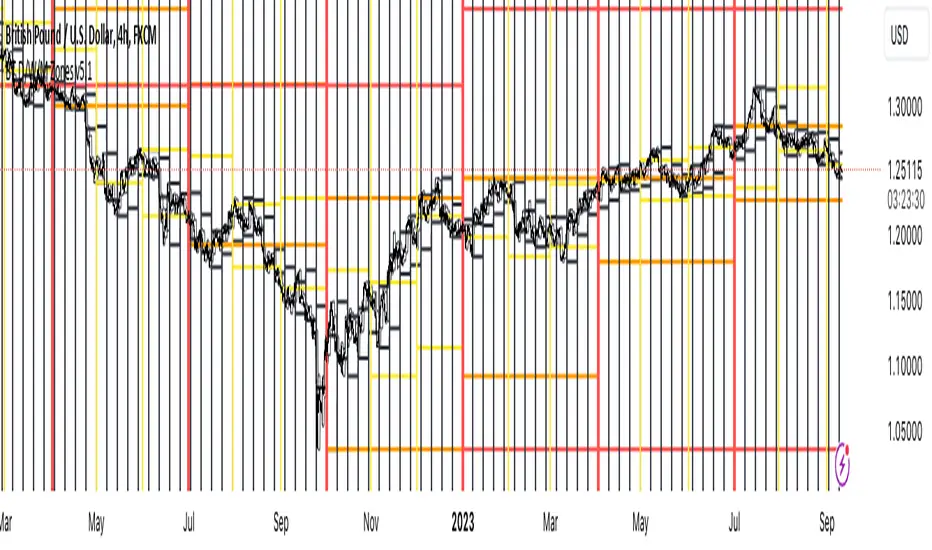
BT D/W/M SeparatorsThis will print vertical lines for Daily/Weekly/Monthly open and close times. Also highlighting the days of the week including weekends for the crypto lovers :-)
Search in scripts for "weekly"
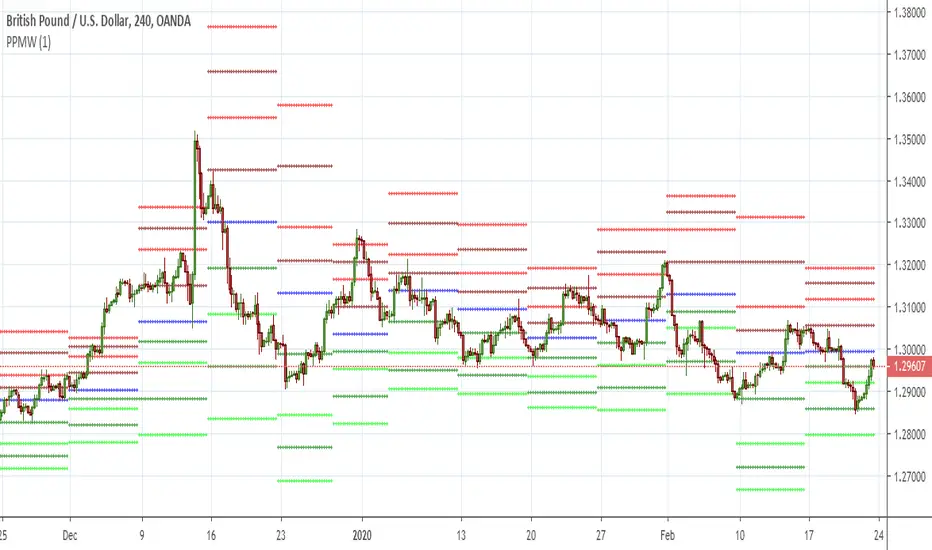
Monthly Weekly Daily Pivot Points StandardShow the monthly weekly and daily pivot points all at once , suitable for daytrading
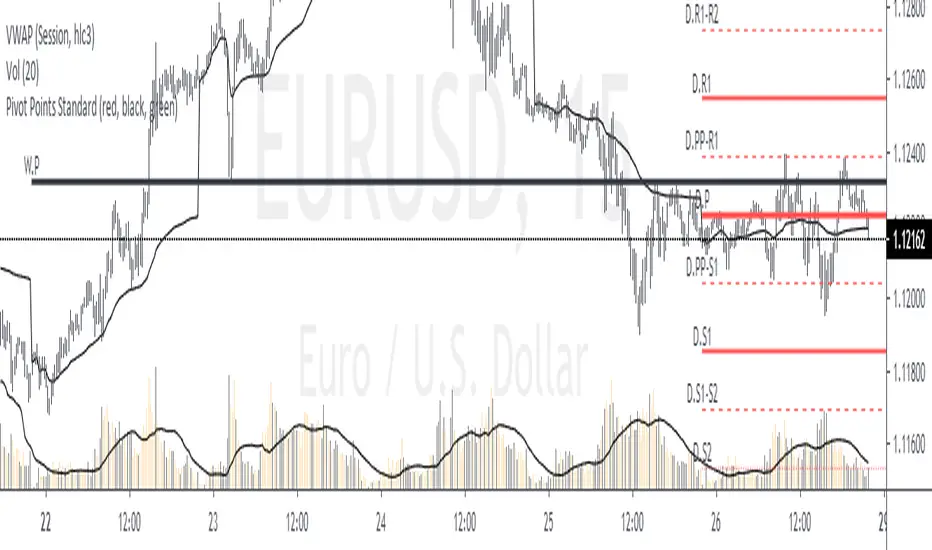
Pivot Points with Monthly and Weekly optionsA pivot point indicator that has possibility to see even the monthly or the weekly pivot points .
Pivot points are very powerful if used in correct way.
most of the time the price can be rejected from the pivot point or if the price break it it will be a nice entry if retest the pivot
R2/S2 are a very strong pivots to break but of course you need a certain distance between the pivot

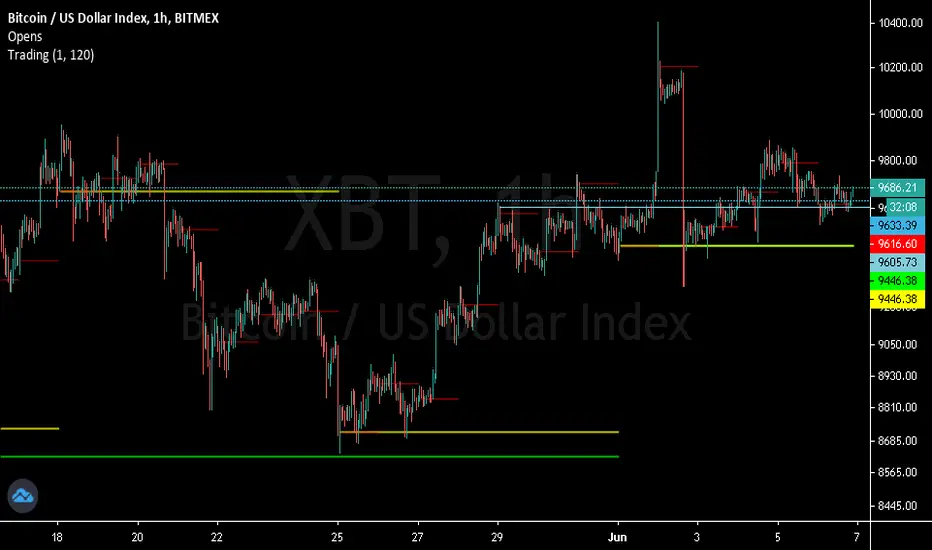
Trendanalysis with Monthly/Weekly/Daily Opens and TrendindicatorThis script is based on price action Trendanalysis.
It has 7 indicators.
Also Monthly/Weekly/Daily Opens for better visuals.
Daily, Weekly, Monthly PPplots the daily, weekly, and monthly pivot points. you can uncheck those that you do not want to use

MTF Ichimoku CloudIchimoku Cloud , Multiple Time Frames, based on the script : MTF Selection Framework functions (PineCoders)
Possible display:
- four differents Ichimoku
- Tenkan, Kijun, Chikou and Kumo (monochrome or not)
- labels : offset from line, color if you change style and with/without abbreviation
Time Frames :
- 1m
- 3m
- 5m
- 15m
- 30m
- 45m
- 1h
- 2h
- 3h
- 4h
- Daily
- Weekly
- Monthly

Ichimoku Timeframe - [Silver-Wong]"Ichi Time" displays an Ichimoku indicator from another timeframe.
IE: Displays Ichimoku Daily while you are on the 4H chart.
Available timeframes:
- 1H
- 4H
- 12H
- Daily
- Weekly

Superstock 10-30 WMA Band script I was reading Jesse Stine's Insider Buy Superstocks book, and one of the technical traits he mentioned of a superstock (read the book, seriously, very strongly recommended) was a breakout above the 30 weekly moving average. He goes on to mention that after breakout, the 10 WMA often acts as a support line where you can add to your position. This script is inspired by the visual direction of Chris Moody's slingshot system, and how it displays MA's. The skinny line is the 10 WMA and the bigger line is the 30.

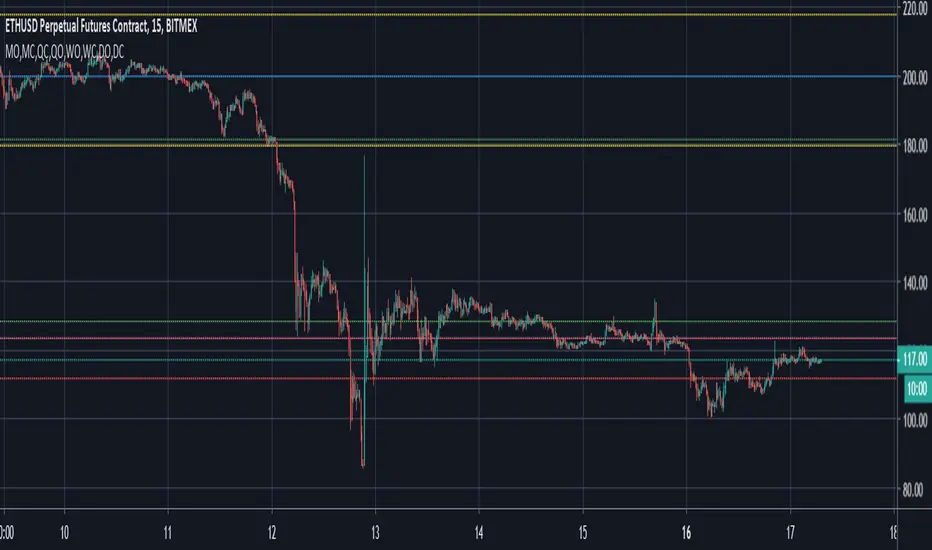
Previous Quarterly, Monthly, Weekly, Daily Candle Open, Close.This script marks the Previous Quarterly, Monthly, Weekly, and Daily Candle Open and Closes. Colors can be changed as needed.
Custom Time ranges. Daily price ranges.Addition to previous time range script, now containing daily ranges. You can select a day of the week, and have it show the high, low, mid, and open of that day.
For the time bands:
Monday = 2
Tuesday = 3
Wednesday = 4
Thursday = 5
Friday = 6
Saturday = 7
Sunday = 1
Example 1:
1500-1800:2
This will colour the background between 3pm and 6pm on Mondays.
Example 2:
0000-0600:247
This will colour the background between midnight and 6am on Mondays, Wednesdays, and Saturdays.
For the Daily price ranges:
Just select the tick-box forthe day, and then the price levels you'd like to see.
I want to add specific weekly levels to this, for example: week 06 of year 2020, but I've not figured out how to do it yet. If anyone knows, I'd appreciate it if you let me know. I'll then update this script.
As always, any questions you may have, please leave in comments below and I'll respond when I have time.
If you notice anything good with this indicator, let me know. We are all in this to make money after all! ;)

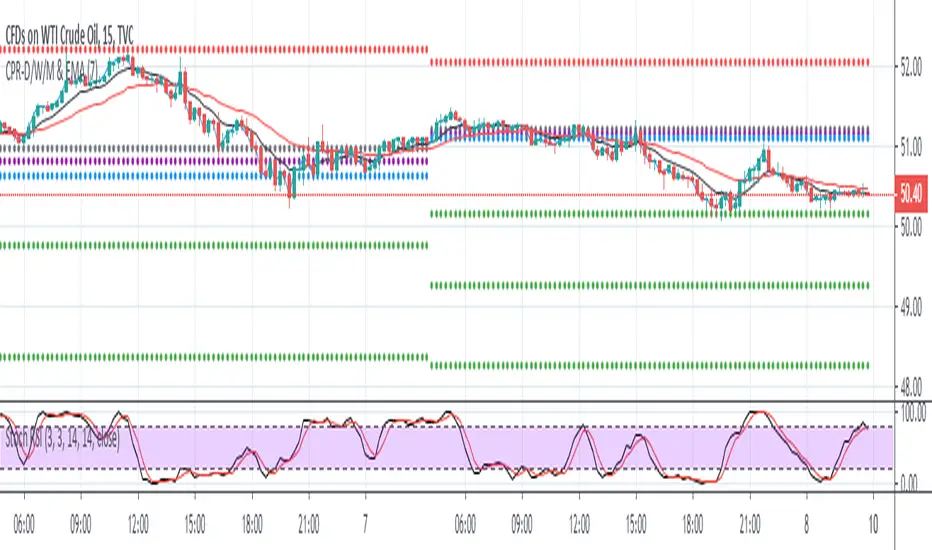
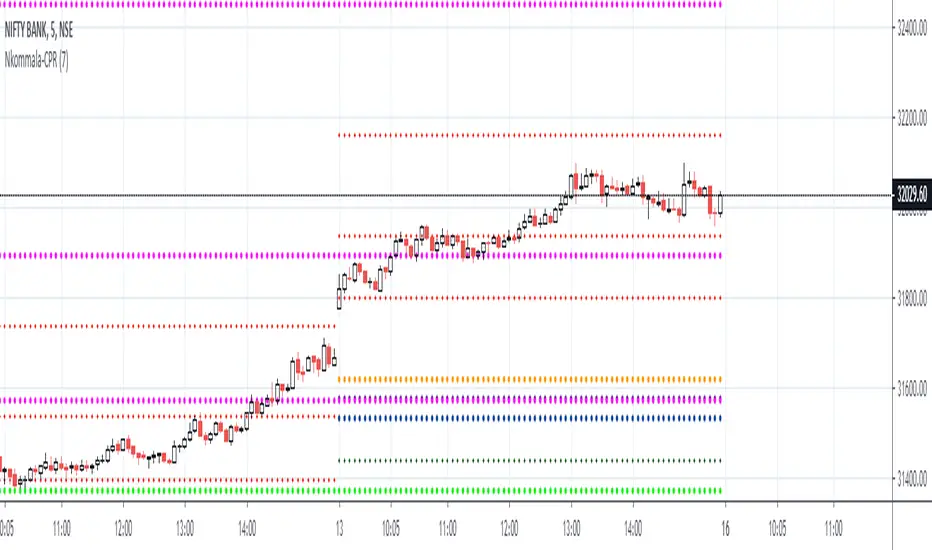
CPR-Pivot with day, Month, Weekly & EMA crossoverThis is CPR-Pivot with day, Month, Weekly time frame & EMA crossover
MultiTimeFrame Fractals D W M [xdecow]This indicator shows fractals in different timeframes. With the possibility of coloring the bars with any combination of current, daily, weekly and monthly timeframes.
The return points are calculated as follows:
high > last 3 highs and close above highest low
low < last 3 lows and closes below lowest high
The direction of higher timeframes fractals tend to be more durable and reliable. This indicator helps to find the fractal alignment of different timeframes, so that you can look for trade opportunities in the same direction as the higher timeframes and improve your chances.

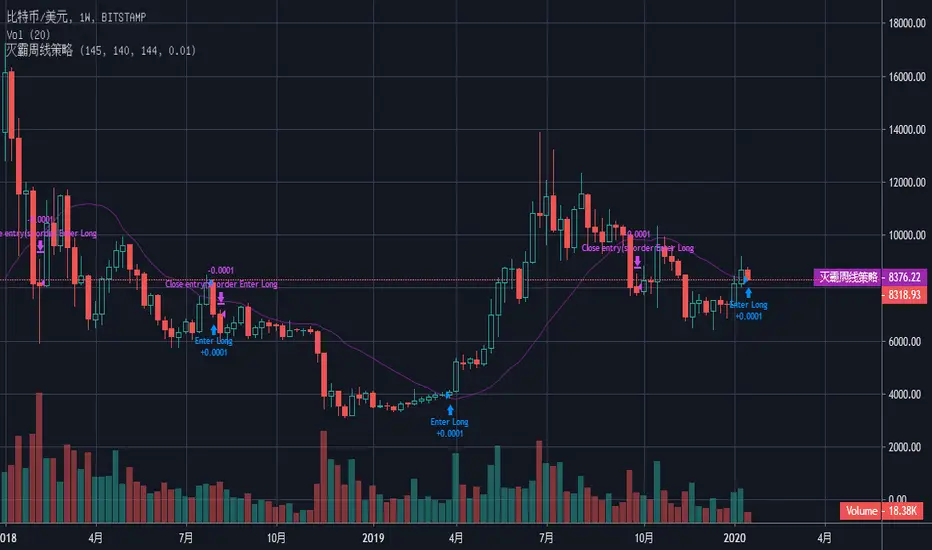
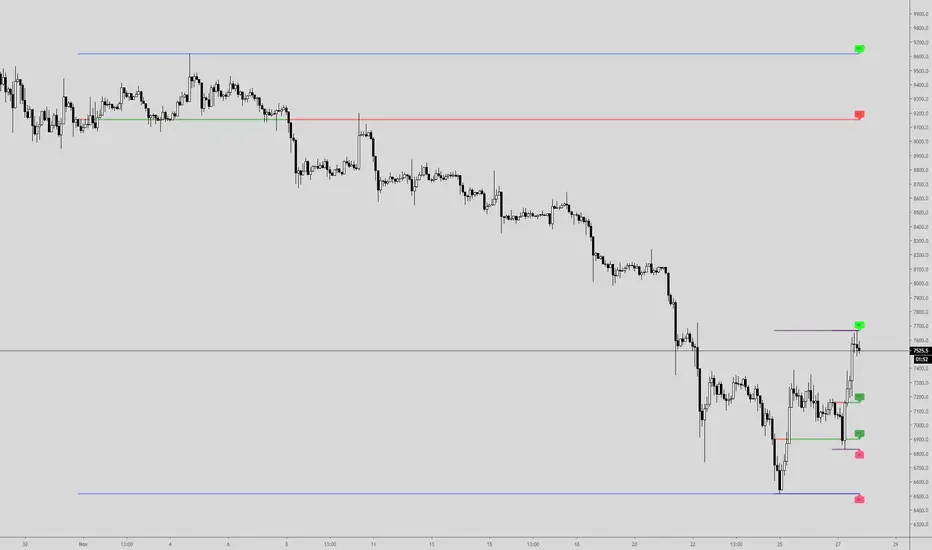
Bithanos Weekly Trend strategy 灭霸比特币BITSTAMP:BTCUSD
Just for bitcoin weekly trend strategy. It is mainly used for helping to decide buy and sell spot bitcoin.
"enter long" on chart meas the price may go up trend in future weeks.
"close the enter long order " on chart meas the price may not go up trend in future weeks.The indeterminacy of future may be go down trend or Shock market.
Recommended the "position%" to be "1".
推荐用bitstamp BTCUSD 交易对。
仅用于比特币周线趋势策略。主要用于帮助判断现货比特币的买卖。
“enter long ” 周线看涨
“close enter long” 周线止看涨,说明后面不确定,可能是震荡,也可能是下跌。
推荐设置 “position%参数”为“1” .
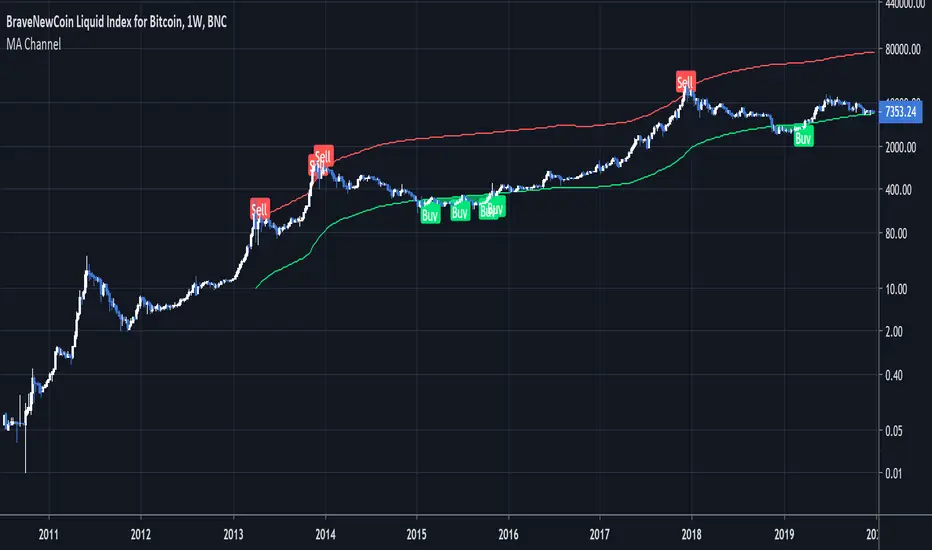
Moving Average ChannelIntended for use on BTC long term (BNC:BLX Weekly) with Logarithmic charts only
As Bitcoin is adopted, it moves through market cycles. These are created by periods where market participants are over-excited causing the price to over-extend, and periods where they are overly pessimistic where the price over-contracts. Identifying and understanding these periods can be beneficial to the long term investor. This long term investment tool is a simple and effective way to highlight those periods.
Buying Bitcoin when the price drops below the green line has historically generated outsized returns. Selling Bitcoin when price goes above the red line has been historically effective for taking profits.
NOTE: 144 Week = 2¾ Years. 104 Weeks = 2 Years. Originally created by Philip Swift

camarilla - Daily,Weekly,Monthly by Ganeshcamarilla - Daily,Weekly,Monthly levels in one chart for support and resitance

che_trader - Monthly, weekly and daily levelsI share with you my version of the most important high time frame levels in a version pleasant to the eye and with several options.
This indicator contains:
Current levels:
The possibility to change from green to red depending on whether the price is above or below the level.
Available for:
current daily open
current weekly open
current monthly open
The indicator shows the open, low and high for each default level.
It is also possible through the menu to add the levels for the last days, weeks or months, disabled by default.
This script is free to use!
Enjoy!
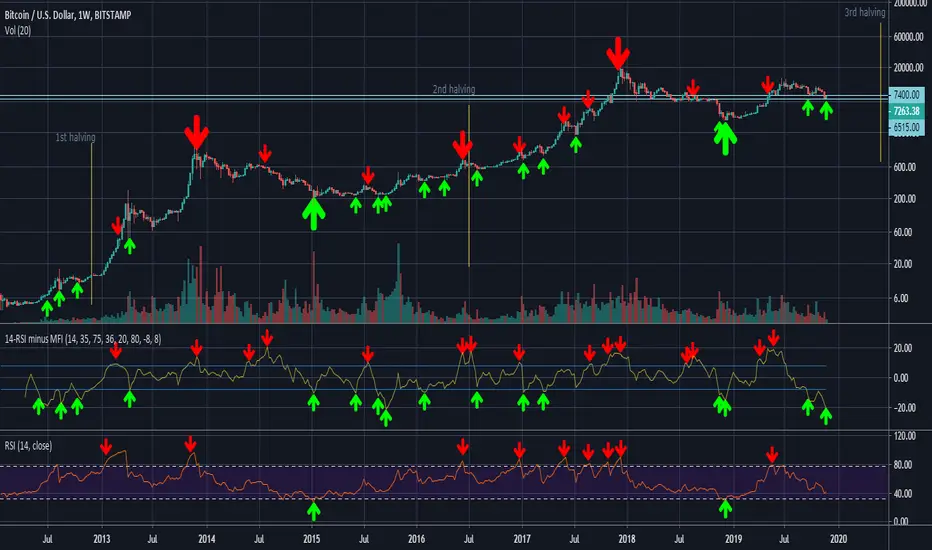
14-RSI minus 36-MFI (weekly)On the weekly chart of BTC/USD, the difference between the 14-RSI and the 36-MFI, combined with the 14-RSI alone, gives good buy and sell signals.
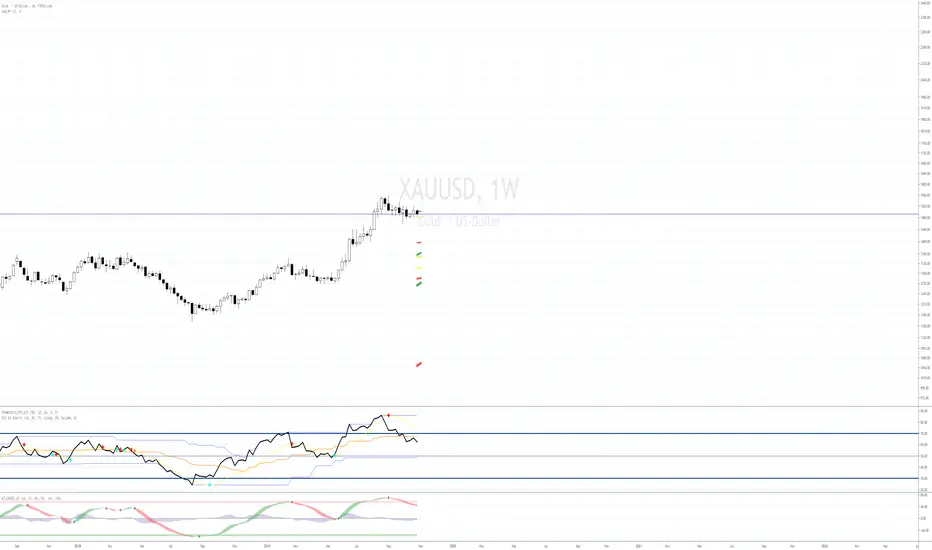
Global Indices Weekly Investment StrategyThis strategy aims to provide the optimal times to buy/sell assets on a long term basis. From my testing it works best on a weekly or monthly time frame. The default values are currently set to work best on Global Indices such as the S&P 500. It is very simple in its core, it uses price historical price action to estimate where in a market cycle the asset is. Then combined with a basic Moving-Average-like baseline and long term trend oscillator to gauge direction, it attempts to find the best time to buy/sell an asset to reduce capital draw-down and maximise future profits.
Returns here are based on an account balance and trade sizes of £100,000 with no compounding. Does not take into account exchange fees - 0% commission.
Please let me know if you have found any optimal settings for a given market using this strategy; such as all commodities. Or if you have any suggestions on how the strategy could be improved in general.

sma 50 100 200 multi Timframes actual daily weekly monthlysma 50-100-200
Just 3 sma from actual,daily,weekly and monthly timeframe
Moving Average Daily (& Weekly) 50,100,200Free to use Moving Average indicator for 50, 100 and 200 days that displays both the daily and weekly Moving Averages on the same chart - revealing key support and resistance lines that might otherwise be overlooked. Please ensure to view in daily view only.
What is a Moving Average?
Smooths out the price across each period to reveal short, medium and long term trends and their relationship to each other. In principal, when the price is above a moving average the trend is up, when the price is below a moving average the trend is down.
When a short term MA crosses above a long term MA (a "golden cross") it is a strong buy signal. Conversely when a short term MA crosses below a long term MA (a "death cross") it is a strong sell signal. However, a death cross is usually only critical when both MAs are moving downwards.
Note that Moving Averages represent historical data and therefore are not strictly predictive in nature, but show trends that may be in action. Notably the 200 MA will often be particularly respected as support or resistance.
This tool is for educational purposes only and not a recommendation to buy or sell. Always do your own research before trading.
