RSI Chart LevelsThe RSI Chart Levels shows you in a simple way where Support/Resistance might be. You want to make sure all settings are the same in the RSI that you are using with this overlay to be accurate.
This is also good at spotting divergence in real-time. If price goes over the Higher High but the RSI hasn't gained a new Higher High it is showing divergence, vice versa for Lower Low.
This overlay was created with the idea of RSI Divergence Scanner by zdmre indicator. Add his RSI and match the settings to the chart overlay. The default Zigzag is set to 7 which zdmre settings is different so change to whatever you prefer.
Shoutout to zdmre original work!
Search in scripts for "zigzag"

PivotLibrary "Pivot"
This library helps you store and manage pivots.
bias(isHigh, isHigher, prevWasHigher)
Helper function to calculate bias.
Parameters:
isHigh (bool) : (bool) Wether the pivot is a pivot high or not.
isHigher (bool) : (bool) Wether the pivot is a higher pivot or not.
@return (bool) The bias (true = bullish, false = bearish, na = neutral).
prevWasHigher (bool)
biasToString(bias)
Parameters:
bias (bool)
biasToColor(bias, theme)
Parameters:
bias (bool)
theme (Theme)
nameString(isHigh, isHigher)
Parameters:
isHigh (bool)
isHigher (bool)
abbrString(isHigh, isHigher)
Parameters:
isHigh (bool)
isHigher (bool)
tooltipString(y, isHigh, isHigher, bias, theme)
Parameters:
y (float)
isHigh (bool)
isHigher (bool)
bias (bool)
theme (Theme)
createLabel(x, y, isHigh, isHigher, prevWasHigher, settings)
Parameters:
x (int)
y (float)
isHigh (bool)
isHigher (bool)
prevWasHigher (bool)
settings (Settings)
new(x, y, isHigh, isHigher, settings)
Parameters:
x (int)
y (float)
isHigh (bool)
isHigher (bool)
settings (Settings)
newArray(size, initialValue)
Parameters:
size (int)
initialValue (Pivot)
method getFirst(this)
Namespace types: Pivot
Parameters:
this (Pivot )
method getLast(this, isHigh)
Namespace types: Pivot
Parameters:
this (Pivot )
isHigh (bool)
method getLastHigh(this)
Namespace types: Pivot
Parameters:
this (Pivot )
method getLastLow(this)
Namespace types: Pivot
Parameters:
this (Pivot )
method getPrev(this, numBack, isHigh)
Namespace types: Pivot
Parameters:
this (Pivot )
numBack (int)
isHigh (bool)
method getPrevHigh(this, numBack)
Namespace types: Pivot
Parameters:
this (Pivot )
numBack (int)
method getPrevLow(this, numBack)
Namespace types: Pivot
Parameters:
this (Pivot )
numBack (int)
method getText(this)
Namespace types: Pivot
Parameters:
this (Pivot)
method setX(this, value)
Namespace types: Pivot
Parameters:
this (Pivot)
value (int)
method setY(this, value)
Namespace types: Pivot
Parameters:
this (Pivot)
value (float)
method setXY(this, x, y)
Namespace types: Pivot
Parameters:
this (Pivot)
x (int)
y (float)
method setBias(this, value)
Namespace types: Pivot
Parameters:
this (Pivot)
value (int)
method setColor(this, value)
Namespace types: Pivot
Parameters:
this (Pivot)
value (color)
method setText(this, value)
Namespace types: Pivot
Parameters:
this (Pivot)
value (string)
method add(this, pivot)
Namespace types: Pivot
Parameters:
this (Pivot )
pivot (Pivot)
method updateLast(this, y, settings)
Namespace types: Pivot
Parameters:
this (Pivot )
y (float)
settings (Settings)
method update(this, y, isHigh, settings)
Namespace types: Pivot
Parameters:
this (Pivot )
y (float)
isHigh (bool)
settings (Settings)
Pivot
Stores Pivot data.
Fields:
x (series int)
y (series float)
isHigh (series bool)
isHigher (series bool)
bias (series bool)
lb (series label)
Theme
Attributes for customizable look and feel.
Fields:
size (series string)
colorDefault (series color)
colorNeutral (series color)
colorBullish (series color)
colorBearish (series color)
colored (series bool)
showTooltips (series bool)
showTooltipName (series bool)
showTooltipValue (series bool)
showTooltipBias (series bool)
Settings
All settings for the pivot.
Fields:
theme (Theme)
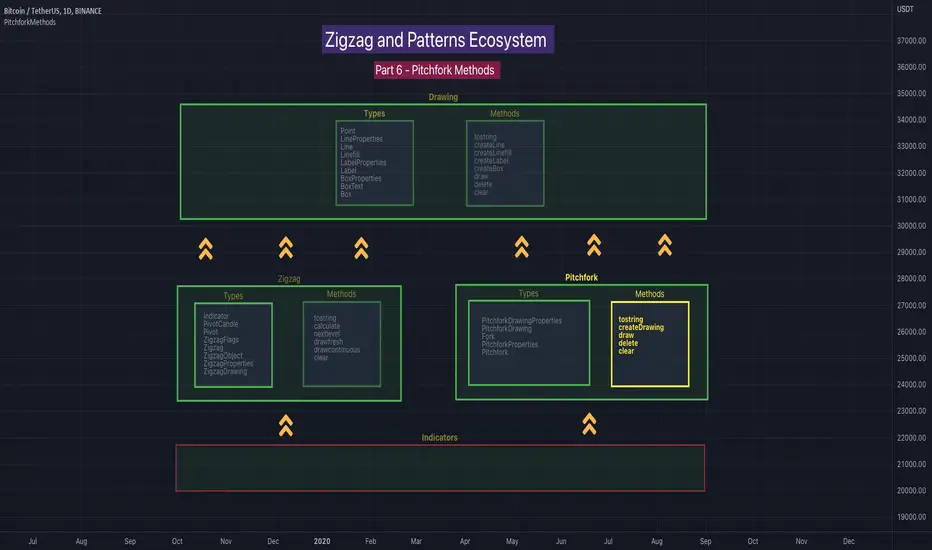
PitchforkMethodsLibrary "PitchforkMethods"
Methods associated with Pitchfork and Pitchfork Drawing. Depends on the library PitchforkTypes for Pitchfork/PitchforkDrawing objects which in turn use DrawingTypes for basic objects Point/Line/LineProperties. Also depends on DrawingMethods for related methods
tostring(this)
Converts PitchforkTypes/Fork object to string representation
Parameters:
this : PitchforkTypes/Fork object
Returns: string representation of PitchforkTypes/Fork
tostring(this)
Converts Array of PitchforkTypes/Fork object to string representation
Parameters:
this : Array of PitchforkTypes/Fork object
Returns: string representation of PitchforkTypes/Fork array
tostring(this, sortKeys, sortOrder)
Converts PitchforkTypes/PitchforkProperties object to string representation
Parameters:
this : PitchforkTypes/PitchforkProperties object
sortKeys : If set to true, string output is sorted by keys.
sortOrder : Applicable only if sortKeys is set to true. Positive number will sort them in ascending order whreas negative numer will sort them in descending order. Passing 0 will not sort the keys
Returns: string representation of PitchforkTypes/PitchforkProperties
tostring(this, sortKeys, sortOrder)
Converts PitchforkTypes/PitchforkDrawingProperties object to string representation
Parameters:
this : PitchforkTypes/PitchforkDrawingProperties object
sortKeys : If set to true, string output is sorted by keys.
sortOrder : Applicable only if sortKeys is set to true. Positive number will sort them in ascending order whreas negative numer will sort them in descending order. Passing 0 will not sort the keys
Returns: string representation of PitchforkTypes/PitchforkDrawingProperties
tostring(this, sortKeys, sortOrder)
Converts PitchforkTypes/Pitchfork object to string representation
Parameters:
this : PitchforkTypes/Pitchfork object
sortKeys : If set to true, string output is sorted by keys.
sortOrder : Applicable only if sortKeys is set to true. Positive number will sort them in ascending order whreas negative numer will sort them in descending order. Passing 0 will not sort the keys
Returns: string representation of PitchforkTypes/Pitchfork
createDrawing(this)
Creates PitchforkTypes/PitchforkDrawing from PitchforkTypes/Pitchfork object
Parameters:
this : PitchforkTypes/Pitchfork object
Returns: PitchforkTypes/PitchforkDrawing object created
createDrawing(this)
Creates PitchforkTypes/PitchforkDrawing array from PitchforkTypes/Pitchfork array of objects
Parameters:
this : array of PitchforkTypes/Pitchfork object
Returns: array of PitchforkTypes/PitchforkDrawing object created
draw(this)
draws from PitchforkTypes/PitchforkDrawing object
Parameters:
this : PitchforkTypes/PitchforkDrawing object
Returns: PitchforkTypes/PitchforkDrawing object drawn
delete(this)
deletes PitchforkTypes/PitchforkDrawing object
Parameters:
this : PitchforkTypes/PitchforkDrawing object
Returns: PitchforkTypes/PitchforkDrawing object deleted
delete(this)
deletes underlying drawing of PitchforkTypes/Pitchfork object
Parameters:
this : PitchforkTypes/Pitchfork object
Returns: PitchforkTypes/Pitchfork object deleted
delete(this)
deletes array of PitchforkTypes/PitchforkDrawing objects
Parameters:
this : Array of PitchforkTypes/PitchforkDrawing object
Returns: Array of PitchforkTypes/PitchforkDrawing object deleted
delete(this)
deletes underlying drawing in array of PitchforkTypes/Pitchfork objects
Parameters:
this : Array of PitchforkTypes/Pitchfork object
Returns: Array of PitchforkTypes/Pitchfork object deleted
clear(this)
deletes array of PitchforkTypes/PitchforkDrawing objects and clears the array
Parameters:
this : Array of PitchforkTypes/PitchforkDrawing object
Returns: void
clear(this)
deletes array of PitchforkTypes/Pitchfork objects and clears the array
Parameters:
this : Array of Pitchfork/Pitchfork object
Returns: void
PitchforkTypesLibrary "PitchforkTypes"
User Defined Types to be used for Pitchfork and Drawing elements of Pitchfork. Depends on DrawingTypes for Point, Line, and LineProperties objects
PitchforkDrawingProperties
Pitchfork Drawing Properties object
Fields:
extend : If set to true, forks are extended towards right. Default is true
fill : Fill forklines with transparent color. Default is true
fillTransparency : Transparency at which fills are made. Only considered when fill is set. Default is 80
forceCommonColor : Force use of common color for forks and fills. Default is false
commonColor : common fill color. Used only if ratio specific fill colors are not available or if forceCommonColor is set to true.
PitchforkDrawing
Pitchfork drawing components
Fields:
medianLine : Median line of the pitchfork
baseLine : Base line of the pitchfork
forkLines : fork lines of the pitchfork
linefills : Linefills between forks
Fork
Fork object property
Fields:
ratio : Fork ratio
forkColor : color of fork. Default is blue
include : flag to include the fork in drawing. Default is true
PitchforkProperties
Pitchfork Properties
Fields:
forks : Array of Fork objects
type : Pitchfork type. Supported values are "regular", "schiff", "mschiff", Default is regular
inside : Flag to identify if to draw inside fork. If set to true, inside fork will be drawn
Pitchfork
Pitchfork object
Fields:
a : Pivot Point A of pitchfork
b : Pivot Point B of pitchfork
c : Pivot Point C of pitchfork
properties : PitchforkProperties object which determines type and composition of pitchfork
dProperties : Drawing properties for pitchfork
lProperties : Common line properties for Pitchfork lines
drawing : PitchforkDrawing object

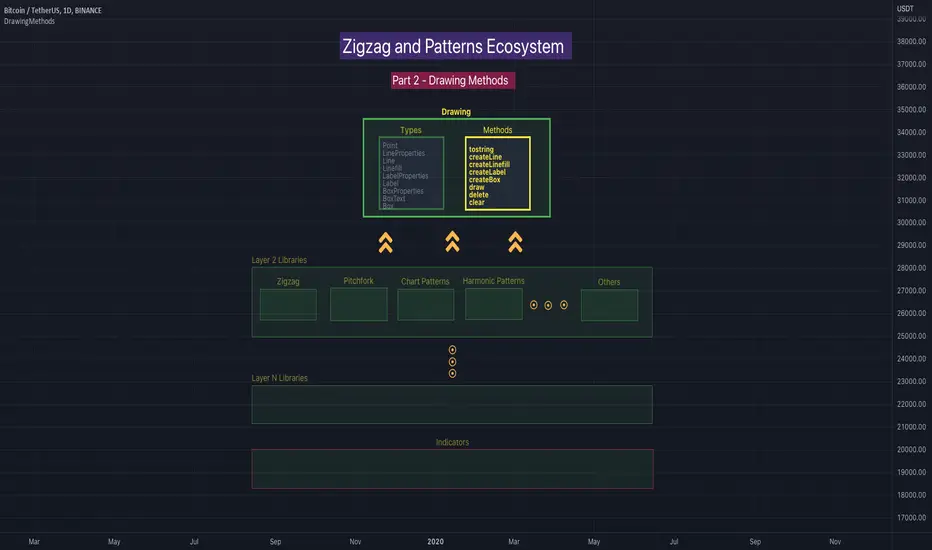
DrawingMethodsLibrary "DrawingMethods"
tostring(this, sortKeys, sortOrder, includeKeys)
Converts DrawingTypes/Point object to string representation
Parameters:
this : DrawingTypes/Point object
sortKeys : If set to true, string output is sorted by keys.
sortOrder : Applicable only if sortKeys is set to true. Positive number will sort them in ascending order whreas negative numer will sort them in descending order. Passing 0 will not sort the keys
includeKeys : Array of string containing selective keys. Optional parmaeter. If not provided, all the keys are considered
Returns: string representation of DrawingTypes/Point
tostring(this, sortKeys, sortOrder, includeKeys)
Converts DrawingTypes/LineProperties object to string representation
Parameters:
this : DrawingTypes/LineProperties object
sortKeys : If set to true, string output is sorted by keys.
sortOrder : Applicable only if sortKeys is set to true. Positive number will sort them in ascending order whreas negative numer will sort them in descending order. Passing 0 will not sort the keys
includeKeys : Array of string containing selective keys. Optional parmaeter. If not provided, all the keys are considered
Returns: string representation of DrawingTypes/LineProperties
tostring(this, sortKeys, sortOrder, includeKeys)
Converts DrawingTypes/Line object to string representation
Parameters:
this : DrawingTypes/Line object
sortKeys : If set to true, string output is sorted by keys.
sortOrder : Applicable only if sortKeys is set to true. Positive number will sort them in ascending order whreas negative numer will sort them in descending order. Passing 0 will not sort the keys
includeKeys : Array of string containing selective keys. Optional parmaeter. If not provided, all the keys are considered
Returns: string representation of DrawingTypes/Line
tostring(this, sortKeys, sortOrder, includeKeys)
Converts DrawingTypes/LabelProperties object to string representation
Parameters:
this : DrawingTypes/LabelProperties object
sortKeys : If set to true, string output is sorted by keys.
sortOrder : Applicable only if sortKeys is set to true. Positive number will sort them in ascending order whreas negative numer will sort them in descending order. Passing 0 will not sort the keys
includeKeys : Array of string containing selective keys. Optional parmaeter. If not provided, all the keys are considered
Returns: string representation of DrawingTypes/LabelProperties
tostring(this, sortKeys, sortOrder, includeKeys)
Converts DrawingTypes/Label object to string representation
Parameters:
this : DrawingTypes/Label object
sortKeys : If set to true, string output is sorted by keys.
sortOrder : Applicable only if sortKeys is set to true. Positive number will sort them in ascending order whreas negative numer will sort them in descending order. Passing 0 will not sort the keys
includeKeys : Array of string containing selective keys. Optional parmaeter. If not provided, all the keys are considered
Returns: string representation of DrawingTypes/Label
tostring(this, sortKeys, sortOrder, includeKeys)
Converts DrawingTypes/Linefill object to string representation
Parameters:
this : DrawingTypes/Linefill object
sortKeys : If set to true, string output is sorted by keys.
sortOrder : Applicable only if sortKeys is set to true. Positive number will sort them in ascending order whreas negative numer will sort them in descending order. Passing 0 will not sort the keys
includeKeys : Array of string containing selective keys. Optional parmaeter. If not provided, all the keys are considered
Returns: string representation of DrawingTypes/Linefill
tostring(this, sortKeys, sortOrder, includeKeys)
Converts DrawingTypes/BoxProperties object to string representation
Parameters:
this : DrawingTypes/BoxProperties object
sortKeys : If set to true, string output is sorted by keys.
sortOrder : Applicable only if sortKeys is set to true. Positive number will sort them in ascending order whreas negative numer will sort them in descending order. Passing 0 will not sort the keys
includeKeys : Array of string containing selective keys. Optional parmaeter. If not provided, all the keys are considered
Returns: string representation of DrawingTypes/BoxProperties
tostring(this, sortKeys, sortOrder, includeKeys)
Converts DrawingTypes/BoxText object to string representation
Parameters:
this : DrawingTypes/BoxText object
sortKeys : If set to true, string output is sorted by keys.
sortOrder : Applicable only if sortKeys is set to true. Positive number will sort them in ascending order whreas negative numer will sort them in descending order. Passing 0 will not sort the keys
includeKeys : Array of string containing selective keys. Optional parmaeter. If not provided, all the keys are considered
Returns: string representation of DrawingTypes/BoxText
tostring(this, sortKeys, sortOrder, includeKeys)
Converts DrawingTypes/Box object to string representation
Parameters:
this : DrawingTypes/Box object
sortKeys : If set to true, string output is sorted by keys.
sortOrder : Applicable only if sortKeys is set to true. Positive number will sort them in ascending order whreas negative numer will sort them in descending order. Passing 0 will not sort the keys
includeKeys : Array of string containing selective keys. Optional parmaeter. If not provided, all the keys are considered
Returns: string representation of DrawingTypes/Box
delete(this)
Deletes line from DrawingTypes/Line object
Parameters:
this : DrawingTypes/Line object
Returns: Line object deleted
delete(this)
Deletes label from DrawingTypes/Label object
Parameters:
this : DrawingTypes/Label object
Returns: Label object deleted
delete(this)
Deletes Linefill from DrawingTypes/Linefill object
Parameters:
this : DrawingTypes/Linefill object
Returns: Linefill object deleted
delete(this)
Deletes box from DrawingTypes/Box object
Parameters:
this : DrawingTypes/Box object
Returns: DrawingTypes/Box object deleted
delete(this)
Deletes lines from array of DrawingTypes/Line objects
Parameters:
this : Array of DrawingTypes/Line objects
Returns: Array of DrawingTypes/Line objects
delete(this)
Deletes labels from array of DrawingTypes/Label objects
Parameters:
this : Array of DrawingTypes/Label objects
Returns: Array of DrawingTypes/Label objects
delete(this)
Deletes linefill from array of DrawingTypes/Linefill objects
Parameters:
this : Array of DrawingTypes/Linefill objects
Returns: Array of DrawingTypes/Linefill objects
delete(this)
Deletes boxes from array of DrawingTypes/Box objects
Parameters:
this : Array of DrawingTypes/Box objects
Returns: Array of DrawingTypes/Box objects
clear(this)
clear items from array of DrawingTypes/Line while deleting underlying objects
Parameters:
this : array
Returns: void
clear(this)
clear items from array of DrawingTypes/Label while deleting underlying objects
Parameters:
this : array
Returns: void
clear(this)
clear items from array of DrawingTypes/Linefill while deleting underlying objects
Parameters:
this : array
Returns: void
clear(this)
clear items from array of DrawingTypes/Box while deleting underlying objects
Parameters:
this : array
Returns: void
draw(this)
Creates line from DrawingTypes/Line object
Parameters:
this : DrawingTypes/Line object
Returns: line created from DrawingTypes/Line object
draw(this)
Creates lines from array of DrawingTypes/Line objects
Parameters:
this : Array of DrawingTypes/Line objects
Returns: Array of DrawingTypes/Line objects
draw(this)
Creates label from DrawingTypes/Label object
Parameters:
this : DrawingTypes/Label object
Returns: label created from DrawingTypes/Label object
draw(this)
Creates labels from array of DrawingTypes/Label objects
Parameters:
this : Array of DrawingTypes/Label objects
Returns: Array of DrawingTypes/Label objects
draw(this)
Creates linefill object from DrawingTypes/Linefill
Parameters:
this : DrawingTypes/Linefill objects
Returns: linefill object created
draw(this)
Creates linefill objects from array of DrawingTypes/Linefill objects
Parameters:
this : Array of DrawingTypes/Linefill objects
Returns: Array of DrawingTypes/Linefill used for creating linefills
draw(this)
Creates box from DrawingTypes/Box object
Parameters:
this : DrawingTypes/Box object
Returns: box created from DrawingTypes/Box object
draw(this)
Creates labels from array of DrawingTypes/Label objects
Parameters:
this : Array of DrawingTypes/Label objects
Returns: Array of DrawingTypes/Label objects
createLabel(this, lblText, tooltip, properties)
Creates DrawingTypes/Label object from DrawingTypes/Point
Parameters:
this : DrawingTypes/Point object
lblText : Label text
tooltip : Tooltip text. Default is na
properties : DrawingTypes/LabelProperties object. Default is na - meaning default values are used.
Returns: DrawingTypes/Label object
createLine(this, other, properties)
Creates DrawingTypes/Line object from one DrawingTypes/Point to other
Parameters:
this : First DrawingTypes/Point object
other : Second DrawingTypes/Point object
properties : DrawingTypes/LineProperties object. Default set to na - meaning default values are used.
Returns: DrawingTypes/Line object
createLinefill(this, other, fillColor, transparency)
Creates DrawingTypes/Linefill object from DrawingTypes/Line object to other DrawingTypes/Line object
Parameters:
this : First DrawingTypes/Line object
other : Other DrawingTypes/Line object
fillColor : fill color of linefill. Default is color.blue
transparency : fill transparency for linefill. Default is 80
Returns: Array of DrawingTypes/Linefill object
createBox(this, other, properties, textProperties)
Creates DrawingTypes/Box object from one DrawingTypes/Point to other
Parameters:
this : First DrawingTypes/Point object
other : Second DrawingTypes/Point object
properties : DrawingTypes/BoxProperties object. Default set to na - meaning default values are used.
textProperties : DrawingTypes/BoxText object. Default is na - meaning no text will be drawn
Returns: DrawingTypes/Box object
createBox(this, properties, textProperties)
Creates DrawingTypes/Box object from DrawingTypes/Line as diagonal line
Parameters:
this : Diagonal DrawingTypes/PoLineint object
properties : DrawingTypes/BoxProperties object. Default set to na - meaning default values are used.
textProperties : DrawingTypes/BoxText object. Default is na - meaning no text will be drawn
Returns: DrawingTypes/Box object
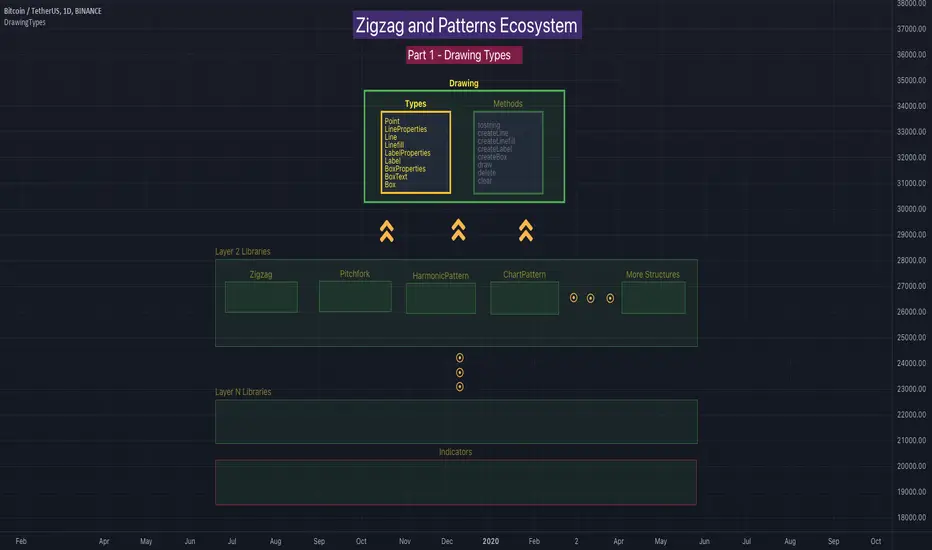
DrawingTypesLibrary "DrawingTypes"
User Defined Types for basic drawing structure. Other types and methods will be built on these.
Point
Point refers to point on chart
Fields:
price : pivot price
bar : pivot bar
bartime : pivot bar time
LineProperties
Properties of line object
Fields:
xloc : X Reference - can be either xloc.bar_index or xloc.bar_time. Default is xloc.bar_index
extend : Property which sets line to extend towards either right or left or both. Valid values are extend.right, extend.left, extend.both, extend.none. Default is extend.none
color : Line color
style : Line style, valid values are line.style_solid, line.style_dashed, line.style_dotted, line.style_arrow_left, line.style_arrow_right, line.style_arrow_both. Default is line.style_solid
width : Line width. Default is 1
Line
Line object created from points
Fields:
start : Starting point of the line
end : Ending point of the line
properties : LineProperties object which defines the style of line
object : Derived line object
LabelProperties
Properties of label object
Fields:
xloc : X Reference - can be either xloc.bar_index or xloc.bar_time. Default is xloc.bar_index
yloc : Y reference - can be yloc.price, yloc.abovebar, yloc.belowbar. Default is yloc.price
color : Label fill color
style : Label style as defined in www.tradingview.com Default is label.style_none
textcolor : text color. Default is color.black
size : Label text size. Default is size.normal. Other values are size.auto, size.tiny, size.small, size.normal, size.large, size.huge
textalign : Label text alignment. Default if text.align_center. Other allowed values - text.align_right, text.align_left, text.align_top, text.align_bottom
text_font_family : The font family of the text. Default value is font.family_default. Other available option is font.family_monospace
Label
Label object
Fields:
point : Point where label is drawn
lblText : label text
tooltip : Tooltip text. Default is na
properties : LabelProperties object
object : Pine label object
Linefill
Linefill object
Fields:
line1 : First line to create linefill
line2 : Second line to create linefill
fillColor : Fill color
transparency : Fill transparency range from 0 to 100
object : linefill object created from wrapper
BoxProperties
BoxProperties object
Fields:
border_color : Box border color. Default is color.blue
bgcolor : box background color
border_width : Box border width. Default is 1
border_style : Box border style. Default is line.style_solid
extend : Extend property of box. default is extend.none
xloc : defines if drawing needs to be done based on bar index or time. default is xloc.bar_index
BoxText
Box Text properties.
Fields:
boxText : Text to be printed on the box
text_size : Text size. Default is size.auto
text_color : Box text color. Default is color.yellow.
text_halign : horizontal align style - default is text.align_center
text_valign : vertical align style - default is text.align_center
text_wrap : text wrap style - default is text.wrap_auto
text_font_family : Text font. Default is
Box
Box object
Fields:
p1 : Diagonal point one
p2 : Diagonal point two
properties : Box properties
textProperties : Box text properties
object : Box object created
Market Structure MA Based BOS [liwei666]
🎲 Overview
🎯 This BOS(Break Of Structure) indicator build based on different MA such as EMA/RMA/HMA, it's usually earlier than pivothigh() method
when trend beginning, customer your BOS with 2 parameters now.
🎲 Indicator design logic
🎯 The logic is simple and code looks complex, I‘ll explain core logic but not code details.
1. use close-in EMA's highest/lowest value mark as SWING High/Low when EMA crossover/under,
not use func ta.pivothigh()/ta.pivotlow()
2. once price reaching EMA’s SWING High/Low, draw a line link High/Low to current bar, labled as BOS
3. find regular pattern benefit your trading.
🎲 Settings
🎯 there are 4 input properties in script, 2 properties are meaningful in 'GRP1' another 2 are display config in 'GRP2'.
GRP1
MA_Type: MA type you can choose(EMA/RMA/SMA/HMA), default is 'HMA'.
short_ma_len: MA length of your current timeframe on chart
GRP2
show_short_zz: Show short_ma Zigzag
show_ma_cross_signal: Show ma_cross_signal
🎲 Usage
🎯 BOS signal usually worked fine in high volatility market, low volatility is meaningless.
🎯 We can see that it performs well in trending market of different symbols, and BOS is an opportunity to add positions
BINANCE:BTCUSDTPERP
BINANCE:ETHUSDTPERP
🎯 MA Based signal is earlier than pivothigh()/pivotlow() method when trend beginning. it means higher profit-loss rate.
🎯 any questions or suggestion please comment below.
Additionally, I plan to publish 20 profitable strategies in 2023; indicatior not one of them,
let‘s witness it together!
Hope this indicator will be useful for you :)
enjoy! 🚀🚀🚀

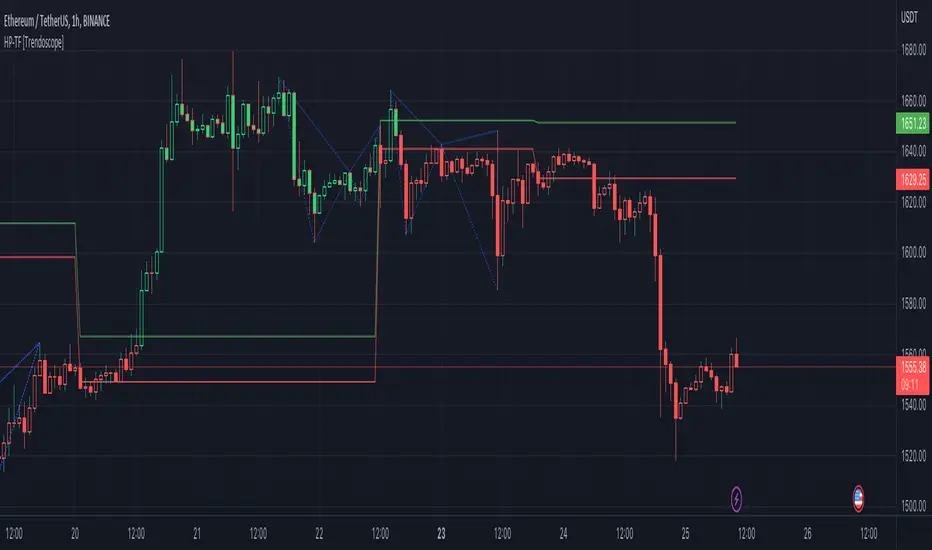
Harmonic Patterns Based SupertrendExtending the earlier implemented concept of Harmonic-Patterns-Based-Trend-Follower , in this script, lets make it work as supertrend so that it is more easier to operate.
🎲 Process
🎯 Derive Zigzag and scan harmonic patterns for last 5 confirmed pivots
🎯 If a pattern is found, bullish and bearish zones are calculated based on parameter Base
🎯 These bullish and bearish zones act as supertrend based on current trade in progress.
🎯 When in bullish mode, bearish zone will only go up irrespective of new pattern forming new low. Similarly when in bearish mode, bullish zones will only come down - this is done to imitate the standard supertrend behaviour.
🎲 Note
Patterns are not created on latest pivot as last pivot will be unconfirmed and moving. Due to this, patterns appear after certain delay - patterns will not be real time. But, this is expected and does not impact the overall process.
Here are few chart captures to demonstrate how it works.
🎲 Settings
Settings are explained in the screenshot below.

Harmonic Patterns Based Trend FollowerEarlier this week, published an idea on how harmonic patterns can be used for trend following. This script is an attempt to implement the same.
🎲 Process
🎯 Derive Zigzag and scan harmonic patterns for last 5 confirmed pivots
🎯 If a pattern is found, highest point of pattern will become the bullish zone and lower point of the pattern will become bearish zone.
🎯 Since it is trend following method, when price reaches bullish zone, then the trend is considered as bullish and when price reaches bearish zone, the trend is considered as bearish.
🎯 If price does not touch both regions, then trend remains unchanged.
🎯 Bullish and bearish zone will change as and when new patterns are formed.
🎲 Note
Patterns are not created on latest pivot as last pivot will be unconfirmed and moving. Due to this, patterns appear after certain delay - patterns will not be real time. But, this is expected and does not impact the overall process.
When new pattern formed
When price breaks over the zones
🎲 Output
🎯 Patterns formed are drawn in blue coloured lines. Due to pine limitation of max 500 lines, older patterns automatically get deleted when new ones come.
🎯 Bullish Zone and Bearish Zone are plotted in green and red colours and the zone will change whenever new pattern comes along.
🎯 Bar colors are changed according to calculated trend. Trend value can be 1 or -1 based on the current trend. You can also find the value in data window.
🎯 For simplicity purpose, input option for selection of specific patterns are not provided and also pattern names are not displayed on the chart.
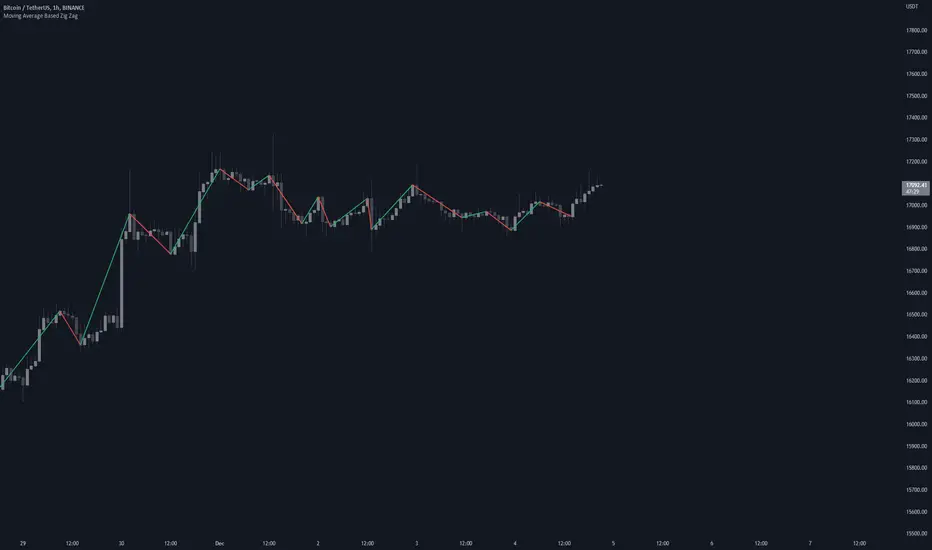
Moving Average Based Zig ZagMoving Average Based Zig Zag differs from the traditional Zig Zag indicator in that pivot points are determined by a moving average, Volume Weighted Hull Moving Average, rather than looking for the highest or lowest point in a left / right period.
Settings
Source: the source for the pivot points.
Moving Average Length: the length of the Volume Weighted Hull Moving Average, increase for longer zig zags, decrease for shorter zig zags.
Usage
Like all Zig Zag indicators, the Moving Average Based Zig Zag is not intended to be used as a live trading tool. This indicator is intended to be an alternative way of determining pivot points on your chart. Pivot points can be used for a multitude of different analytical techniques. One may use pivot points in order to draw potential support and resistance lines, trend lines or chart patterns. Additionally, pivot points can be used to determine variations of highs and lows important to market structure analysis such as break of structure or change of character.
Details
The moving average used is a Volume Weighted Hull Moving Average, this particular moving average was used due to it's relatively low-lag characteristics when compared to an Exponential Moving Average, additionally by considering volume in the moving average calculation, insignificant pivot points can be further filtered.
Rather than using built-in functions `ta.pivothigh()` and `ta.pivotlow()` to determine pivot points, this indicator waits for the moving average to pivot then searches for the highest or lowest value from the bar index of the moving average pivot to the bar index of the previous found price pivot. This method of determining pivots provides a more dynamic approach to determining pivot points.
Ultimate Strategy Template (Advanced Edition)Hello traders
This script is an upgraded version of that one below
New features
- Upgraded to Pinescript version 5
- Added the exit SL/TP now in real-time
- Added text fields for the alerts - easier to send the commands to your trading bots
Step 1: Create your connector
Adapt your indicator with only 2 lines of code and then connect it to this strategy template.
For doing so:
1) Find in your indicator where are the conditions printing the long/buy and short/sell signals.
2) Create an additional plot as below
I'm giving an example with a Two moving averages cross.
Please replicate the same methodology for your indicator wether it's a MACD , ZigZag , Pivots , higher-highs, lower-lows or whatever indicator with clear buy and sell conditions.
//@version=5
indicator(title='Moving Average Cross', shorttitle='Moving Average Cross', overlay=true, precision=6, max_labels_count=500, max_lines_count=500)
type_ma1 = input.string(title='MA1 type', defval='SMA', options= )
length_ma1 = input(10, title=' MA1 length')
type_ma2 = input.string(title='MA2 type', defval='SMA', options= )
length_ma2 = input(100, title=' MA2 length')
// MA
f_ma(smoothing, src, length) =>
rma_1 = ta.rma(src, length)
sma_1 = ta.sma(src, length)
ema_1 = ta.ema(src, length)
iff_1 = smoothing == 'EMA' ? ema_1 : src
iff_2 = smoothing == 'SMA' ? sma_1 : iff_1
smoothing == 'RMA' ? rma_1 : iff_2
MA1 = f_ma(type_ma1, close, length_ma1)
MA2 = f_ma(type_ma2, close, length_ma2)
// buy and sell conditions
buy = ta.crossover(MA1, MA2)
sell = ta.crossunder(MA1, MA2)
plot(MA1, color=color.new(color.green, 0), title='Plot MA1', linewidth=3)
plot(MA2, color=color.new(color.red, 0), title='Plot MA2', linewidth=3)
plotshape(buy, title='LONG SIGNAL', style=shape.circle, location=location.belowbar, color=color.new(color.green, 0), size=size.normal)
plotshape(sell, title='SHORT SIGNAL', style=shape.circle, location=location.abovebar, color=color.new(color.red, 0), size=size.normal)
/////////////////////////// SIGNAL FOR STRATEGY /////////////////////////
Signal = buy ? 1 : sell ? -1 : 0
plot(Signal, title='🔌Connector🔌', display = display.data_window)
Basically, I identified my buy, sell conditions in the code and added this at the bottom of my indicator code
Signal = buy ? 1 : sell ? -1 : 0
plot(Signal, title="🔌Connector🔌", transp=100)
Important Notes
🔥 The Strategy Template expects the value to be exactly 1 for the bullish signal, and -1 for the bearish signal
Now you can connect your indicator to the Strategy Template using the method below or that one
Step 2: Connect the connector
1) Add your updated indicator to a TradingView chart
2) Add the Strategy Template as well to the SAME chart
3) Open the Strategy Template settings and in the Data Source field select your 🔌Connector🔌 (which comes from your indicator)
From then, you should start seeing the signals and plenty of other stuff on your chart
🔥 Note that whenever you'll update your indicator values, the strategy statistics and visual on your chart will update in real-time
Settings
- Color Candles: Color the candles based on the trade state ( bullish , bearish , neutral)
- Close positions at market at the end of each session: useful for everything but cryptocurrencies
- Session time ranges: Take the signals from a starting time to an ending time
- Close Direction: Choose to close only the longs, shorts, or both
- Date Filter: Take the signals from a starting date to an ending date
- Set the maximum losing streak length with an input
- Set the maximum winning streak length with an input
- Set the maximum consecutive days with a loss
- Set the maximum drawdown (in % of strategy equity)
- Set the maximum intraday loss in percentage
- Limit the number of trades per day
- Limit the number of trades per week
- Stop-loss: None or Percentage or Trailing Stop Percentage or ATR - I'll add shortly multiple options for the trailing stop loss
- Take-Profit: None or Percentage or ATR - I'll add also a trailing take profit
- Risk-Reward based on ATR multiple for the Stop-Loss and Take-Profit
Special Thanks
Special thanks to @JosKodify as I borrowed a few risk management snippets from his website: kodify.net
Best
Dave

Davin's 10/200MA Pullback on SPY Strategy v2.0Strategy:
Using 10 and 200 Simple moving averages, we capitalize on price pullbacks on a general uptrend to scalp 1 - 5% rebounds. 200 MA is used as a general indicator for bullish sentiment, 10 MA is used to identify pullbacks in the short term for buy entries.
An optional bonus: market crash of 20% from 52 days high is regarded as a buy the dip signal.
An optional bonus: can choose to exit on MA crossovers using 200 MA as reference MA (etc. Hard stop on 50 cross 200)
Recommended Ticker: SPY 1D (I have so far tested on SPY and other big indexes only, other stocks appear to be too volatile to use the same short period SMA parameters effectively) + AAPL 4H
How it works:
Buy condition is when:
- Price closes above 200 SMA
- Price closes below 10 SMA
- Price dumps at least 20% (additional bonus contrarian buy the dip option)
Entry is on the next opening market day the day after the buy condition candle was fulfilled.
Sell Condition is when:
- Prices closes below 10 SMA
- Hard stop at 15% drawdown from entry price (adjustable parameter)
- Hard stop at medium term and long term MA crossovers (adjustable parameters)
So far this strategy has been pretty effective for me, feel free to try it out and let me know in the comments how you found :)
Feel free to suggest new strategy ideas for discussion and indicator building

RSI + MA, LinReg, ZZ (HH HL LH LL), Div, Ichi, MACD and TSI HistRelative Strength Index with Moving Average, Linear Regression, Zig Zag (Highs and Lows), Divergence, Ichimoku Cloud, Moving Average Convergence Divergence and True Strength Index Histogram
This script is based on zdmre's RSI script, I revamped a lot of things and added a few indicators from ParkF's RSI script.
Disable Labels in the Style tab and the histogram if you don't enlarge the indicator and it seems too small.
Look to buy in the oversold area and bounce of the support of the linear regression.
Look to sell in the overbought area and bounce of the resistance of the linear regression.
Look for retracement to the moving average or horizontal lines, and divergences for potential reversal.
RSI
The Relative Strength Index (RSI) is a well versed momentum based oscillator which is used to measure the speed (velocity) as well as the change (magnitude) of directional price movements.
Moving Average
Moving Average (MA) is a good way to gauge momentum as well as to confirm trends, and define areas of support and resistance.
Linear Regression
The Linear Regression indicator visualizes the general price trend of a specific part of the chart based on the Linear Regression calculation.
Zig Zag (Highs and Lows)
The Zig Zag indicator is used to identify price trends, and in doing so plots points on the chart to mark whenever prices reverse by a larger percentage point than a predetermined variable or marker.
Divergence
The divergence indicator warns traders and technical analysts of changes in a price trend, oftentimes that it is weakening or changing direction.
Ichimoku Cloud
The Ichimoku Cloud is a package of multiple technical indicators that signal support, resistance, market trend, and market momentum.
MACD and TSI Histogram
MACD can be used to identify aspects of a security's overall trend.
The True Strength Index indicator is a momentum oscillator designed to detect, confirm or visualize the strength of a trend.

RSI TrendRSI Hull Trend is a hybrid indicator with RSI of HULL Signal. The Hull MA is combined with RSI to see if the Hull MA Buy/Sell Signal is in overbought or oversold condition. Buy Sell Signals are plotted based on settings of OB/OS or RSI. This indicator is very useful to see if the Trend is in Exhaustion or Beginning of a Trend. Entry and Exit conditions can be more precise based on OB/OS condition of price action. In addition normal RSI trend is plotted with trend color from Hull MA. Best Performance with Heiken Ashi Candles.
OB/OS Settings provided
Hull Buy/Sell Signals plotted
Double RSI FAST and DEFAULT signal with crossover
Bar Color applied based on Hull RSI Trend
Hull Trend + RSI + Price Action

Trade HourThis script is just finds the best hour to buy and sell hour in a day by checking chart movements in past
For example if the red line is on the 0.63 on BTC/USDT chart it mean the start of 12AM hour on a day is the best hour to buy (all based on
It's just for 1 hour time-frame but you can test it on other charts.
IMPORTANT: You can change time Zone in strategy settings.to get the real hours as your location timezone
IMPORTANT: Its for now just for BTC/USDT but you can optimize and test for other charts...
IMPORTANT: A green and red background color calculated for show the user the best places of buy and sell (green : positive signal, red: negative signals)
settings :
timezone : We choice a time frame for our indicator as our geo location
source : A source to calculate rate of change for it
Time Period : Time period of ROC indicator
About Calculations:
1- We first get a plot that just showing the present hour as a zigzag plot
2- So we use an indicator ( Rate of change ) to calculate chart movements as positive and negative numbers. I tested ROC is the best indicator but you can test close-open or real indicator or etc as indicator.
3 - for observe effects of all previous data we should indicator_cum that just a full sum of indicator values.
4- now we need to split this effects to hours and find out which hour is the best place to buy and which is the best for sell. Ok we should just calculate multiple of hour*indicator and get complete sum of it so:
5- we will divide this number to indicator_cum : (indicator_mul_hour_cum) / indicator_cum
6- Now we have the best hour to buy! and for best sell we should just reverse the ROC indicator and recalculate the best hour for it!
7- A green and red background color calculated for show the user the best places of buy and sell that dynamically changing with observing green and red plots(green : positive signal, red: negative signals) when green plot on 15 so each day on hour 15 the background of strategy indicator will change to 15 and if its go upper after some days and reached to 16 the background green color will move to 16 dynamically.

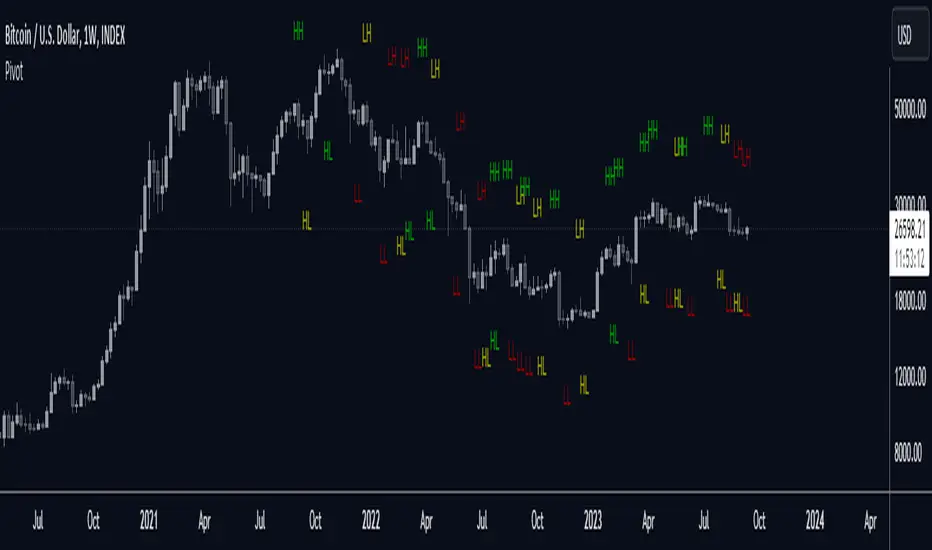
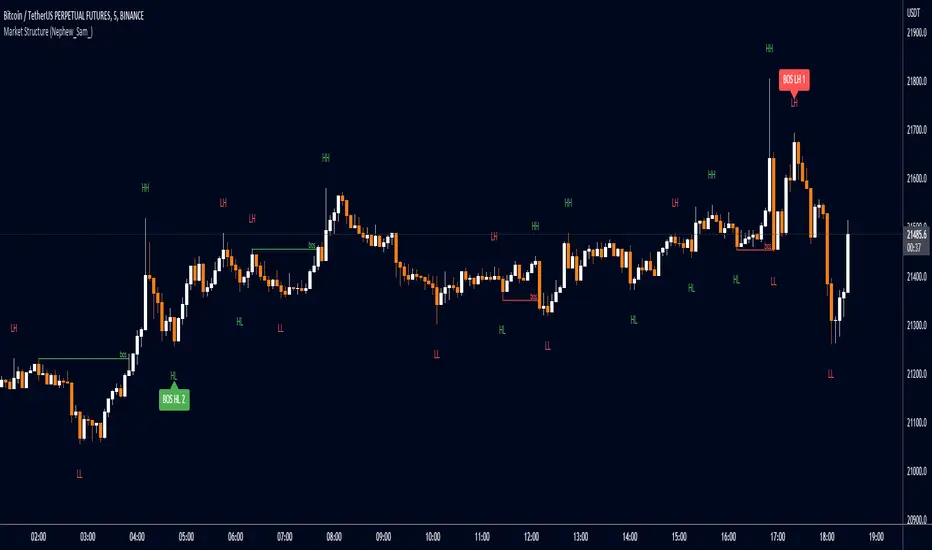
Market Structure Patterns (Nephew_Sam_)This market structure indicator plots HH/LL labels with a little twist - it can identify upto 14 custom patterns of your choice!
Indicator settings:
Pivot strength - highest or lowest point in a number of x left+right bars
Show - show zigzag lines, HHLL labels, Pattern Matches
Patterns - upto 14 patterns (7 bear, 7 bull) with custom label text
Styles - for labels and lines
Disclaimer
- Although 90% of this indicator is custom coded, I have to give credits to LonesomeTheBlue (www.tradingview.com) for his "Double Zig Zag with HHLL" indicator where I got the logic on how to plot the labels in real time.
- This indicator repaints labels in realtime (not historical candle)
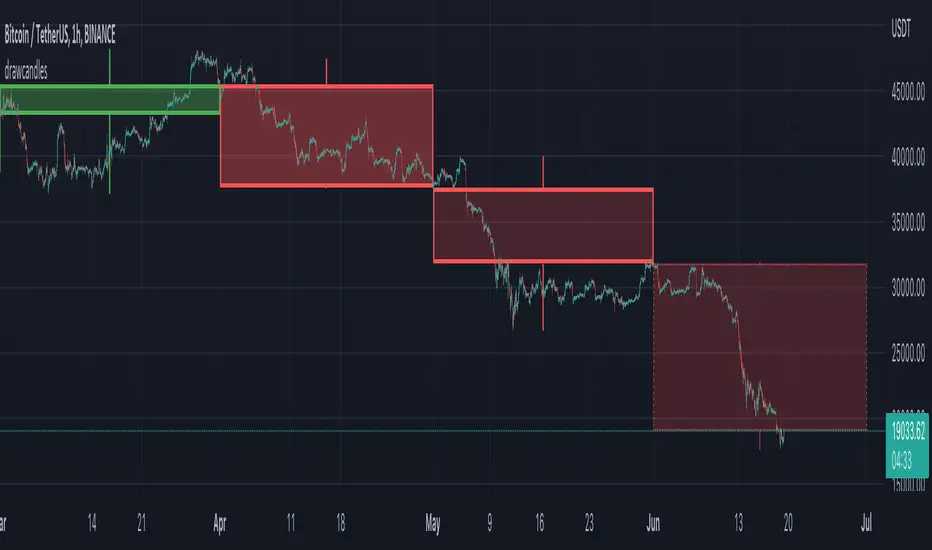
drawcandlesLibrary "drawcandles"
simple utility to draw different candles using box and lines. Quite useful for drawing candles such as zigzag candles or MTF candles
draw(o, h, l, c, oBar, cBar)
draws candles based on ohlc values
Parameters:
o : Open Price
h : High Price
l : Low Price
c : Close Price
oBar : Open Time
cBar : Close Time
Returns: void
.b pin-up symbolWhen trading cryptocoins, it is necessary to check the price trend of NASDAQ, BTC.D, BTC.OI, BTC spot or other coins of similar groups.
However it is very cumbersome to put a comparison symbol in the Tradingview chart and combine individual indicators one by one.
Moreover even with such a combination, the chart is messy and visibility is not good.
This script was developed as a composite-solution to that situation, and will make you happy.
- NQ1!, USTECH100CFD | symbol fixed
- BTC.Dominance, BTC.OpenInterest, BTC symbol, others pin-up-symbol | selectable
- Pin-up-symbol | selectable
- Pin-up-symbol's candle chart
- Trending
* EMA 9,21,50,200 ribbon classic EMA
* .b price line ; .b price = unique trending price with price-action + relative-volume-action + ATR
* Dynamic S/R Cloud ; BB + donchian band + high/low + atr mixed custom-logic
* VWWMA + .b price Shadow ; Volume-weighted WMA on .b price = unique MA faster than classic VWMA
Trending shadow direction is not bad even on low-timeframe (1, 2, 3, 5m, 15m...)
- Pattern
* Harmonic Pattern ; A simplified version of the harmonic pattern indicator, simply show-up pattern complete position
for reference only - adopted from HeWhoMustNotBeNamed's script.
- Information Panel
* BTC Dominance, BTC Open Interest, Pin-Up-Symbol price
* Trend meter ; 5,15,30,1h,2h,4h Meter Calc with 1 minute-timeframe candles
5 = Green if the current price is higher than the price 5 minutes ago.
1h = Green if the current price is higher than the price 2 hours ago.
4h = Red if the current price is lower than the price 4 hours ago.
* caution ; To use real-time chart of "CME_MINI:NQ1!" you have to additional subscribe CME data,
default setting is 'NQ1!' , you can change to 'USTECH100CFD'
* When you choose symbol which is closed trading hours, the script's update stopped.
Even if the selected pin-up-symbol is on trading hours, the currently selected symbol's chart doesn't update.
* recommended | chart setting > Appearance : Top margin 0%, Bottom margin 0% for optimized screen usage :)
if you have any questions freely contact to me by message on tradingview, or telegram @sr_bt
but please understand that responses may be quite late.
------------------------------------------------------------------------------------------------------------------------------------------------------------
copyright 2022 (sr_b)
Special thanks to all of contributors of community.
The script (originaly .b) may be freely distributed under the MIT license.
The other classic script code also may be freely distributed under the MIT license.
Simplified Harmonic script part | core adopted from 'Multi ZigZag Harmonic Patterns (HeWhoMustNotBeNamed)' MPL2.0 license

Smarter SNR (Support and Ressistance, Trendline, MTF OSC)Built with love "Smarter SNR (Support and Ressistance, Trendline, MTF OSC) "
This indiator will show you Support & Ressistance, Good Trendline, and Multi-timeframe analyzing of Oscillator (Stochastic and RSI)
You can combine with your own strategy, or use this purely
DISCLAIMER :
Measure the risk first before use it in real market
Backtest The Strategy was very important, so you know the probability
Fundamentally Logical :
SNR -> Last 3 Zigzag Pivot
Trendline -> Using two last pivot for calculating the slope
Features :
1. SNR
2. Trendline
3. MTF Oscillator Analyzing
How to use it :
1. All Label, Table & Line can be turned on/off in settings
2. Pivot Period can be Adjusted in settings
3. All Label, Table & Line style can be adjusted in settings
Regards,
Hanabil

investor_EMA Three-CrossI produced a strategy using short term ema intersections.
A short-term low capital buy signal creates a yellow background after the red background color. Here, profit should be taken by following the trend.
When the green background is formed, positions can be increased, the price will lead us to a safer market.
Exposures can be turned off in the formation of a red background.
The pink zigzag average always shows the Weekly ma9. Price should be followed above the MA9 weekly average which will allow us to see medium term positive price movements.
As a result, the background colors will present a more understandable graph in price movements up and down movements.
The above strategy will generate signals as long and short.
You can make the coloring you want from the settings section.

Riles' RotationThis indicator is built off of the 1 hour time frame. I used the ZigZag indicator to get 500 data points on BTC since last april, ruling out <2% deviations in price. Taking those percentages, I ran them through an excel sheet and found which deviations were the most common. An up/down relationship I will call a rotation, there are 250 rotations derived from the 500 points of data. Thus, this indicator is based off of a 250 EMA. Each band is a common deviation on the 1 hour time frame, as indicated by an excel generated histogram. The common deviations also appear relevant on the daily timeframe for BTC. This demonstrates potential support and resistance, as well as potential mean reversion. Do not take trades blindly based off of it. It merely shows potential support and resistance based off of historical percentage deviations from the 250 EMA.

Price ActionFirst, you have to know price action, RTM price action Handbook could help you
this indicator shows you base and momentum candles
base candles could be zones of trade that show you fighting of bulls and bears, and momentum candles could show the power of those zones.
Base candles are white in the chart, and you can place your order at the good zone.
Rally candles and drop candles are momentum candles, and bold rally and bold drop show that it is more powerful than its before candle.
Zigzag compression is one way that shows the compression in trend.
it looks like the Wedges pattern at classic technical that shows pending orders are closed, so the target zone could be powerful to reverse the trend.
Black background of candle means that candle doesn't reach its before candle and so it is poor candle, I named it domination.
It is better to do not trade at poor candles.
At the end, I find Price action the best way to trade, and it makes you free of other indicator, even volume indicator.
This indicator is good for those who use price action strategy to trade and those who want to learn the price action.
It could be so helpful and reliable way to find the zones, and place buy or sell order and the target, specially for scalping.

Auto Fib Time Zones and Trend-Based Fib Time by DGTFibonacci time zones, based on the Fibonacci number sequence, are vertical lines that represent potential areas where a swing high, low, or reversal could occur.
Trend-Based Fib Time shows probable price corrections in an existing trend. A useful tool to use in addition to Elliot Wave counting, Fib Time helps to identify how far the wave is likely to travel
Please note, Time zones aren't concerned with price, only time
Disclaimer :
Trading success is all about following your trading strategy and the indicators should fit within your trading strategy, and not to be traded upon solely
The script is for informational and educational purposes only. Use of the script does not constitute professional and/or financial advice. You alone have the sole responsibility of evaluating the script output and risks associated with the use of the script. In exchange for using the script, you agree not to hold dgtrd TradingView user liable for any possible claim for damages arising from any decision you make based on use of the script
