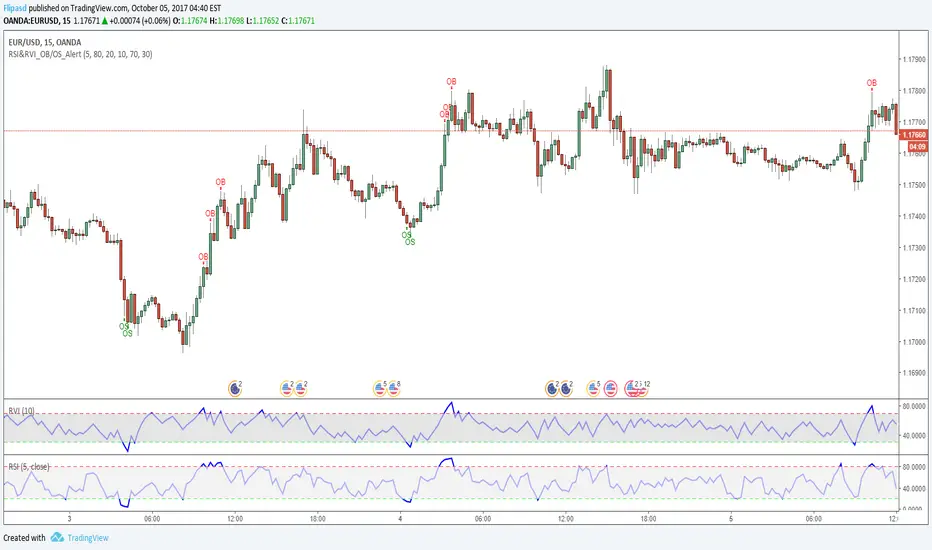
RSI & RVI OB/OS Alert ArrowThe script shows arrows on bars that are in overbought or oversold, based on the set parameters of Relative Strength Index ( RSI ) and Relative Volatility Index (RVI).
Also there is a universal allert, which includes both conditions - overbought and oversold.
You can change the period of RSI and RVI, as well as the upper and lower boundaries of these indicators.
Search in scripts for "天铭科技RSI指标状态"
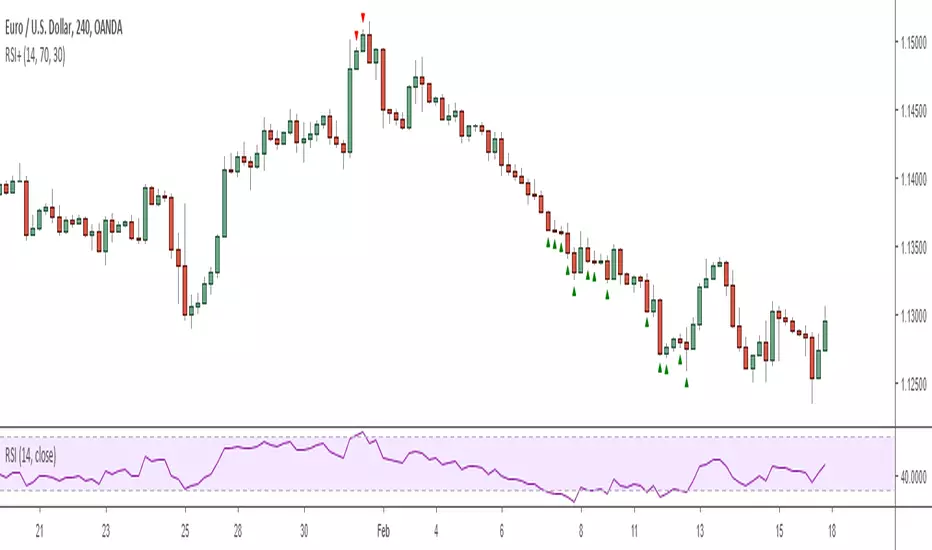
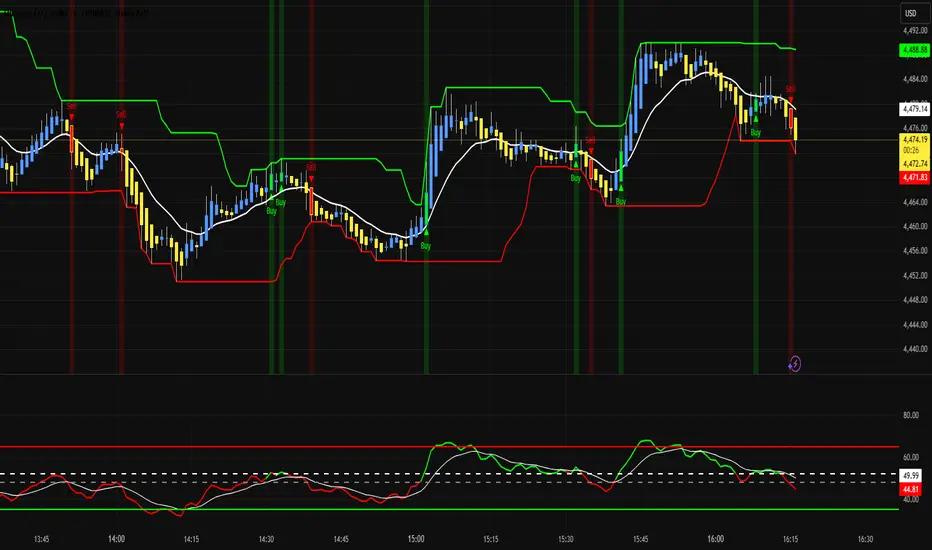
rsi+ichmokunssoholik learned this idea and i made it in TV.
the thick line is RSI.
thin lines are from ichmoku standard(base), turning
sell when the RSI color changed to red(or yellow)
buy when the RSI color changed red to green(or yellow)
-----------
nssoholik 님의 요청으로 만들었습니다.
두꺼운 선의 색이 변하는 순간에 매매하는 것입니다. 녹색으로 변해갈때 사고, 빨강으로 변해갈 때 팝니다.

RSI+ Overbought/Sold IndicatorThis is a very simple script that plots signals on the chart whenever the RSI crosses the given threshold. Nothing fancy, but it is useful for deciding when to exit trades or prepare for pullbacks or for confirming that the market is currently in the middle of an extremely impulsive move or trend. It has alert functionality and you can set the overbought/sold thresholds and RSI length in the options menu.
Note: I definitely wouldn't recommend using it to enter trades unless you're an experienced counter-trend trader :)
Regards -
Matt.
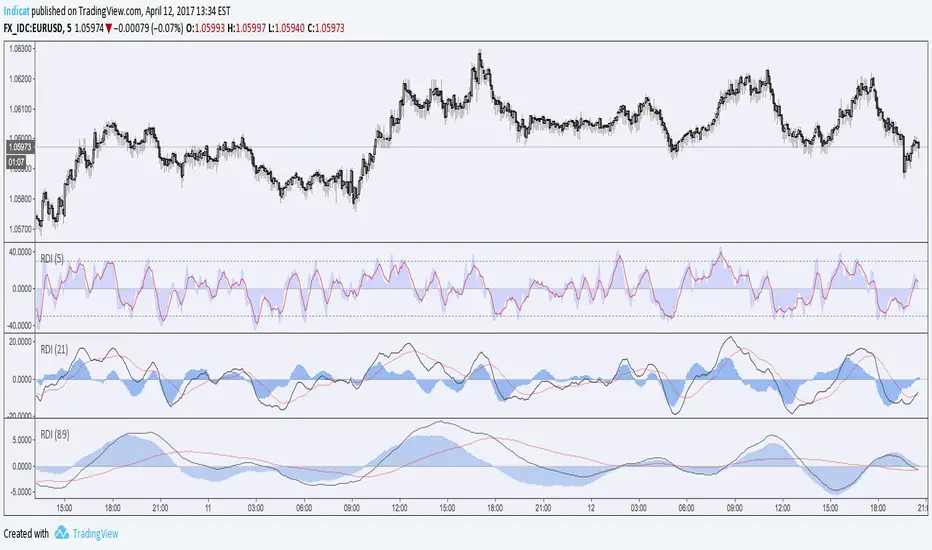
RSI featuring MACD on the Relative Divergence IndexHello Traders,
This Indicator uses RSI output to form a MACDish type of indicator.
Raw RSI output is smoothed with a linear regression curve to form the indicator line.
The signal line is a simple moving average of the same output, the histogram or momentum is the difference between the signal and indicator line, just as MACD
The outer level lines are switched off in MACD modus, because they will 'compress' this indicator, removing them also allows the zero line to 'float'
If you change the length of this indicator you also have to re-adjust the outer level lines, if used.
I recommend this indicator especially on higher lengths (55 or 89) in so you won't get whipped out by a early cross-over or 'false' divergence.
Cheers Indicat...
RSI-DEMA Kurat : Double DEMA of Heiken Ashi RSIThe 2 DEMA represent the RSI based on Heiken Ashi candles.
Current settings has been designed for BTC and long position only, you open on the cross up (green background) and you close on the cross down (red background)
Obviously, you can play with the settings and the timeframes.
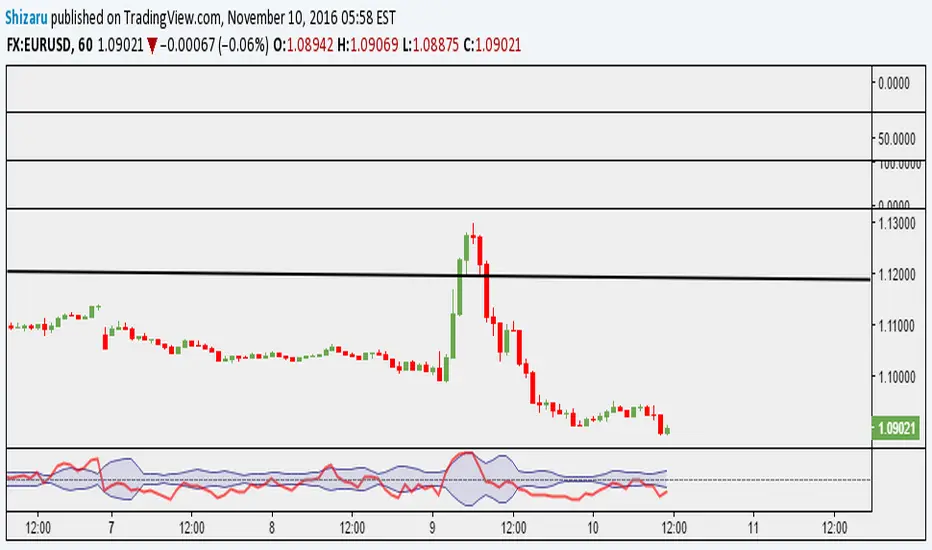
RSI Self-adjusting bandsThe original script was posted on ProRealCode by user pepkatapet.
RSI modified so that the bands are adjustable to volatility, is similar to Blai5 indicator (Advanced RSI with BV).

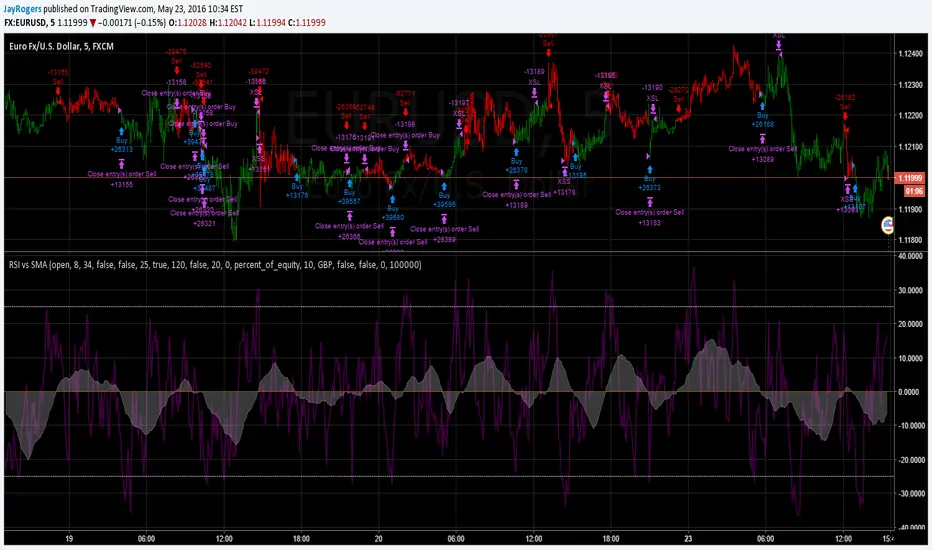
RSI versus SMA (no repaint)*** USE AT YOUR OWN RISK ***
Nothing is perfect, and all decisions by you are on your own head. And stuff.
Description:
It's RSI versus a Simple Moving Average.. Not sure it really needs much more description.
Should not repaint - Automatically offsets by 1 bar if anything other than "open" selected as RSI source.
...sometimes smashing things together just happens to work...
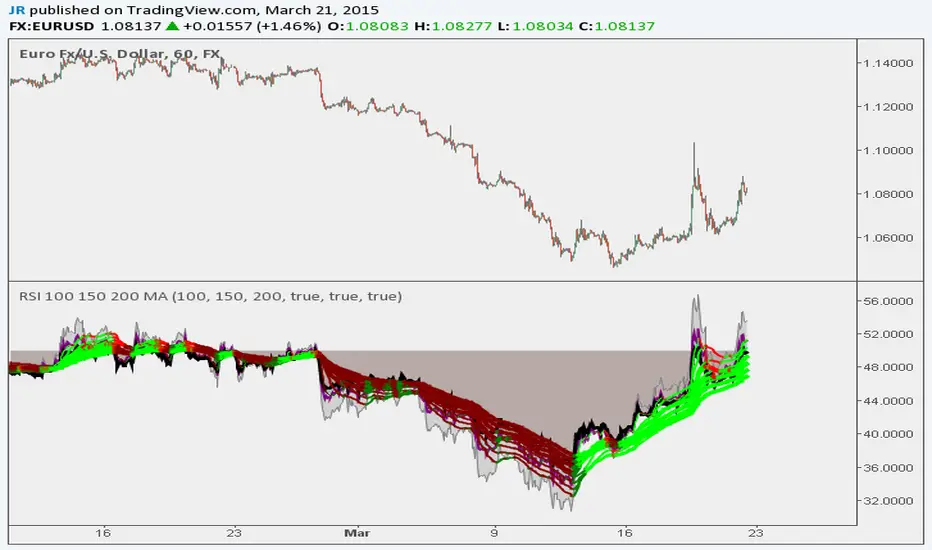
RSI 100 150 200 MA Ribbon
Following Trends and Finding Divergences
Here is a script example that uses a long length (100, 150, 200) RSI MA Ribbon to detect trend reversals using lower time frames. You can also use traditional RSI to find divergences.
Built Best for 1H to 10 Min Charting
BTCUSD
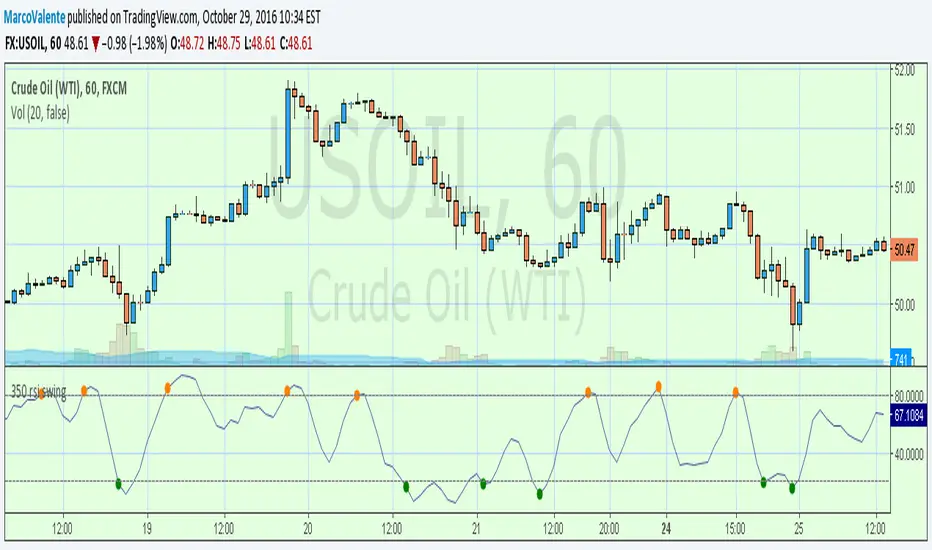
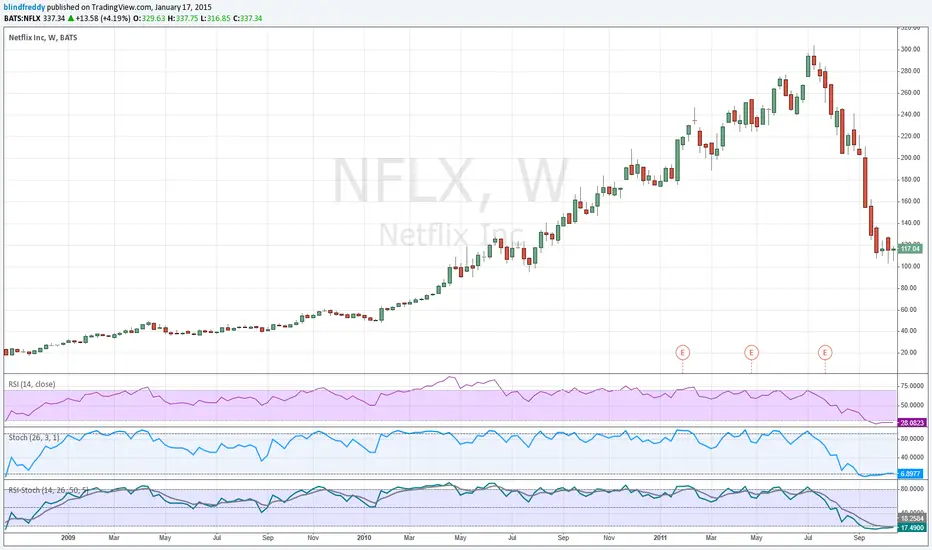
RSI-Stochastic Hybrid v2**For those who like a smooth ride...v2 of this script is now updated with optional exponential averaging of the stochastic and RSI. So for instance a value of 3 for smoothing of the stochastic is like using %D instead of %K. **
This is a very simple idea - an average of RSI and the Stochastic Oscillator. However it offers plenty of flexibility for tuning to your requirements. You can change the lengths of either indicator and the weighting of each. By default it's set to 50/50 (just change the percent RSI to adjust). There is also an optional EMA which can be used as a signal line.
This idea comes from Greg Morris who likes to use it for trend following. I would buy when the indicator hits the overbought line and sell when it goes below 50.

RSI-Stochastic HybridThis is a very simple idea - an average of RSI and the Stochastic Oscillator. However it offers plenty of flexibility for tuning to your requirements. You can change the lengths of either indicator and the weighting of each. By default it's set to 50/50 (just change the percent RSI to adjust). There is also an optional EMA which can be used as a signal line.
This idea comes from Greg Morris who likes to use it for trend following. I would buy when the indicator hits the overbought line and sell when it goes below 50.
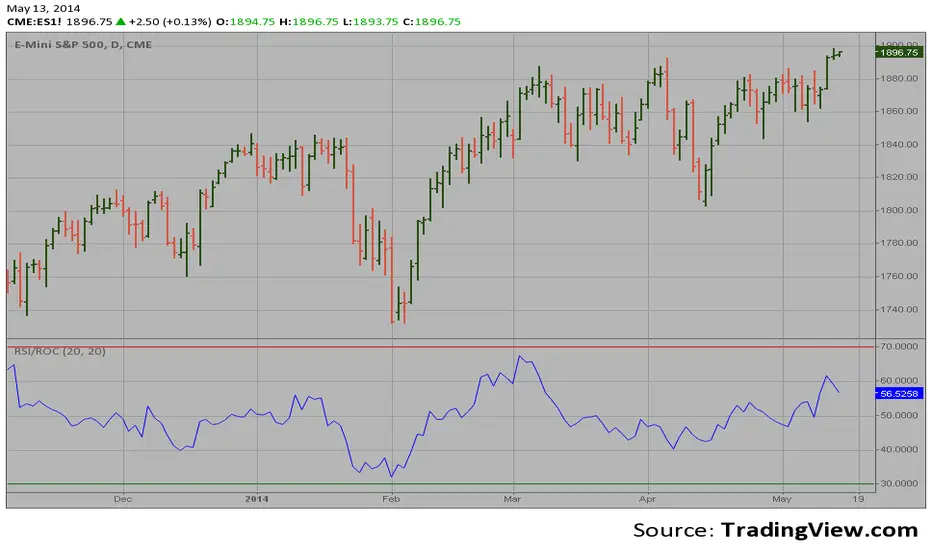
RSI based on ROC This is the new-age indicator which is version of RSI calculated upon
the Rate-of-change indicator.
The name "Relative Strength Index" is slightly misleading as the RSI
does not compare the relative strength of two securities, but rather
the internal strength of a single security. A more appropriate name
might be "Internal Strength Index." Relative strength charts that compare
two market indices, which are often referred to as Comparative Relative Strength.
And in its turn, the Rate-of-Change ("ROC") indicator displays the difference
between the current price and the price x-time periods ago. The difference can
be displayed in either points or as a percentage. The Momentum indicator displays
the same information, but expresses it as a ratio.
RSI with KAMA and Custom Buy/Sell SignalsUses Kaufman MA on the RSI to generate signals when crossing user thresholds

RSI Price overlay on chartThie Indicator plots buy and sell signals on the chart using the 28 period RSI with overbought areas at 65 and oversold at 35
RSI-MACD-trade"Strategic trading strategy using RSI and MASCD
Highest returns when applied to weekly charts"
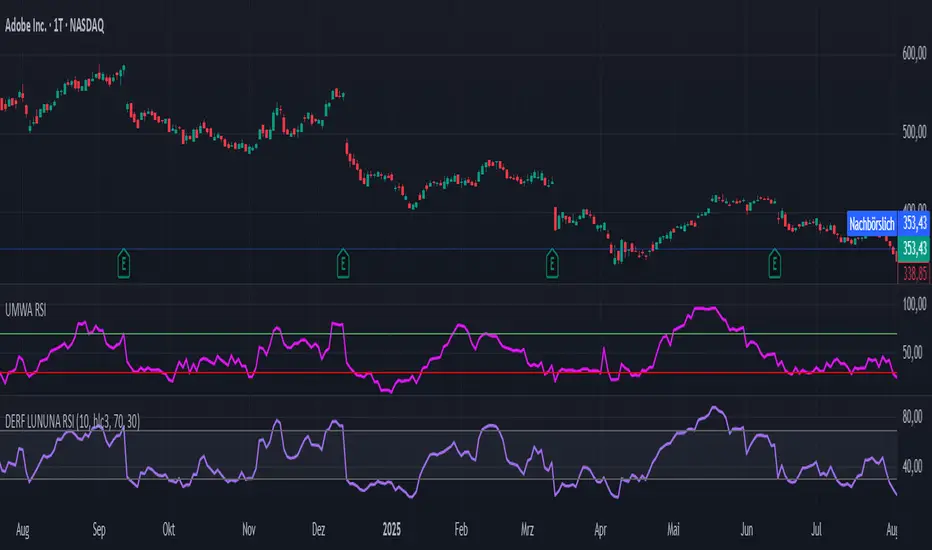
DERF LUNUNA RSIRSI for my needs. I adjusted it for my own trading habits. If you are interested feel free to use it.
RSI Diode PanelA small and clean RSI panel that simultaneously shows the 15m, 30m, 1h, 2h, 4h, and 1d timeframes, which can help you with basic trend orientation.

RSI (14) with Auto Zone Colors — Overbought/Oversold HighlighterThis indicator plots the Relative Strength Index (RSI 14) with dynamic color changes for instant visual clarity:
✅ Green line in overbought zone (≥70)
✅ Red line in oversold zone (≤30)
✅ White line in neutral range (30–70)
Includes reference lines at 70, 50, and 30 for quick decision-making. Perfect for spotting momentum extremes, divergences, and potential reversal points without squinting at numbers. Works on any timeframe.


RSI Custom ADX VWAP Swing Signals Anmol Singh point.Anmol Singh
This indicator combines RSI, a custom ADX, VWAP, and Swing High/Low Break signals to identify potential buy and sell opportunities. It provides visual signals and alerts, helping traders spot trends and reversals more effectively on NASDAQ 1-minute charts.
