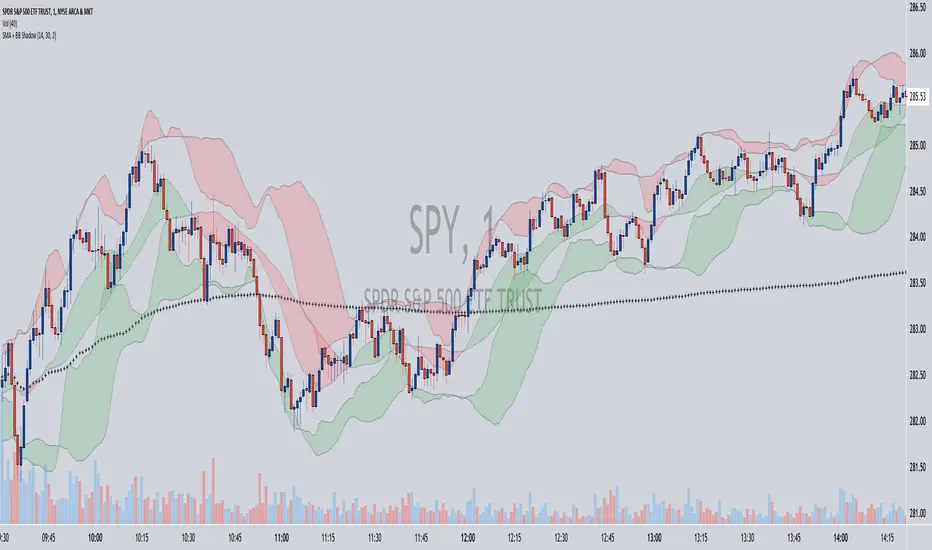
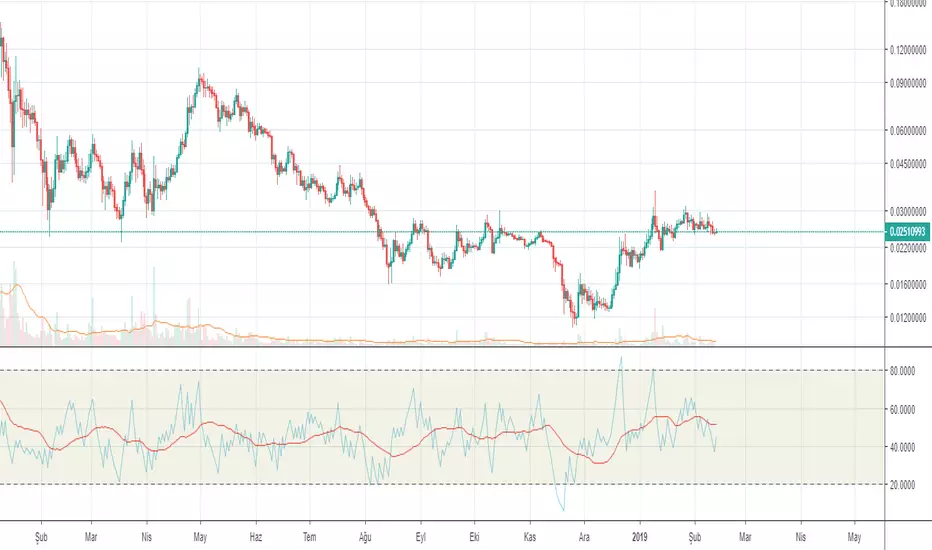
14/30 SMA Price DivergencePrice divergence from 14 and 30 SMA, identify overbought + oversold conditions
Search in scripts for "收集一只股票30个交易日的成交量、开盘价、最高价和最低价和收盘价"

CPR by Anand with PDL/PDH & Breakouts 15/30 minsThis is an enhanced version of CPR by Anand with Configurable previous day high and low and option to configure breakout lines of 15 and 30 mins.
Will be an useful tool for day traders who follows CPR tricks and breakouts.

Superstock 10-30 WMA Band script I was reading Jesse Stine's Insider Buy Superstocks book, and one of the technical traits he mentioned of a superstock (read the book, seriously, very strongly recommended) was a breakout above the 30 weekly moving average. He goes on to mention that after breakout, the 10 WMA often acts as a support line where you can add to your position. This script is inspired by the visual direction of Chris Moody's slingshot system, and how it displays MA's. The skinny line is the 10 WMA and the bigger line is the 30.

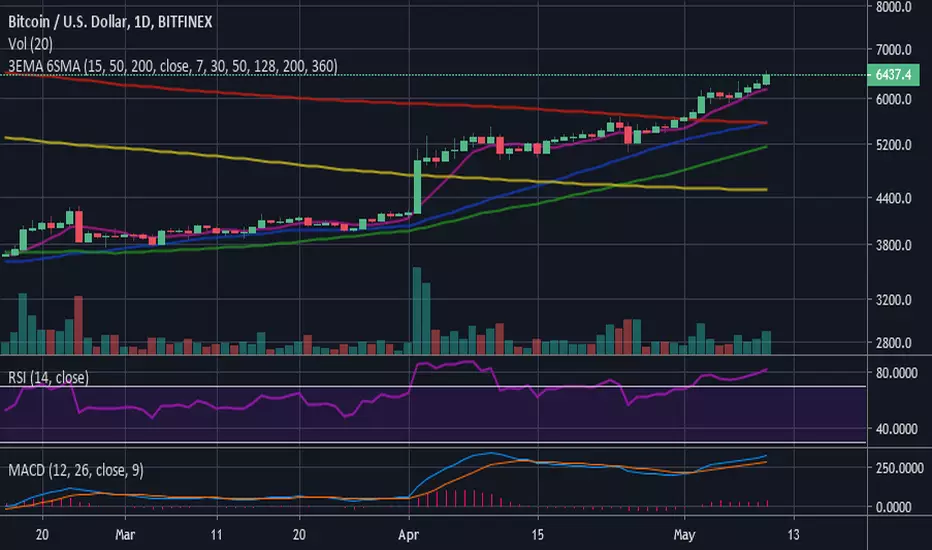
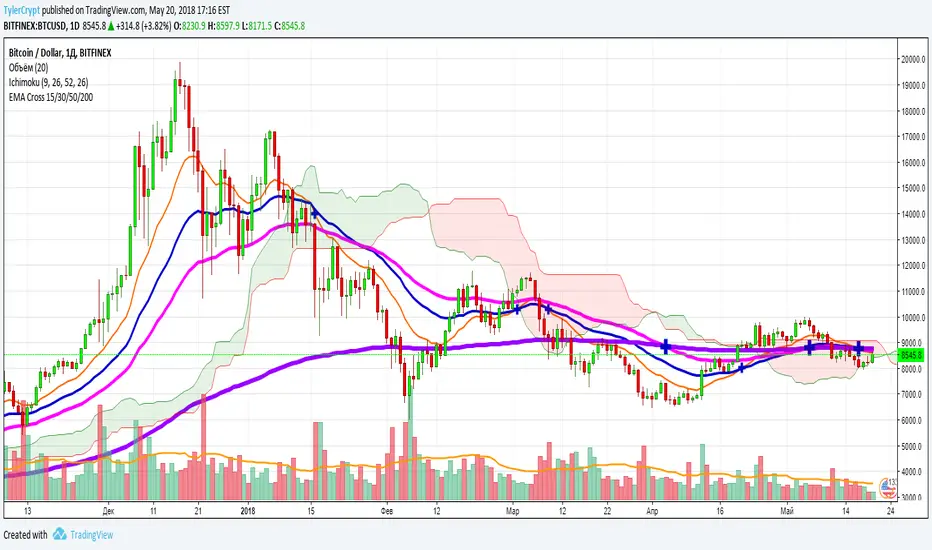
3 EMA (15-50-200) - 6 SMA (7-30-50-128-200-360)3 Moving Average Exponential - 6 Simple Moving Average . Crypto EMA - MA . 7 is a fast support or resistance, 15 confirmation support or resistance. 30 Important support and resistance . 50 institutional support or resistance. 200 institutional general trend, support and resistance , 360 general trend, support and resistance . The use of EMA or MA is according to your liking/trading plan
MA Cross 9 & 30 trend analysisvery good fro a simple trend analysis. 9 and 30 did work for me and I want to share.


EMA 21,55,100,200/SMA 30,200 by Niko
Hi stranger,
This is my script with Exponencial moving average in my scales ( 21,55,100,200) which I use, and Simple moving average (30,200).
Enjoy


COLOUR CODED ULTIMATE OSCILLATOR WITH LEVELS (70/50/30)Just added 70/30/50 levels to @LazyBear 's "Color Coded UO" script.
Happy Trading!

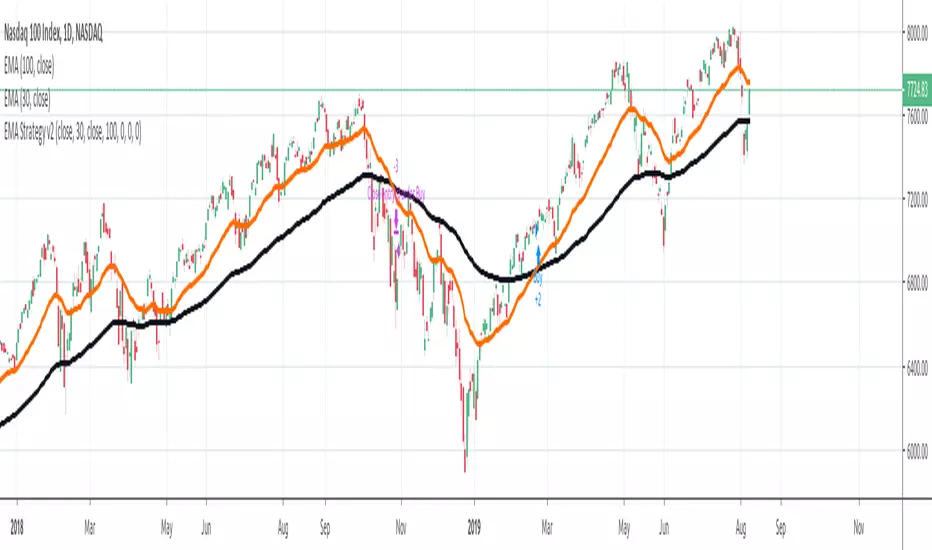
[STRATEGY]EMA 30/60 Cross Strategystrategy based on EMA 30/60 cross
works best on 4hr timeframes & high-midcaps

5 Moving Average Exponential 7-15-30-50-2005 Moving Average Exponential. Crypto EMA. 7 is a fast support or resistance, 15 confirmation support or resistance. 30 Important support and resistance. 50 institutional support or resistance. 200 general trend, support and resistance.

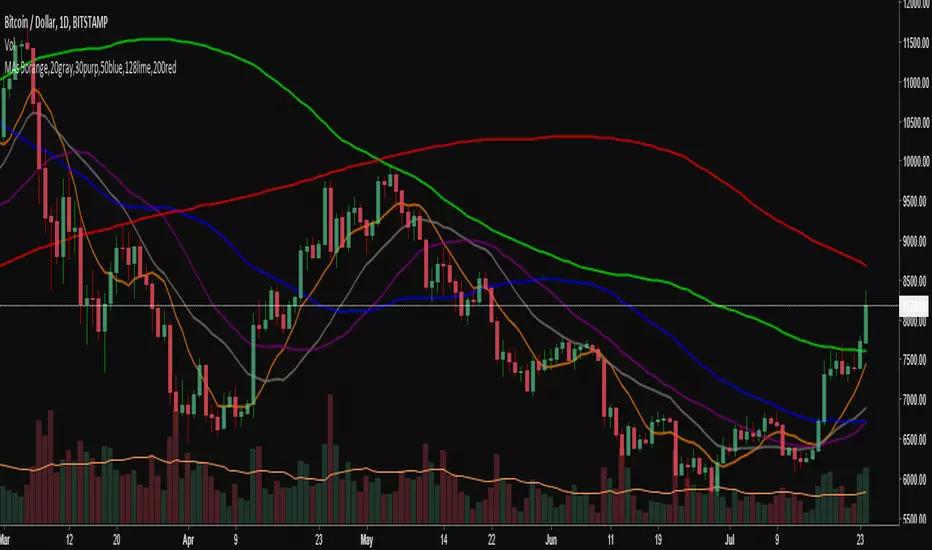
6 SMA's (fit to BTC) 9,20,30,50,128,200 (exponential optional)I've been using these for a while trading Bitcoin and I've found them to be the most useful to me. I replaced the 7 you may have seen in the first set with the 9 as I'm seeing it tested across many time frames quite frequently. The least used of the six is the 30 period, but it does have some influence I've found on the large time frames, mainly the weekly.

6 Simple Moving Averages 9,20,30,50,128,200 (bitcoin tested)I've condensed my SMAs down to these 6 and have found them to be most useful for Bitcoin, which is what I trade the most. They all have played their roll in acting as support and resistance and making decisions with the 30 period probably the least relevant, but relevant nonetheless. There is the option to change to exponential if desired.

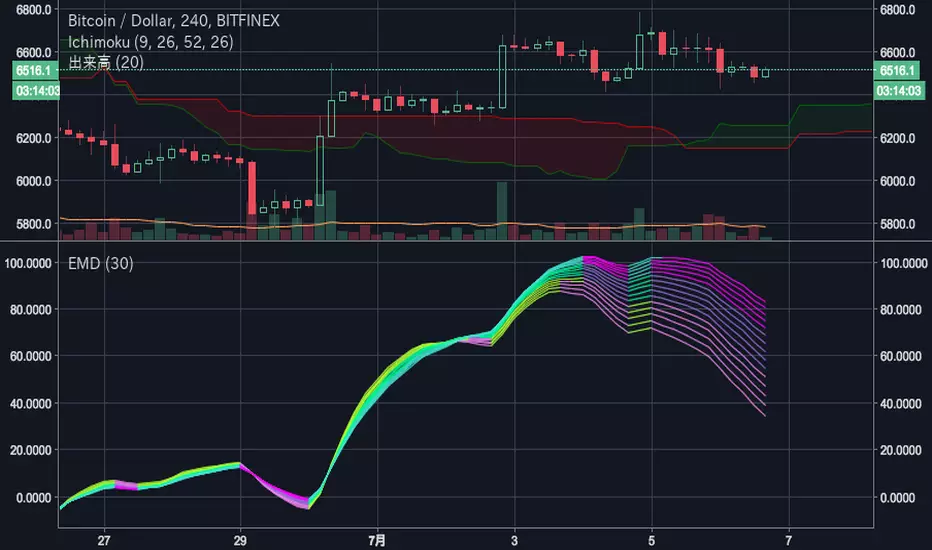
EvaMacD for 30 linesEva Chart calculate IIR Filter with Multiple MACD Histogram and estimate the cycle.
This oscillator can find the most powerful frequency. This use 30 MACD histogram lines tuned for filter.

Simple Moving Averages (7, 30, 50, 100, 200)7, 30, 50, 100, 200 simple moving averages, bundled in one indicator (for users who are using the free TradingView service and can only load limited number of indicators at any given time).
You can turn each moving average on or off at will and change the colors.

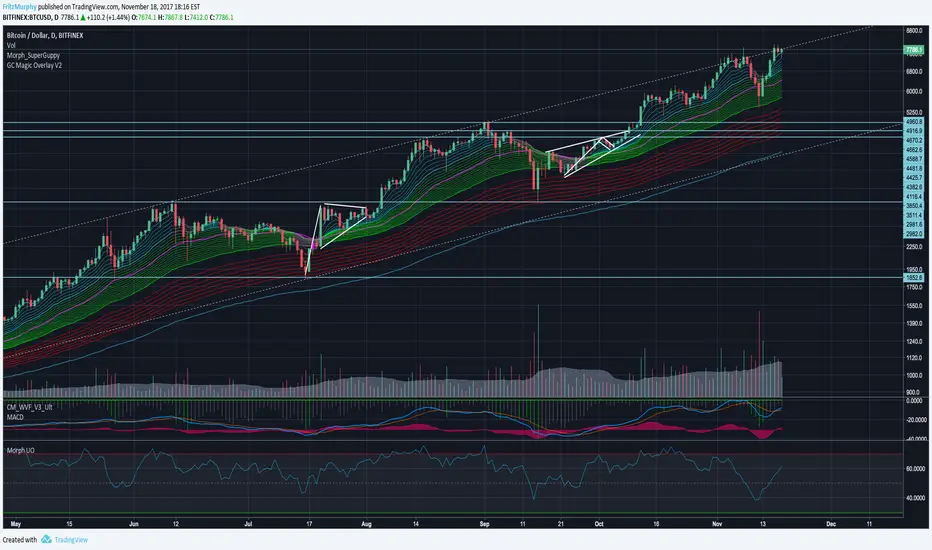
Guppy MMA 3, 5, 8, 10, 12, 15 and 30, 35, 40, 45, 50, 60Guppy Multiple Moving Average
Short Term EMA 3, 5, 8, 10, 12, 15
Long Term EMA 30, 35, 40, 45, 50, 60
Use for SFTS Class

Ultimate Oscillator with 70/30/50 LinesUltimate Oscillator with 70/30/50 lines and a background.
Read how to use it here:
stockcharts.com
Enjoy :)