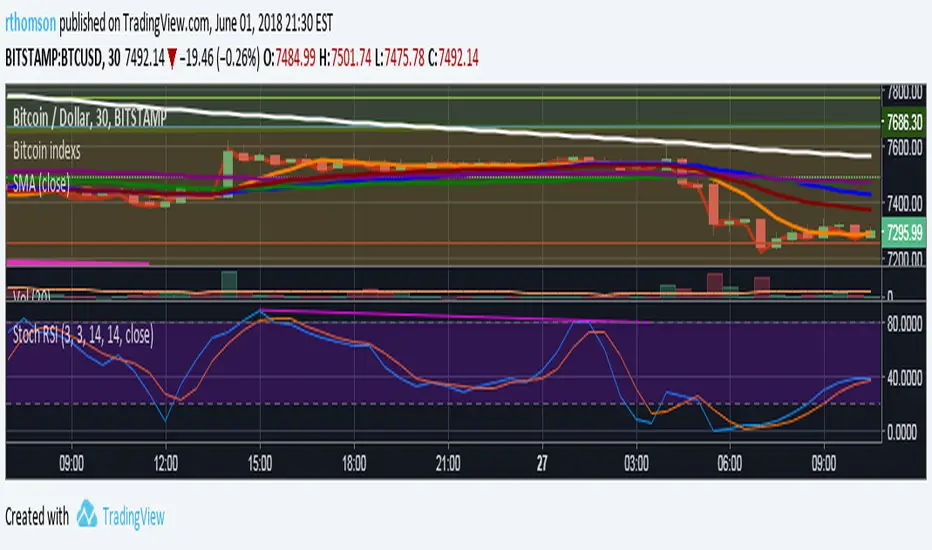
Lysergik's Stochastic SynergyThis indicator shows the average Stochastic RSI output of the 15m, 1h, 2h, 4h, and Daily Stochastic RSI. It will change in its behavior depending on the time-frame you're using, but for many markets it works best on the 30m time-frame and the daily time-frame.
It is best used along with Lysergik's Fib Cross, which will allow you to avoid false signals in the stochastic synergy indicator. If your MA cross (50, 200) indicates a direction change opposite of the stochastic RSI synergy indicator then that is a signal to wait for more price action to determine your entry/exit points.
Using the Lysergik's Fib Cross, the same applies, but remember that a golden cross (white cross symbol) followed directly by a golden ratio cross (gold cross symbol) is even further indication that the stochastic RSI needs more breathing room before reversing.
This indicator is fully adjustable for you to back-test against charts and refine the indicator to your market.
The inputs in respective order are as follows:
RSI Length, Stoch Length, Smooth K, Smooth D, Upper Limit, Lower Limit, Basis
Enjoy and remember only make trades on your own terms.
Happy trading/investing! :)
Search in scripts for "流通市值在50亿至200亿之间的股票中,成交量持续放大的个股有哪些?"

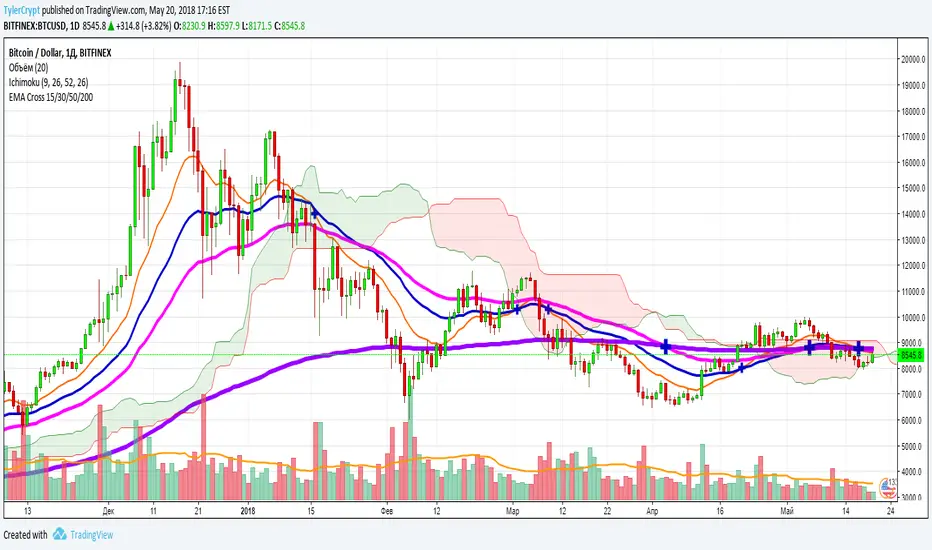
OptionsFanatic_Combo_4SMA_Cloud_BBThis special combo indicator provides following indicators in one..
1. 4 Simple moving averages 5,10,50,200
2. Ichimoku Cloud
3. Bollinger Band

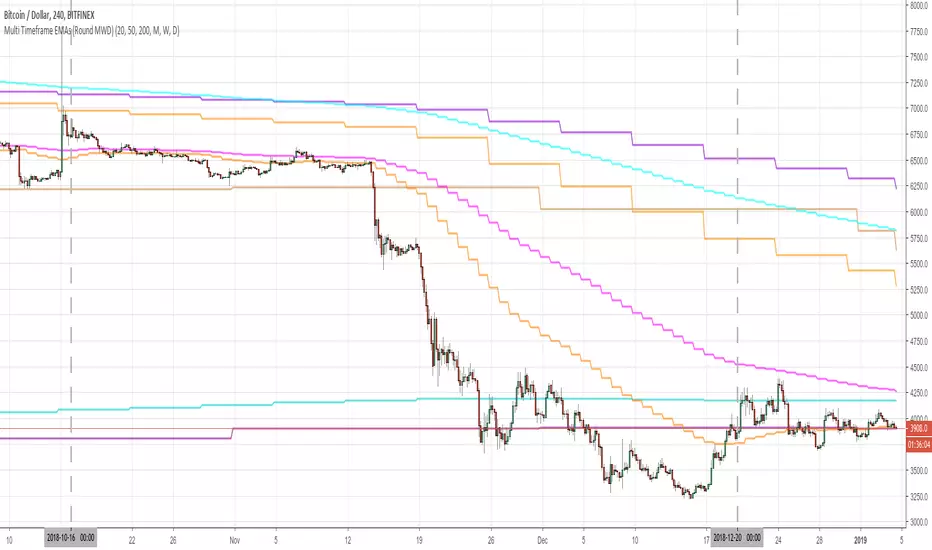
Multi Timeframe EMAs (Round@MWD)plot round number EMAs 20,50,200 on the timeframes monthly, weekly and daily.


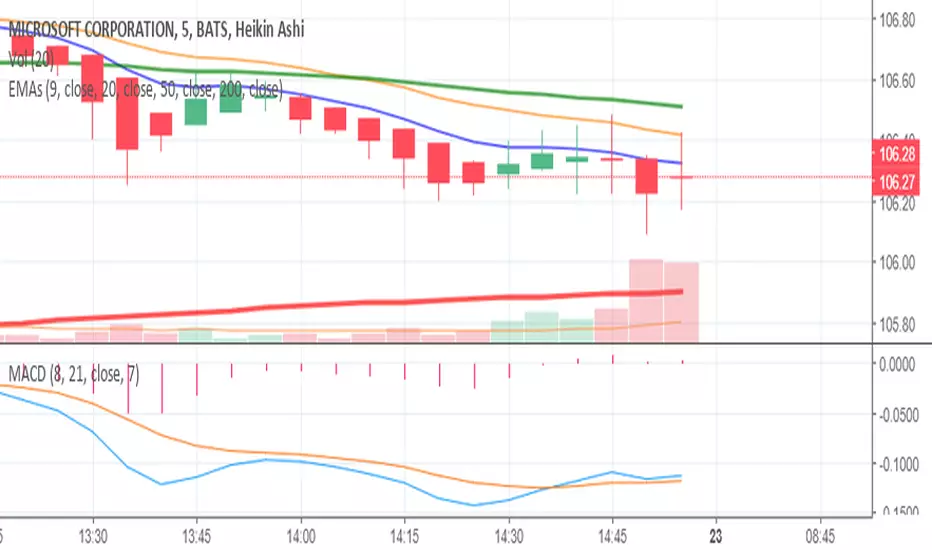
Exponential Moving AveragesCreated by using the Simple Moving Average indicator created by stocksinboxx
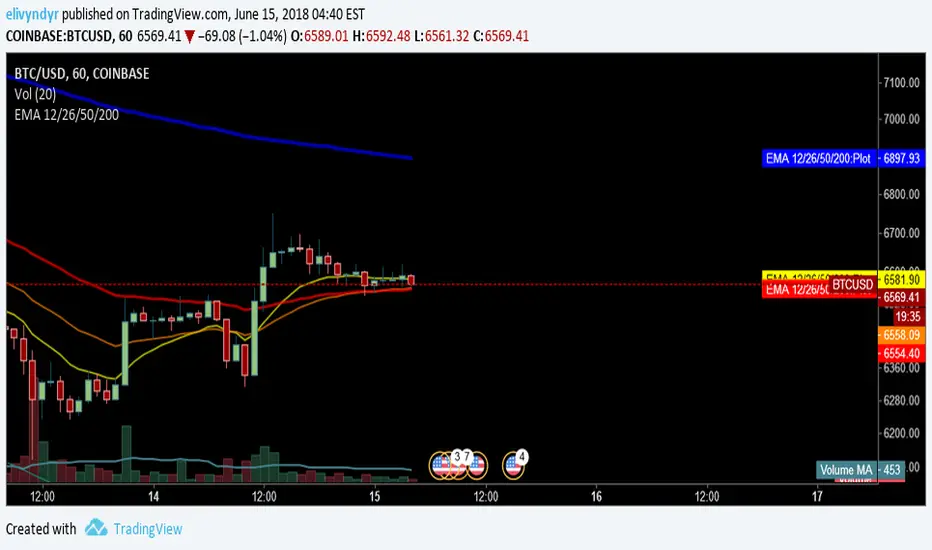
Plots four Exponential Moving Averages on a chart. (9, 20, 50, 200)

MA Cross + KillzonesCombines oscarvs' BTC Killzones with four EMAs and the trader's 13/49 golden cross as well as the investor's 50/200 golden cross. Note that the killzones highlight the first two hours of market action in each of the three main crypto markets, so this time period will have to be adjusted for daylight savings time in April and in November.

SMAMultiple SMA's, 99, 25, 7 (same as on Binance), 50, 200, plus the 20 EMA (same as used on Binance again).


Accumulated volume sumThis indicator calculates market balance for specified periods. It should show if market is bigger or smaller then in the beginning of period. Default periods are 20, 50, 200 and there's no rationale (yet) why should they be like this. I created this script to see if BTC is being manipulated. Please comment if I reinvented a wheel.

XEMAFixed Base 4 EMA
Choose base interval, default Daily
Adjust periods for up to 4 emas, default 9 20 50 200

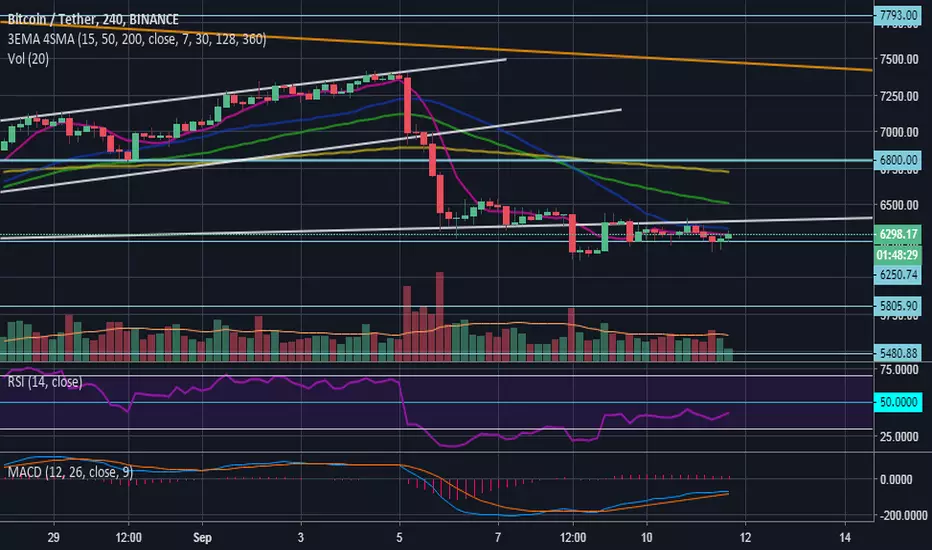
[3EMA]Triple Exponential Moving Averages Crossing Triple lines crossing EMA. 15 50 200 Days , btw period is editable.
//Just copy and edit from


My EA Strategy for 3 minute BOI made an EA for my long term project on Binary Option trading.
TimeFram = 1 minute
Signals are:
Green Spike = Buy (for 3 minutes expiration)
Red Spike = Sell (for 3 minutes expiration)
Strategy:
VMWA (50&200) = Trend Indicators
RSI (30) = pull back entry signal on a strong trend
BackTest = 80% Winning Rate
Improvements Needed:
>> Better Entry Star Signals
>> How to be automatically connected to a certain broker for HFT