Intrabar Efficiency Ratio█ OVERVIEW
This indicator displays a directional variant of Perry Kaufman's Efficiency Ratio, designed to gauge the "efficiency" of intrabar price movement by comparing the sum of movements of the lower timeframe bars composing a chart bar with the respective bar's movement on an average basis.
█ CONCEPTS
Efficiency Ratio (ER)
Efficiency Ratio was first introduced by Perry Kaufman in his 1995 book, titled "Smarter Trading". It is the ratio of absolute price change to the sum of absolute changes on each bar over a period. This tells us how strong the period's trend is relative to the underlying noise. Simply put, it's a measure of price movement efficiency. This ratio is the modulator utilized in Kaufman's Adaptive Moving Average (KAMA), which is essentially an Exponential Moving Average (EMA) that adapts its responsiveness to movement efficiency.
ER's output is bounded between 0 and 1. A value of 0 indicates that the starting price equals the ending price for the period, which suggests that price movement was maximally inefficient. A value of 1 indicates that price had travelled no more than the distance between the starting price and the ending price for the period, which suggests that price movement was maximally efficient. A value between 0 and 1 indicates that price had travelled a distance greater than the distance between the starting price and the ending price for the period. In other words, some degree of noise was present which resulted in reduced efficiency over the period.
As an example, let's say that the price of an asset had moved from $15 to $14 by the end of a period, but the sum of absolute changes for each bar of data was $4. ER would be calculated like so:
ER = abs(14 - 15)/4 = 0.25
This suggests that the trend was only 25% efficient over the period, as the total distanced travelled by price was four times what was required to achieve the change over the period.
Intrabars
Intrabars are chart bars at a lower timeframe than the chart's. Each 1H chart bar of a 24x7 market will, for example, usually contain 60 intrabars at the LTF of 1min, provided there was market activity during each minute of the hour. Mining information from intrabars can be useful in that it offers traders visibility on the activity inside a chart bar.
Lower timeframes (LTFs)
A lower timeframe is a timeframe that is smaller than the chart's timeframe. This script determines which LTF to use by examining the chart's timeframe. The LTF determines how many intrabars are examined for each chart bar; the lower the timeframe, the more intrabars are analyzed, but fewer chart bars can display indicator information because there is a limit to the total number of intrabars that can be analyzed.
Intrabar precision
The precision of calculations increases with the number of intrabars analyzed for each chart bar. As there is a 100K limit to the number of intrabars that can be analyzed by a script, a trade-off occurs between the number of intrabars analyzed per chart bar and the chart bars for which calculations are possible.
Intrabar Efficiency Ratio (IER)
Intrabar Efficiency Ratio applies the concept of ER on an intrabar level. Rather than comparing the overall change to the sum of bar changes for the current chart's timeframe over a period, IER compares single bar changes for the current chart's timeframe to the sum of absolute intrabar changes, then applies smoothing to the result. This gives an indication of how efficient changes are on the current chart's timeframe for each bar of data relative to LTF bar changes on an average basis. Unlike the standard ER calculation, we've opted to preserve directional information by not taking the absolute value of overall change, thus allowing it to be utilized as a momentum oscillator. However, by taking the absolute value of this oscillator, it could potentially serve as a replacement for ER in the design of adaptive moving averages.
Since this indicator preserves directional information, IER can be regarded as similar to the Chande Momentum Oscillator (CMO) , which was presented in 1994 by Tushar Chande in "The New Technical Trader". Both CMO and ER essentially measure the same relationship between trend and noise. CMO simply differs in scale, and considers the direction of overall changes.
█ FEATURES
Display
Three different display types are included within the script:
• Line : Displays the middle length MA of the IER as a line .
Color for this display can be customized via the "Line" portion of the "Visuals" section in the script settings.
• Candles : Displays the non-smooth IER and two moving averages of different lengths as candles .
The `open` and `close` of the candle are the longest and shortest length MAs of the IER respectively.
The `high` and `low` of the candle are the max and min of the IER, longest length MA of the IER, and shortest length MA of the IER respectively.
Colors for this display can be customized via the "Candles" portion of the "Visuals" section in the script settings.
• Circles : Displays three MAs of the IER as circles .
The color of each plot depends on the percent rank of the respective MA over the previous 100 bars.
Different colors are triggered when ranks are below 10%, between 10% and 50%, between 50% and 90%, and above 90%.
Colors for this display can be customized via the "Circles" portion of the "Visuals" section in the script settings.
With either display type, an optional information box can be displayed. This box shows the LTF that the script is using, the average number of lower timeframe bars per chart bar, and the number of chart bars that contain LTF data.
Specifying intrabar precision
Ten options are included in the script to control the number of intrabars used per chart bar for calculations. The greater the number of intrabars per chart bar, the fewer chart bars can be analyzed.
The first five options allow users to specify the approximate amount of chart bars to be covered:
• Least Precise (Most chart bars) : Covers all chart bars by dividing the current timeframe by four.
This ensures the highest level of intrabar precision while achieving complete coverage for the dataset.
• Less Precise (Some chart bars) & More Precise (Less chart bars) : These options calculate a stepped LTF in relation to the current chart's timeframe.
• Very precise (2min intrabars) : Uses the second highest quantity of intrabars possible with the 2min LTF.
• Most precise (1min intrabars) : Uses the maximum quantity of intrabars possible with the 1min LTF.
The stepped lower timeframe for "Less Precise" and "More Precise" options is calculated from the current chart's timeframe as follows:
Chart Timeframe Lower Timeframe
Less Precise More Precise
< 1hr 1min 1min
< 1D 15min 1min
< 1W 2hr 30min
> 1W 1D 60min
The last five options allow users to specify an approximate fixed number of intrabars to analyze per chart bar. The available choices are 12, 24, 50, 100, and 250. The script will calculate the LTF which most closely approximates the specified number of intrabars per chart bar. Keep in mind that due to factors such as the length of a ticker's sessions and rounding of the LTF, it is not always possible to produce the exact number specified. However, the script will do its best to get as close to the value as possible.
Specifying MA type
Seven MA types are included in the script for different averaging effects:
• Simple
• Exponential
• Wilder (RMA)
• Weighted
• Volume-Weighted
• Arnaud Legoux with `offset` and `sigma` set to 0.85 and 6 respectively.
• Hull
Weighting
This script includes the option to weight IER values based on the percent rank of absolute price changes on the current chart's timeframe over a specified period, which can be enabled by checking the "Weigh using relative close changes" option in the script settings. This places reduced emphasis on IER values from smaller changes, which may help to reduce noise in the output.
█ FOR Pine Script™ CODERS
• This script imports the recently published lower_ltf library for calculating intrabar statistics and the optimal lower timeframe in relation to the current chart's timeframe.
• This script uses the recently released request.security_lower_tf() Pine Script™ function discussed in this blog post .
It works differently from the usual request.security() in that it can only be used on LTFs, and it returns an array containing one value per intrabar.
This makes it much easier for programmers to access intrabar information.
• This script implements a new recommended best practice for tables which works faster and reduces memory consumption.
Using this new method, tables are declared only once with var , as usual. Then, on the first bar only, we use table.cell() to populate the table.
Finally, table.set_*() functions are used to update attributes of table cells on the last bar of the dataset.
This greatly reduces the resources required to render tables.
Look first. Then leap.
Search in scripts for "科创50和科创100区别"

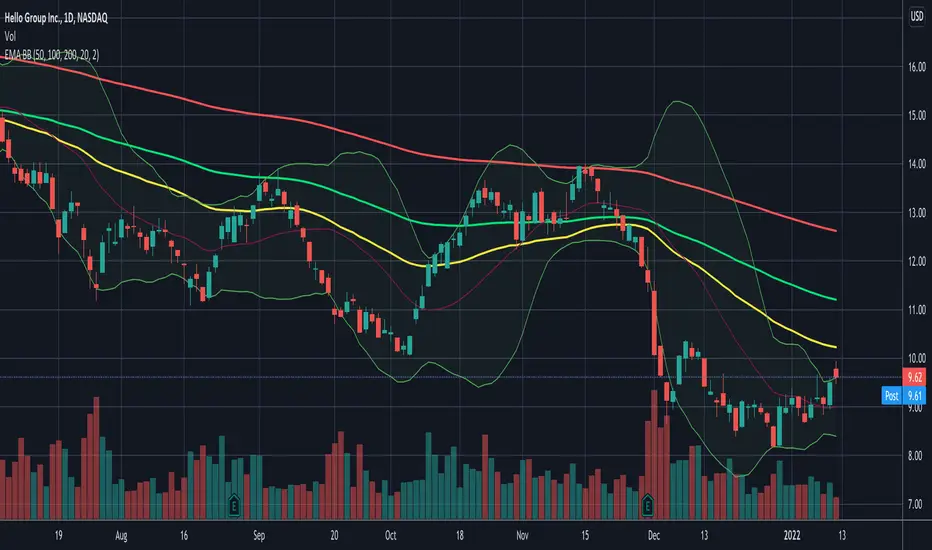
Daily EMA50 100 200 + BBStandard Bollinger Bands (timeframe dependent), period and standard deviation are configurable.
And standard daily triple EMA (timeframe independent). Short, Medium and Long periods are configurable (50/100/200 by default)
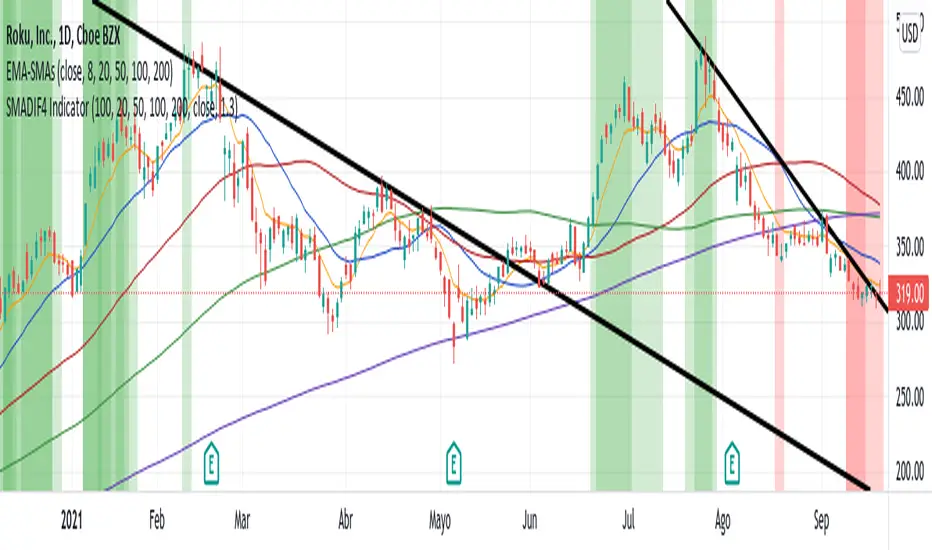
SMADIF4 IndicatorIt shows a percentage difference between close and 4-SMA, 20, 50, 100 and 200. As it turns greener, the stock is more expensive, and vice versa, it turns redder when it becomes cheaper relative to the SMA. It will print the green backgraound as long as the bar closes above the 200 SMA and red as long as the bar closes below the 200 SMA. It uses by default 1.3 sigma to discriminate non-representative values and 100 bars in the past.

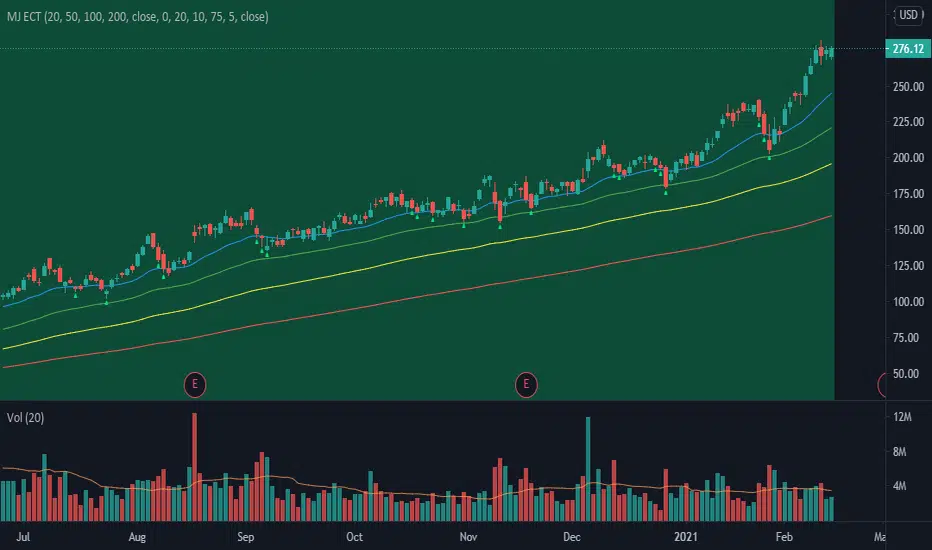
MJ ECT== One Line Introduction ==
ECT is a multi-level, trend focused technical indicator based on a three-step hierarchical approach - comprising the tide, wave, and ripple - to trend identification.
== Indicator Philosophy ==
The author believes that market trends can be understood in a three-step hierarchy, with tide at the top, wave in the middle, and ripple at the bottom, corresponding to long-, middle-, and short-term momentum in the stock price. This indicator therefore comprises three technical indicators which aims to reflect the abovementioned features of a trend. These three components are True Strength Index (TSI), Exponential Moving Averages ( EMA ), and Commodity Channel Index ( CCI ).
== Indicator Components and Breakdown ==
True Strength Index (TSI) -> Tide
A 20-period TSI is used to visualize the bullish or bearish sentiment surrounding the stock. Crossovers above the zero line are interpreted as bullish while crossovers below the zero line are interpreted as bearish . This is painted into the background where green represents bullish and red represents bearish . While the background is red ( bearish ), no bullish positions should be taken. Hence, the TSI painted background acts as a directional bias filter and going against the bias is not recommended. After understanding the directional bias, the user can delve further into the areas of value for the stock in the Wave.
Exponential Moving Averages ( EMA ) -> Wave
Four EMA are used (20, 50, 100, 200) to identify the dynamic support and resistance waves in a trending market. Stock price pullbacks into any of these EMA represent areas of value where the user can consider taking positions. The correct EMA to use depends on individual stock's behavior, with multiple bounces on a specified EMA being the priority. After understanding which wave best reflects the area of value of a stock, the user can move on to the Ripple to time their entries.
Commodity Channel Index ( CCI ) -> Ripple
A 5-period CCI is used to identify short-term oversold conditions where prices are on discount. Discount is defined by the 5-period CCI crossing below -100 as it reflects a weekly oversold condition. The indicator will display a small triangle below the candle when this condition is met.
== Ready To Deploy Field Manual ==
When background is painted red, do nothing.
When background is painted green, begin thinking of bullish opportunities.
Look for the specific EMA that has the most bounces of stock price in recent months, this is the area of value to look for buying opportunity.
For the candles that intersect the EMA you identified above, watch for the appearance of a small triangle below the candle that tells you the entry timing.
When the entry timing signal triangle appears, remember the High of that candle and buy your position when the subsequent candle breaks above this High.
If the High is not broken above in the next immediate candle, remember the newer High of the newer candle (basically follow / trail the latest High until a break above is hit).
If the background turns from green to red, stop following the High and do not enter because the market sentiment has changed to bearish .
If you are holding an existing position and the background turns red, consider exiting the position. You may consider remembering the Low of the candle and exit your position if this Low is broken below on a subsequent candle.
== Best Wishes ==
The author wishes the best success for all users of this technical indicator.


Enhanced TMA Strategy[BMM]This strategy combines multiple moving averages with pattern recognition and dynamic coloring to identify high-probability trades. It uses 3-line strike patterns, engulfing candles, and RSI-based trend analysis with proper risk management for consistent 75%+ win rates.
Ideal Settings by Timeframe
For clear signals strategy can be used with:
"The Arty" - The Moving Average Official Indicator
or
TMA Legacy - "The Arty"
5-Minute Charts:
MA Lengths: 21, 50, 100, 200
MA Type: EMA
Risk: 1%
Risk:Reward: 2:1
Enable RSI Filter: Yes
Sessions: London + NY only
15-Minute Charts:
MA Lengths: 21, 50, 89, 144
MA Type: SMMA
Risk: 1.5%
Risk:Reward: 2.5:1
Enable RSI Filter: Yes
Sessions: All major sessions
30-Minute Charts:
MA Lengths: 13, 34, 55, 89
MA Type: EMA
Risk: 2%
Risk:Reward: 3:1
Enable RSI Filter: No
Sessions: London + NY only
Key Features to Enable:
Dynamic line coloring
Trend fill
All pattern signals
Session backgrounds
Strategy alerts
Trade only during major session overlaps for best liquidity and volatility.

Gann Fan Strategy [KedarArc Quant]Description
A single-concept, rule-based strategy that trades around a programmatic Gann Fan.
It anchors to a swing (or a manual point), builds 1×1 and related fan lines numerically, and triggers entries when price interacts with the 1×1 (breakout or bounce). Management is done entirely with the fan structure (next/previous line) plus optional ATR trailing.
What TV indicators are used
* Pivots: `ta.pivothigh/ta.pivotlow` to confirm swing highs/lows for anchor selection.
* ATR: `ta.atr` only to scale the 1×1 slope (optional) and for an optional trailing stop.
* EMA: `ta.ema` as a trend filter (e.g., only long above the EMA, short below).
No RSI/MACD/Stoch/Heikin/etc. The logic is one coherent framework: Gann price–time geometry, with ATR as a scale and EMA as a risk filter.
How it works
1. Anchor
* Auto: chooses the most recent *confirmed* pivot (you control Left/Right).
* Manual: set a price and bar index and the fan will hold that point (no re-anchoring).
* Optional Re-anchor when a newer pivot confirms.
2. 1×1 Slope (numeric, not cosmetic)
* ATR mode: `1×1 = ATR(Length) × Multiplier` (adapts to volatility).
* Fixed mode: `ticks per bar` (constant slope).
Because slope is numeric, it doesn’t change with chart zoom, unlike the drawing tool.
3. Fan Lines
Builds classic ratios around the 1×1: 1/8, 1/4, 1/3, 1/2, 1/1, 2/1, 3/1, 4/1, 8/1.
4. Signals
* Breakout: cross of price over/under the 1×1 in the EMA-aligned direction.
* Bounce (optional): touch + reversal across the 1×1 to reduce whipsaw.
5. Exits & Risk
* Take-profit at the next fan line; Stop at the previous fan line.
* If a level is missing (right after re-anchor), a fallback Risk-Reward (RR) is used.
* Optional ATR trailing stop.
Why this is unique
* True numeric fan: The 1×1 slope is calculated from ATR or fixed ticks—not from screen geometry—so it is scale-invariant and reproducible across users/timeframes.
* Deterministic anchor logic: Uses confirmed pivots (with your L/R settings). No look-ahead; anchors update only when the right bars complete.
* Fan-native trade management: Both entries and exits come from the fan structure itself (with a minimal ATR/EMA assist), keeping the method pure.
* Two entry archetypes: Breakout for momentum days; Bounce for range days—switchable without changing the core model.
* Manual mode: Lock a session’s bias by anchoring to a chosen swing (e.g., day’s first major low/high) and keep the fan constant all day.
Inputs (quick guide)
* Auto Anchor (Left/Right): pivot sensitivity. Higher values = fewer, stronger anchors.
* Re-anchor: refresh to newer pivots as they confirm.
* Manual Anchor Price / Bar Index: fixes the fan (turn Auto off).
* Scale 1×1 by ATR: on = adaptive; off = use ticks per bar.
* ATR Length / ATR Multiplier: controls adaptive slope; start around 14 / 0.25–0.35.
* Ticks per bar: exact fixed slope (match a hand-drawn fan by computing slope ÷ mintick).
* EMA Trend Filter: e.g., 50–100; trades only in EMA direction.
* Use Bounce: require touch + reverse across 1×1 (helps in chop).
* TP/SL at fan lines; Fallback RR for missing levels; ATR Trailing Stop optional.
* Transparency/Plot EMA: visual preferences.
Tips
* Range days: larger pivots (L/R 8–12), Bounce ON, ATR Multiplier \~0.30–0.40, EMA 100.
* Trend days: L/R 5–6, Breakout, Multiplier \~0.20–0.30, EMA 50, ATR trail 1.0–1.5.
* Match the TV Gann Fan drawing: turn ATR scale OFF, set ticks per bar = `(Δprice between anchor and 1×1 target) / (bars) / mintick`.
Repainting & testing notes
* Pivots require Right bars to confirm; anchors are set after confirmation (no look-ahead).
* Signals use the current bar close with TradingView strategy mechanics; real-time vs. bar-close can differ slightly, as with any strategy.
* Re-anchoring legitimately moves the structure when new pivots confirm—by design.
⚠️ Disclaimer
This script is provided for educational purposes only.
Past performance does not guarantee future results.
Trading involves risk, and users should exercise caution and use proper risk management when applying this strategy.

4 EMA Multi-Length / Abbas4 EMA Multi Length indicator
in case you need to make 4 different EMA/s for your chart
for swinging you'll need 50/100/150/200
for scalping perhaps 9/20/50
this indicator allows you to combine up to 4 EMAS in one indicator instead of 4 separate ones.

Common DMAs with LabelsHere's a short description for publishing:
Common Daily Moving Averages (DMA) Indicator with Smart Labels
Displays the most widely-used moving averages that professional traders watch: 5, 10, 20, 50, 100, and 200 DMAs with clear color-coding and descriptive labels.
Key Features:
Smart Labels - Each DMA shows its trading purpose (Day Trading, Swing Trading, Bull/Bear Line, etc.)
Customizable Display - Toggle any DMA on/off individually
Golden/Death Cross Alerts - Optional 50/200 crossover signals
Live Status Table - Shows current DMA values vs price with up/down arrows
Professional Styling - Color-coded lines with appropriate thickness (200 DMA emphasized)
Perfect for:
Multi-timeframe trend analysis
Support/resistance identification
Bull/bear market confirmation
Entry/exit timing
Usage: Add to chart, customize which DMAs to display in settings. Labels appear on the right showing each average's trading significance. Enable the status table for quick price-vs-DMA reference.
Ideal for both beginners learning key moving averages and experienced traders wanting a clean, informative DMA setup.

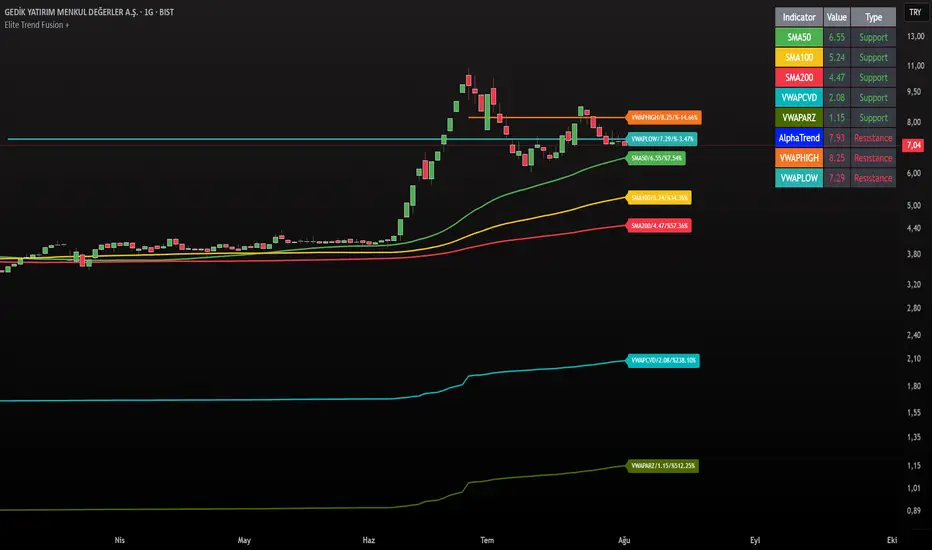
Elite Trend FusionThis indicator combines multiple technical analysis tools to assist traders in identifying trends, support/resistance levels, and potential trading opportunities. Developed by @IQ-TRADER with contributions to the Alpha Section by @KivancOzbilgic, this script overlays the following components on your chart:
EMA1: A customizable Exponential Moving Average for short-term trend analysis.
SMA Cluster (50, 100, 200): Simple Moving Averages on daily timeframes to identify long-term trends and key support/resistance zones.
Anchored VWAP x2 (VWAPCVD & VWAPARZ): Two Volume Weighted Average Price lines anchored to user-defined dates, providing insights into price levels relative to volume from specific points in time.
AlphaTrend: A custom trend-following indicator based on ATR and MFI, helping to gauge market direction and volatility.
Usage InstructionsInstallation:
Copy and paste the script into the Pine Script editor on TradingView, then add it to your chart.
Customization:Adjust the periods for EMA, SMA50, SMA100, and SMA200 under the "Inputs" tab.
Set the anchor dates for VWAPCVD and VWAPARZ to analyze specific historical periods.
Enable or disable individual components (EMA1, SMA50, SMA100, SMA200, VWAPCVD, VWAPARZ, AlphaTrend) and toggle labels via the settings.
Customize colors and line thickness to suit your preferences.
Modify the AlphaTrend multiplier and period for tailored sensitivity.
Interpretation:
Use the EMA1 for short-term momentum and crossovers with SMAs.
Monitor SMA crossovers (e.g., SMA50 crossing SMA200) for trend changes.
The Anchored VWAPs act as dynamic support/resistance levels based on the selected anchor dates.
AlphaTrend provides a visual guide for trend direction; use it alongside other indicators for confirmation.
Labels on the last bar show the current value and percentage distance from the price for each enabled indicator.
Pine Screener Module Usage:
Add this indicator to the Pine Screener to filter stocks, forex pairs, or other instruments based on the calculated distances (in percentage) between the close price and SMA50, SMA100, SMA200, VWAPCVD, and VWAPARZ.
In the Screener, use the "SMA50 Distance (%)", "SMA100 Distance (%)", "SMA200 Distance (%)", "VWAPCVD Distance (%)", and "VWAPARZ Distance (%)" columns to identify overbought/oversold conditions or potential reversal points.
Example filters: Set conditions like "SMA50 Distance (%) > 5" to find stocks trading significantly above the 50-day SMA, or "VWAPCVD Distance (%) < -2" to spot assets below the anchored VWAP, indicating potential support levels.
Combine multiple conditions (e.g., SMA50 Distance (%) > 5 AND AlphaTrend > previous AlphaTrend) to refine your scan for bullish trends.
Note: Ensure the indicator is applied to the chart or screener with the desired timeframe for accurate results.
Notes
This is an overlay indicator, meaning it plots directly on the price chart.
The script uses daily SMA calculations for consistency across timeframes.
Labels appear only on the last bar and are customizable.
This tool is for educational and informational purposes only. Trading involves risks, and it is recommended to consult a financial advisor before making decisions.
The script is credited to @IQ-TRADER with acknowledgment to @KivancOzbilgic for the Alpha Section contribution, adhering to intellectual property guidelines.
No Financial Advice: The description explicitly states that the indicator is for educational use and not financial advice, complying with TradingView's policy against promoting trading signals as guarantees.
Clear Usage: Step-by-step instructions are provided to ensure users can apply the indicator effectively, including screener usage.
No External Links or Promotions: No external links or promotional content is included, aligning with platform rules.
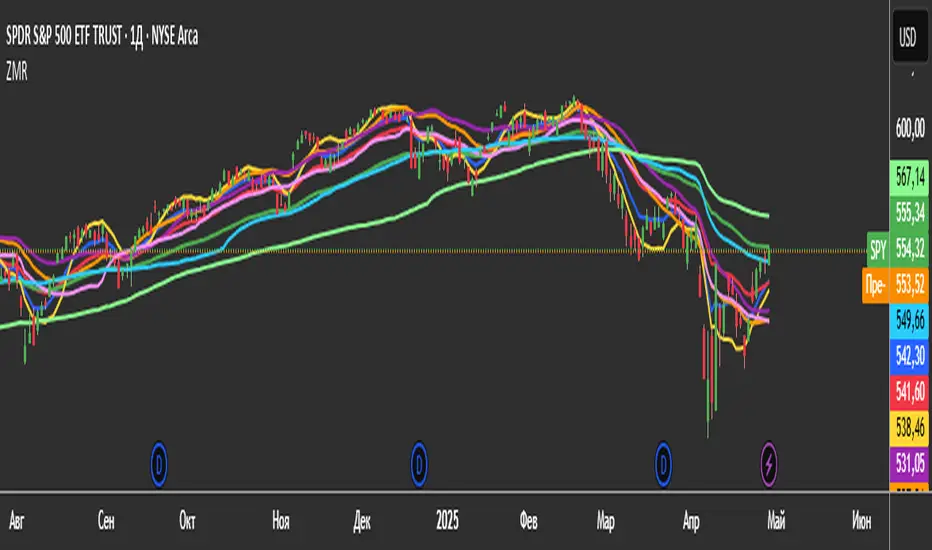
3 Zero Lag + 3 Moving Averages + 3 RVWAPThe "3 Zero Lag + 3 Moving Averages + 3 RVWAP" (ZMR) indicator combines three groups of tools for technical analysis.
1. Three Customizable Moving Averages (MAs):
Configuration for Each MA:
Choice of 7 types (SMA, EMA, WMA, HMA, VWMA, LSMA, SMMA).
Independent periods and price sources for each line.
Visualization:
MA1 (Blue), MA2 (Red), MA3 (Green).
2. Three Zero Lag EMAs (ZLEMA) with Individual Settings:
Lag Reduction: Corrects traditional EMA lag using:
Adjusted Price = 2 * Current Price - Price .
Flexibility:
Unique lengths (20, 50, 70) and individual price sources for each ZLEMA (HLC3, HL2, Close, etc.).
Colors:
ZLEMA1 (Yellow), ZLEMA2 (Orange), ZLEMA3 (Purple).
3. Three Rolling VWAPs with Custom Parameters:
Volume-Weighted Average Price (VWAP):
Calculated for three periods (20, 50, 100) with dedicated price sources for each VWAP.
Colors:
VWAP1 (Pink), VWAP2 (Light Blue), VWAP3 (Neon Green).
SMC Entry Signals MTF v2📘 User Guide for the SMC Entry Signals MTF v2 Indicator
🎯 Purpose of the Indicator
This indicator is designed to identify reversal entry points based on Smart Money Concepts (SMC) and candlestick confirmation. It’s especially useful for traders who use:
Imbalance zones, order blocks, breaker blocks
Liquidity grabs
Multi-timeframe confirmation (MTF)
📈 How to Use the Signals on the Chart
✅ LONG Signal (green triangle below the candle):
Conditions:
Price is in a discount zone (below the FIB 50% level)
A bullish engulfing candle appears
A bullish Order Block (OB) or Breaker Block is detected
There’s an upward imbalance
A bullish OB is confirmed on the higher timeframe
➡️ How to act:
Consider entering long on the current or next candle.
Place your stop-loss below the OB or the nearest swing low.
Take profit at the nearest liquidity zone or premium area (above FIB 50%).
🔻 SHORT Signal (red triangle above the candle):
Conditions:
Price is in a premium zone (above FIB 50%)
A bearish engulfing candle appears
A bearish OB or Breaker Block is detected
There’s a downward imbalance
A bearish OB is confirmed on the higher timeframe
➡️ How to act:
Consider short entry after the signal.
Place your stop-loss above the OB or swing high.
Target the discount zone or the next liquidity pocket.
⚙️ Recommended Settings by Trading Style
Trading Style Suggested Settings Notes
Intraday (1–15m) fibLookback = 20–50, obLookback = 5–10, htf_tf = 1H/4H Fast signals. Use Discount/Premium + Engulfing.
Swing/Position (1H–1D) fibLookback = 50–100, obLookback = 10–20, htf_tf = 1D/1W Higher trust in MTF confirmation. Ideal with fundamentals.
Scalping (1m) fibLookback = 10–20, obLookback = 3–5, htf_tf = 15m/1H Remove Breaker and MTF for quick reaction trades.
🧠 Best Practices for Traders
Trend Filtering:
Use EMAs or volume to confirm the current trend.
Take longs only in uptrends, shorts in downtrends.
Liquidity Zones:
Use this indicator after liquidity grabs.
OBs and Breakers often appear right after stop hunts.
Combine with Manual Zones:
This works best when paired with manually drawn OBs and key levels.
Backtest the Signals:
Use Bar Replay mode on TradingView to test past signals.
🧪 Example Trade Setup
Example on BTCUSDT 15m:
Price drops into the discount zone.
A green triangle appears (bullish engulfing + OB + imbalance + HTF OB).
You enter long, stop below the OB, target the premium zone.
🎯 This type of setup often gives a risk/reward ratio of 1:2 or better — profitable even with a 40% win rate.
⏰ Alerts & Automation
Enable alerts:
"SMC Long Entry" — fires when a long signal appears.
"SMC Short Entry" — fires when a short signal appears.
You can integrate this with bots via webhook, like:
TradingConnector, 3Commas, Alertatron, etc.
✅ What This Indicator Gives You
High-probability entries using SMC logic
Customizable filters for entry logic
Multi-timeframe confirmation for stronger setups
Suitable for both intraday and swing trading

VWAP Horizon Suite Optimized - CoffeeKillerVWAP Horizon Suite Optimized - User Guide
Overview
The VWAP Horizon Suite Optimized is a comprehensive technical analysis tool for TradingView designed to enhance your trading strategy with Volume Weighted Average Price (VWAP) analysis, standard deviation bands, and customizable Exponential Moving Averages (EMAs). This indicator provides a robust framework for identifying potential support and resistance levels, price momentum, and market trends.
Key Features
- **Daily VWAP with Session Reset**: Automatically resets at 17:00 (5:00 PM) each day
- **Customizable Standard Deviation/Percentage Bands**: Up to 3 bands above and below VWAP
- **High/Low Point Detection**: Visual markers for significant price levels
- **Multiple Customizable EMAs**: 8 different EMAs that can be individually toggled and styled
- **Visual Customization**: Adjustable colors, fills, and styles for all elements
VWAP Settings
- **Source**: Determines the price data used to calculate VWAP (default: HLC3 - High, Low, Close average)
Bands Settings
- **Bands Calculation Mode**: Choose between "Standard Deviation" or "Percentage" methods
- **Show Band #1, #2, #3**: Toggle visibility for each band
- **Band Multiplier #1, #2, #3**: Adjust the distance from VWAP (in standard deviations or percentage)
- **Show Fills**: Enable colored fills between bands for better visualization
Visualization Settings
- **Show High/Low Markers**: Display diamond markers for local high and low points relative to VWAP, these reset based on the price crossing the VWAP Line.
EMA Settings
The indicator provides 8 customizable EMAs (8, 13, 21, 26, 48, 50, 100, and 200) with individual controls:
- **Show EMA X**: Toggle visibility for each EMA
- **EMA X Period**: Adjust the period length for calculation
- **EMA X Color**: Customize the color of each EMA
- **EMA Line Width**: Set the width for all EMA lines
How to Use
Basic VWAP Analysis
The core VWAP line (blue) represents the average price weighted by volume since the start of the session (17:00 daily reset). This serves as a dynamic support/resistance level and reference point for intraday trading.
1. **Price above VWAP**: Generally bullish short-term sentiment
2. **Price below VWAP**: Generally bearish short-term sentiment
3. **Crosses of VWAP**: Potential shift in short-term momentum
Standard Deviation Bands
The bands surrounding VWAP help identify potential support, resistance, and volatility levels:
- **Band #1 (±1σ)**: Price often reverts to VWAP when reaching these levels
- **Band #2 (±2σ)**: Stronger support/resistance areas, possible reversal zones
- **Band #3 (±3σ)**: Extreme price levels, often indicating overbought/oversold conditions
High/Low Point Detection
Purple and yellow diamond markers identify significant swing highs and lows relative to VWAP, helping you recognize potential reversal points or continuation patterns. (These repaint in a effort to find the max high/low point from the VWAP Line)
EMA Strategy
The customizable EMAs can be used to:
- Find potential support/resistance levels
- Create crossover systems
- Analyze market structure
Common EMA combinations include:
- 8 & 21 for short-term trends
- 50 & 200 for long-term trends and the "Golden Cross/Death Cross"
- 13 & 48 for the "New Golden Cross" - a modern alternative gaining popularity among traders
- 8, 13, 21 for complex short-term momentum analysis
Advanced Usage Tips
For Day Traders
1. **Opening Range Analysis**: Watch how price reacts to VWAP in the first hour of trading
2. **VWAP Reversions**: Look for trades when price touches outer bands and reverses toward VWAP
3. **Band Breakouts**: Strong moves beyond Band #2 may indicate momentum for continuation
For Swing Traders
1. **Use alongside daily/weekly support-resistance levels**
2. **Combine with EMA crossovers for trend confirmation**
3. **Identify potential reversal zones where price reaches Band #3**
Combined Strategies
- **EMA + VWAP Confluence**: Strong signals occur when EMA lines and VWAP/bands align at the same price level
- **High/Low + Band Touch**: When a high/low marker appears near a band, it may indicate a stronger support/resistance level
Conclusion
The VWAP Horizon Suite Optimized provides a comprehensive set of tools for price analysis based on volume-weighted data and exponential averages. By understanding and properly configuring the various components, you can create a powerful visual framework for identifying potential trading opportunities across multiple timeframes.
Remember that no indicator provides perfect signals, and the VWAP Horizon Suite works best when used as part of a complete trading strategy that includes risk management, multiple confirmation tools, and proper analysis of market conditions.
DISCLAIMER
**DISCLAIMER: This indicator and its signals are intended solely for educational and informational purposes. They do not constitute financial advice. Trading involves significant risk of loss. Always conduct your own analysis and consult with financial professionals before making trading decisions.**

CSVParser█ OVERVIEW
The library contains functions for parsing and importing complex CSV configurations (with a special simple syntax) into a special hierarchical object (of type objProps ) as follows:
Functions:
parseConfig() - reads CSV text into an objProps object.
toT() - displays the contents of an objProps object in a table form, which allows to check the CSV text for syntax errors.
getPropAr() - returns objProps.arS array for child object with `prop` key in mpObj map (or na if not found)
This library is handy in allowing users to store presets for the scripts and switch between them (see, e.g., my HTF moving averages script where users can switch between several preset configuations of 24 MA's across 5 timeframes).
█ HOW THE SCRIPT WORKS.
The script works as follows:
all values read from config text are stored as strings
Nested brackets in config text create a named nested objects of objProps0, ... , objProps9 types.
objProps objects of each level have the following fields:
- array arS for storing values without names (e.g. "12, 23" will be imported into a string array arS as )
- map mpS for storing items with names (e.g. "tf = 60, length = 21" will be imported as <"tf", "60"> and <"length", "21"> pairs into mpS )
- map mpObj for storing nested objects (e.g. "TF1(tf=60, length(21,50,100))" creates a <"TF1, objProps0 object> pair in mpObj map property of the top level object (objProps) , "tf=60" is stored as <"tf", "60"> key-value pair in mpS map property of a next level object (objProps0) and "length (...)" creates a <"length", objProps1> pair in objProps0.mpObj map while length values are stored in objProps1.arS array as strings. Every opening bracket creates a next level objProps object.
If objects or properties with duplicate names are encountered only the latest is imported
(e.g. for "TF1(length(12,22)), TF1(tf=240)" only "TF1(tf=240)" will be imported
Line breaks are not regarded as part of syntax (i.e. values are imported with line breaks, you can supply
symbols "(" , ")" , "," and "=" are special characters and cannot be used within property values (with the exception of a quoted text as a value of a property as explained below)
named properties can have quoted text as their value. In that case special characters within quotation marks are regarded as normal characters. Text between "=" and opening quotation mark as well as text following the closing quotation mark and until next property value is ignored. E.g. "quote = ignored "The quote" also ignored" will be imported as <"quote", "The quote">. Quotation marks within quotes must be excaped with "\" .
if a key names happens to be a multi-line then only first line containing non-space characters (trimmed from spaces) is taken as a key.
")," or ") ," and similar do not create an empty ("") array item while ",," does. (",)" creates an "" array item)
█ CSV CONFIGURATION SYNTAX
Unnamed values: just list them comma separated and they will be imported into arS of the object of the current level.
Named values: use "=" sign as follows: "property1=value1, property2 = value2"
Value of several objects: Use brackets after the name of the object ant list all object properties within the brackets (including its child objects if necessary). E.g. "TF1(tf =60, length(21,200), TF2(tf=240, length(50,200)"
Named and unnamed values as well as objects can go in any order. E.g. "12, tf=60, 21" will be imported as follows: "12", "21" will go to arS array and <"tf", "60"> will go to mpS maP of objProps (the top level object).
You can play around and test your config text using demo in this library, just edit your text in script settings and see how it is parsed into objProps objects.
█ USAGE RECOMMENDATIONS AND SAMPLE USE
I suggest the following approach:
- create functions for your UDT which can set properties by name.
- create enumerator functions which iterates through all the property names (supplied as a const string array) and imports their values into the object
█ SAMPLE USE
A sample use of this library can be seen in my Multi-timeframe 24 moving averages + BB+SAR+Supertrend+VWAP script where settings for the MAs across many timeframes are imported from CSV configurations (presets).
█ FULL LIST OF FUNCTIONS AND PROPERTIES
nzs(_s, nz)
Like nz() but for strings. Returns `nz` arg (default = "") if _s is na.
Parameters:
_s (string)
nz (string)
method init(this)
Initializes objProps obj (creates child maps and arrays)
Namespace types: objProps
Parameters:
this (objProps)
method toT(this, nz)
Outputs objProps to string matrices for further display using autotable().
Namespace types: objProps, objProps1, ..., objProps9
Parameters:
this (objProps/objProps1/..../objProps9)
nz (string)
Returns: A tuple - value, merge and color matrix (autotable() parameters)
method parseConfig(this, s)
Reads config text into objProps (unnamed values into arS, named into mpS, sub-levels into mpObj)
Namespace types: objProps
Parameters:
this (objProps)
s (string)
method getPropArS(this, prop)
Returns a string array of values for a given property name `prop`. Looks for a key `prop` in objProps.mpObj
if finds pair returns obj.arS, otherwise returns na. Returns a reference to the original, not a copy.
Namespace types: objProps, objProps1, ..., objProps8
Parameters:
this (objProps/objProps1/..../objProps8)
prop (string)
method getPropVal(this, prop, id)
Checks if there is an array of values for property `prop` and returns its `id`'s element or na if not found
Namespace types: objProps, objProps1, ..., objProps8
Parameters:
this (objProps/objProps1/..../objProps8) : objProps object containing array of property values in a child objProp object corresponding to propertty name.
prop (string) : (string) Name of the property
id (int) : (int) Id of the element to be returned from the array pf property values
objProps9 type
Object for storing values read from CSV relating to a particular object or property name.
Fields:
mpS (map) : (map() Stores property values as pairs
arS (array) : (string ) Array of values
objProps, objProps0, ... objProps8 types
Object for storing values read from CSV relating to a particular object or property name.
Fields:
mpS (map) : (map() Stores property values as pairs
arS (array) : (string ) Array of values
mpObj (map) : (map() Stores objProps objects containing properties's data as pairs

Fibonacci Moving Averages Input(FibMAI) Fibonacci Moving Averages Input is a strategy based on moving averages cross-over or cross-under signals. The bullish golden cross appears on a chart when a stock's short-term moving average crosses above its long-term moving average. The bearish death cross appears on a chart when a stock’s short-term moving average, crosses below its long-term moving average. The general market consensus values used are the 50-day moving average and the 200-day moving average.
With the (FibMAI) Fibonacci Moving Averages Input strategy you can use any value you choose for your bullish or bearish cross. For visual display purposes I have a lot of the Fib Moving Averages 1, 2, 3, 5, 8, 13, 21, 34, 55, 89, 144, 233, 377, 610, 987 shown while hiding the chart candlesticks. But to use this indicator I click on only a couple of MA's to see if there's a notable cross-over or cross-under pattern signal. Then, most importantly, I back test those values into the FibMAI strategy Long or Short settings input.
For example, this NQ1! day chart has it's Long or Short settings input as follows:
Bullish =
FibEMA34
cross-over
FibEMA144
Bearish =
FibEMA55
cross-under
FibSMA144
As you can see you can mix or match 4 different MA's values either Exponential or Simple.
Default color settings:
Rising value = green color
Falling value = red color
Default Visual FibMA settings:
FibEMA's 1, 2, 3, 5, 8, 13, 21, 34, 55, 89, 144, 233, 377, 610, 987, 1597, 2584, 4181
Default Visual MA settings:
SMA's 50, 100, 150, 200
Default Long or Short settings:
Bullish =
FibEMA34
cross-over
FibEMA144
Bearish =
FibEMA55
cross-under
FibSMA144

TechnicalRating█ OVERVIEW
This library is a Pine Script™ programmer’s tool for incorporating TradingView's well-known technical ratings within their scripts. The ratings produced by this library are the same as those from the speedometers in the technical analysis summary and the "Rating" indicator in the Screener , which use the aggregate biases of 26 technical indicators to calculate their results.
█ CONCEPTS
Ensemble analysis
Ensemble analysis uses multiple weaker models to produce a potentially stronger one. A common form of ensemble analysis in technical analysis is the usage of aggregate indicators together in hopes of gaining further market insight and reinforcing trading decisions.
Technical ratings
Technical ratings provide a simplified way to analyze financial markets by combining signals from an ensemble of indicators into a singular value, allowing traders to assess market sentiment more quickly and conveniently than analyzing each constituent separately. By consolidating the signals from multiple indicators into a single rating, traders can more intuitively and easily interpret the "technical health" of the market.
Calculating the rating value
Using a variety of built-in TA functions and functions from our ta library, this script calculates technical ratings for moving averages, oscillators, and their overall result within the `calcRatingAll()` function.
The function uses the script's `calcRatingMA()` function to calculate the moving average technical rating from an ensemble of 15 moving averages and filters:
• Six Simple Moving Averages and six Exponential Moving Averages with periods of 10, 20, 30, 50, 100, and 200
• A Hull Moving Average with a period of 9
• A Volume-Weighted Moving Average with a period of 20
• An Ichimoku Cloud with a conversion line length of 9, base length of 26, and leading span B length of 52
The function uses the script's `calcRating()` function to calculate the oscillator technical rating from an ensemble of 11 oscillators:
• RSI with a period of 14
• Stochastic with a %K period of 14, a smoothing period of 3, and a %D period of 3
• CCI with a period of 20
• ADX with a DI length of 14 and an ADX smoothing period of 14
• Awesome Oscillator
• Momentum with a period of 10
• MACD with fast, slow, and signal periods of 12, 26, and 9
• Stochastic RSI with an RSI period of 14, a %K period of 14, a smoothing period of 3, and a %D period of 3
• Williams %R with a period of 14
• Bull Bear Power with a period of 50
• Ultimate Oscillator with fast, middle, and slow lengths of 7, 14, and 28
Each indicator is assigned a value of +1, 0, or -1, representing a bullish, neutral, or bearish rating. The moving average rating is the mean of all ratings that use the `calcRatingMA()` function, and the oscillator rating is the mean of all ratings that use the `calcRating()` function. The overall rating is the mean of the moving average and oscillator ratings, which ranges between +1 and -1. This overall rating, along with the separate MA and oscillator ratings, can be used to gain insight into the technical strength of the market. For a more detailed breakdown of the signals and conditions used to calculate the indicators' ratings, consult our Help Center explanation.
Determining rating status
The `ratingStatus()` function produces a string representing the status of a series of ratings. The `strongBound` and `weakBound` parameters, with respective default values of 0.5 and 0.1, define the bounds for "strong" and "weak" ratings.
The rating status is determined as follows:
Rating Value Rating Status
< -strongBound Strong Sell
< -weakBound Sell
-weakBound to weakBound Neutral
> weakBound Buy
> strongBound Strong Buy
By customizing the `strongBound` and `weakBound` values, traders can tailor the `ratingStatus()` function to fit their trading style or strategy, leading to a more personalized approach to evaluating ratings.
Look first. Then leap.
█ FUNCTIONS
This library contains the following functions:
calcRatingAll()
Calculates 3 ratings (ratings total, MA ratings, indicator ratings) using the aggregate biases of 26 different technical indicators.
Returns: A 3-element tuple: ( [(float) ratingTotal, (float) ratingOther, (float) ratingMA ].
countRising(plot)
Calculates the number of times the values in the given series increase in value up to a maximum count of 5.
Parameters:
plot : (series float) The series of values to check for rising values.
Returns: (int) The number of times the values in the series increased in value.
ratingStatus(ratingValue, strongBound, weakBound)
Determines the rating status of a given series based on its values and defined bounds.
Parameters:
ratingValue : (series float) The series of values to determine the rating status for.
strongBound : (series float) The upper bound for a "strong" rating.
weakBound : (series float) The upper bound for a "weak" rating.
Returns: (string) The rating status of the given series ("Strong Buy", "Buy", "Neutral", "Sell", or "Strong Sell").

Technical Ratings on Multi-frames / Assets█ OVERVIEW
This indicator is a modified version of TECHNICAL RATING v1.0 available in the public library to provide a quick overview of consolidated technical ratings performed on 12 assets in 3 timeframes.The purpose of the indicator is to provide a quick overview of the current status of the custom 12 (24) assets and to help focus on the appropriate asset.
█ MODIFICATIONS
- Markers, visualizations and alerts have been deleted
- Due to the limitation on maximum number of security (40), the results of 12 assets evaluated in 3 different time frames can be shown at the same time.
- An additional 12 assets can be configured in the settings so that you do not have to choose each ticker one by one to facilitate a quick change, but can switch between the 12 -12 assets with a single click on "Second sets?".
- The position, colors and parameters of the table can be widely customized in the settings.
- The 12 assets can be arranged in rows 3, 4, 6 and 12 with Table Rows options, which can also be used to create a simple mobile view.
- The default gradient color setting has been changed to red/yellow/green traffic lights
ORIGINAL DESCRIPTION ABOUT TECHNICAL RATING v1.0
█ OVERVIEW
This indicator calculates TradingView's well-known "Strong Buy", "Buy", "Neutral", "Sell" or "Strong Sell" states using the aggregate biases of 26 different technical indicators.
█ WARNING
This version is similar, but not identical, to our recently published "Technical Ratings" built-in, which reproduces our "Technicals" ratings displayed as a gauge in the right panel of charts, or in the "Rating" indicator available in the TradingView Screener. This is a fork and refactoring of the code base used in the "Technical Ratings" built-in. Its calculations will not always match those of the built-in, but it provides options not available in the built-in. Up to you to decide which one you prefer to use.
█ FEATURES
Differences with the built-in version
• The built-in version produces values matching the states displayed in the "Technicals" ratings gauge; this one does not always.
• A strategy version is also available as a built-in; this script is an indicator—not a strategy.
• This indicator will show a slightly different vertical scale, as it does not use a fixed scale like the built-in.
• This version allows control over repainting of the signal when you do not use a higher timeframe. Higher timeframe (HTF) information from this version does not repaint.
• You can adjust the weight of the Oscillators and MAs components of the rating here.
• You can configure markers on signal breaches of configurable levels, or on advances declines of the signal.
The indicator's settings allow you to:
• Choose the timeframe you want calculations to be made on.
• When not using a HTF, you can select a repainting or non-repainting signal.
• When using both MAs and Oscillators groups to calculate the rating, you can vary the weight of each group in the calculation. The default is 50/50.
Because the MAs group uses longer periods for some of its components, its value is not as jumpy as the Oscillators value.
Increasing the weight of the MAs group will thus have a calming effect on the signal.
• Alerts can be created on the indicator using the conditions configured to control the display of markers.
Display
The calculated rating is displayed as columns, but you can change the style in the inputs. The color of the signal can be one of three colors: bull, bear, or neutral. You can choose from a few presets, or check one and edit its color. The color is determined from the rating's value. Between 0.1 and -0.1 it is in the neutral color. Above/below 0.1/-0.1 it will appear in the bull/bear color. The intensity of the bull/bear color is determined by cumulative advances/declines in the rating. It is capped to 5, so there are five intensities for each of the bull/bear colors.
The "Strong Buy", "Buy", "Neutral", "Sell" or "Strong Sell" state of the last calculated value is displayed to the right of the last bar for each of the three groups: All, MAs and Oscillators. The first value always reflects your selection in the "Rating uses" field and is the one used to display the signal. A "Strong Buy" or "Strong Sell" state appears when the signal is above/below the 0.5/-0.5 level. A "Buy" or "Sell" state appears when the signal is above/below the 0.1/-0.1 level. The "Neutral" state appears when the signal is between 0.1 and -0.1 inclusively.
Five levels are always displayed: 0.5 and 0.1 in the bull color, zero in the neutral color, and -0.1 and - 0.5 in the bull color.
█ CALCULATIONS
The indicator calculates the aggregate value of two groups of indicators: moving averages and oscillators.
The "MAs" group is comprised of 15 different components:
• Six Simple Moving Averages of periods 10, 20, 30, 50, 100 and 200
• Six Exponential Moving Averages of the same periods
• A Hull Moving Average of period 9
• A Volume-weighed Moving Average of period 20
• Ichimoku
The "Oscillators" group includes 11 components:
• RSI
• Stochastic
• CCI
• ADX
• Awesome Oscillator
• Momentum
• MACD
• Stochastic RSI
• Wiliams %R
• Bull Bear Power
• Ultimate Oscillator

Technical Ratings█ OVERVIEW
This indicator calculates TradingView's well-known "Strong Buy", "Buy", "Neutral", "Sell" or "Strong Sell" states using the aggregate biases of 26 different technical indicators.
█ FEATURES
Differences with the built-in version
• You can adjust the weight of the Oscillators and MAs components of the rating here.
• The built-in version produces values matching the states displayed in the "Technicals" ratings gauge; this one does not always, where weighting is used.
• A strategy version is also available as a built-in; this script is an indicator—not a strategy.
• This indicator will show a slightly different vertical scale, as it does not use a fixed scale like the built-in.
• This version allows control over repainting of the signal when you do not use a higher timeframe. Higher timeframe (HTF) information from this version does not repaint.
• You can configure markers on signal breaches of configurable levels, or on advances declines of the signal.
The indicator's settings allow you to:
• Choose the timeframe you want calculations to be made on.
• When not using a HTF, you can select a repainting or non-repainting signal.
• When using both MAs and Oscillators groups to calculate the rating, you can vary the weight of each group in the calculation. The default is 50/50.
Because the MAs group uses longer periods for some of its components, its value is not as jumpy as the Oscillators value.
Increasing the weight of the MAs group will thus have a calming effect on the signal.
• Alerts can be created on the indicator using the conditions configured to control the display of markers.
Display
The calculated rating is displayed as columns, but you can change the style in the inputs. The color of the signal can be one of three colors: bull, bear, or neutral. You can choose from a few presets, or check one and edit its color. The color is determined from the rating's value. Between 0.1 and -0.1 it is in the neutral color. Above/below 0.1/-0.1 it will appear in the bull/bear color. The intensity of the bull/bear color is determined by cumulative advances/declines in the rating. It is capped to 5, so there are five intensities for each of the bull/bear colors.
The "Strong Buy", "Buy", "Neutral", "Sell" or "Strong Sell" state of the last calculated value is displayed to the right of the last bar for each of the three groups: All, MAs and Oscillators. The first value always reflects your selection in the "Rating uses" field and is the one used to display the signal. A "Strong Buy" or "Strong Sell" state appears when the signal is above/below the 0.5/-0.5 level. A "Buy" or "Sell" state appears when the signal is above/below the 0.1/-0.1 level. The "Neutral" state appears when the signal is between 0.1 and -0.1 inclusively.
Five levels are always displayed: 0.5 and 0.1 in the bull color, zero in the neutral color, and -0.1 and - 0.5 in the bull color.
The levels that can be used to determine the breaches displaying long/short markers will only be visible when their respective long/short markers are turned on in the "Direction" input. The levels appear as a bright dotted line in bull/bear colors. You can control both levels separately through the "Longs Level" and "Shorts Level" inputs.
If you specify a higher timeframe that is not greater than the chart's timeframe, an error message will appear and the indicator's background will turn red, as it doesn't make sense to use a lower timeframe than the chart's.
Markers
Markers are small triangles that appear at the bottom and top of the indicator's pane. The marker settings define the conditions that will trigger an alert when you configure an alert on the indicator. You can:
• Choose if you want long, short or both long and short markers.
• Determine the signal level and/or the number of cumulative advances/declines in the signal which must be reached for either a long or short marker to appear.
Reminder: the number of advances/declines is also what controls the brightness of the plotted signal.
• Decide if you want to restrict markers to ones that alternate between longs and shorts, if you are displaying both directions.
This helps to minimize the number of markers, e.g., only the first long marker will be displayed, and then no more long markers will appear until a short comes in, then a long, etc.
Alerts
When you create an alert from this indicator, that alert will trigger whenever your marker conditions are confirmed. Before creating your alert, configure the makers so they reflect the conditions you want your alert to trigger on.
The script uses the alert() function, which entails that you select the "Any alert() function call" condition from the "Create Alert" dialog box when creating alerts on the script. The alert messages can be configured in the inputs. You can safely disregard the warning popup that appears when you create alerts from this script. Alerts will not repaint. Markers will appear, and thus alerts will trigger, at the opening of the bar following the confirmation of the marker condition. Markers will never disappear from the bar once they appear.
Repainting
This indicator uses a two-pronged approach to control repainting. The repainting of the displayed signal is controlled through the "Repainting" field in the script's inputs. This only applies when you have "Same as chart" selected in the "Timeframe" field, as higher timeframe data never repaints. Regardless of that setting, markers and thus alerts never repaint.
When using the chart's timeframe, choosing a non-repainting signal makes the signal one bar late, so that it only displays a value once the bar it was calculated has elapsed. When using a higher timeframe, new values are only displayed once the higher timeframe completes.
Because the markers never repaint, their logic adapts to the repainting setting used for the signal. When the signal repaints, markers will only appear at the close of a realtime bar. When the signal does not repaint (or if you use a higher timeframe), alerts will appear at the beginning of the realtime bar, since they are calculated on values that already do not repaint.
█ CALCULATIONS
The indicator calculates the aggregate value of two groups of indicators: moving averages and oscillators.
The "MAs" group is comprised of 15 different components:
• Six Simple Moving Averages of periods 10, 20, 30, 50, 100 and 200
• Six Exponential Moving Averages of the same periods
• A Hull Moving Average of period 9
• A Volume-weighed Moving Average of period 20
• Ichimoku
The "Oscillators" group includes 11 components:
• RSI
• Stochastic
• CCI
• ADX
• Awesome Oscillator
• Momentum
• MACD
• Stochastic RSI
• Wiliams %R
• Bull Bear Power
• Ultimate Oscillator
The state of each group's components is evaluated to a +1/0/-1 value corresponding to its bull/neutral/bear bias. The resulting value for each of the two groups are then averaged to produce the overall value for the indicator, which oscillates between +1 and -1. The complete conditions used in the calculations are documented in the Help Center .
█ NOTES
Accuracy
When comparing values to the other versions of the Rating, make sure you are comparing similar timeframes, as the "Technicals" gauge in the chart's right pane, for example, uses a 1D timeframe by default.
For coders
We use a handy characteristic of array.avg() which, contrary to avg() , does not return na when one of the averaged values is na . It will average only the array elements which are not na . This is useful in the context where the functions used to calculate the bull/neutral/bear bias for each component used in the rating include special checks to return na whenever the dataset does not yet contain enough data to provide reliable values. This way, components gradually kick in the calculations as the script calculates on more and more historical data.
We also use the new `group` and `tooltip` parameters to input() , as well as dynamic color generation of different transparencies from the bull/bear/neutral colors selected by the user.
Our script was written using the PineCoders Coding Conventions for Pine .
The description was formatted using the techniques explained in the How We Write and Format Script Descriptions PineCoders publication.
Bits and pieces were lifted from the PineCoders' MTF Selection Framework .
Look first. Then leap.

CT Moving Average Crossover IndicatorMoving Average Crossover Indicator
Here I present a moving average indicator with 9 user definable moving averages from which up to 5 pairs can be selected to show what prices would need to be closed at on the current bar to cross each individual pair.
I have put much emphasis here on simplicity of setting the parameters of the moving averages, selecting the crossover pairs and on the clarity of the displayed information in the optional “Moving Average Crossover Level” Information Box.
What Is a Moving Average (MA)?
According to Investopedia - “In statistics, a moving average is a calculation used to analyze data points by creating a series of averages of different subsets of the full data set.
In finance, a moving average (MA) is a stock indicator that is commonly used in technical analysis. The reason for calculating the moving average of a stock is to help smooth out the price data by creating a constantly updated average price.
By calculating the moving average, the impacts of random, short-term fluctuations on the price of a stock over a specified time-frame are mitigated.”
The user can set the color, type (SMA/EMA) and length of each of the 9 moving averages.
Then the user may choose 5 pairs of moving averages from the set of 9.
The script will then calculate the price needed to be crossed by the close of the current bar in order to crossover each of the user defined pairs and outputs the results as optional lineplots and/or an Infobox which shows the relevant information in a very clear way.
The user may switch the moving averages, crossover lineplots and infobox on and off easily with one click boxes in the settings menu.
The number of decimal places shown in the Infobox can be altered in the settings menu.
If the price required to cross a pair of moving averages is zero or less, the crossover level will display “Impossible” and the plots will plot at zero. (this helps ameliorate chart auto-focus issues)
Quoting a variety of online resources …….
Understanding Moving Averages (MA)
Moving averages are a simple, technical analysis tool. Moving averages are usually calculated to identify the trend direction of a stock or to determine its support and resistance levels. It is a trend-following—or lagging—indicator because it is based on past prices.
The longer the time period for the moving average, the greater the lag. So, a 200-day moving average will have a much greater degree of lag than a 20-day MA because it contains prices for the past 200 days. The 50-day and 200-day moving average figures for stocks are widely followed by investors and traders and are considered to be important trading signals.
Moving averages are a totally customizable indicator, which means that an investor can freely choose whatever time frame they want when calculating an average. The most common time periods used in moving averages are 15, 20, 30, 50, 100, and 200 days. The shorter the time span used to create the average, the more sensitive it will be to price changes. The longer the time span, the less sensitive the average will be.
Investors may choose different time periods of varying lengths to calculate moving averages based on their trading objectives. Shorter moving averages are typically used for short-term trading, while longer-term moving averages are more suited for long-term investors.
There is no correct time frame to use when setting up your moving averages. The best way to figure out which one works best for you is to experiment with a number of different time periods until you find one that fits your strategy.
Predicting trends in the stock market is no simple process. While it is impossible to predict the future movement of a specific stock, using technical analysis and research can help you make better predictions.
A rising moving average indicates that the security is in an uptrend, while a declining moving average indicates that it is in a downtrend. Similarly, upward momentum is confirmed with a bullish crossover, which occurs when a short-term moving average crosses above a longer-term moving average. Conversely, downward momentum is confirmed with a bearish crossover, which occurs when a short-term moving average crosses below a longer-term moving average.
Types of Moving Averages
Simple Moving Average (SMA)
The simplest form of a moving average, known as a simple moving average (SMA), is calculated by taking the arithmetic mean of a given set of values. In other words, a set of numbers–or prices in the case of financial instruments–are added together and then divided by the number of prices in the set.
Exponential Moving Average (EMA)
The exponential moving average is a type of moving average that gives more weight to recent prices in an attempt to make it more responsive to new information.
To calculate an EMA, you must first compute the simple moving average (SMA) over a particular time period. Next, you must calculate the multiplier for weighting the EMA (referred to as the "smoothing factor"), which typically follows the formula: 2/(selected time period + 1). So, for a 20-day moving average, the multiplier would be 2/(20+1)= 0.0952. Then you use the smoothing factor combined with the previous EMA to arrive at the current value.
The EMA thus gives a higher weighting to recent prices, while the SMA assigns equal weighting to all values.
