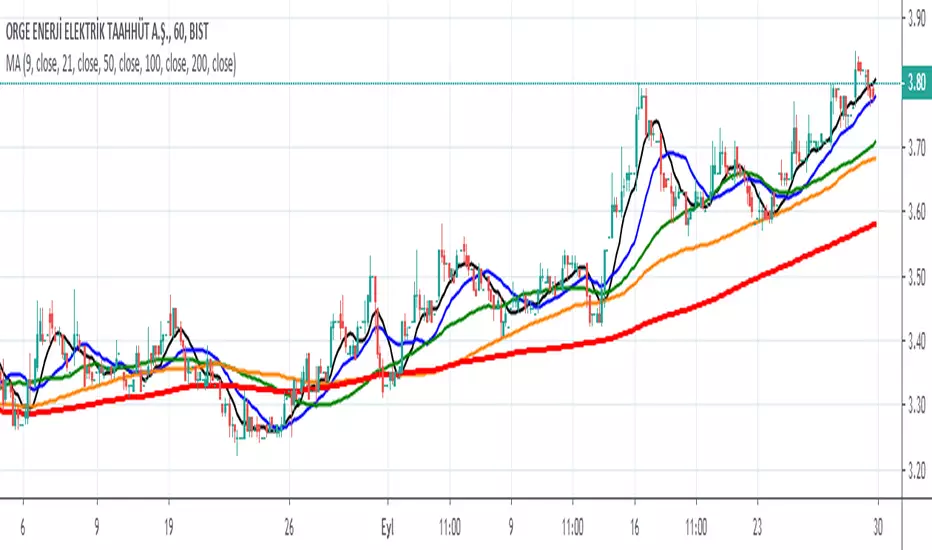
Moving Averages CrossThis Indicator helps you spot crosses between moving averages.
Thought to combine short term and long term strategies.
A complementary element for your trading tool belt.
The First study (short term):
Helps you visualise the relation between two simple moving averages (9,21) by default.
The Second study (long term):
Helps you identify the relation between three simple moving averages (50,100, 200) by default.
Spot Golden Crosses and Death Crosses from far.
Search in scripts for "科创50和科创100区别"

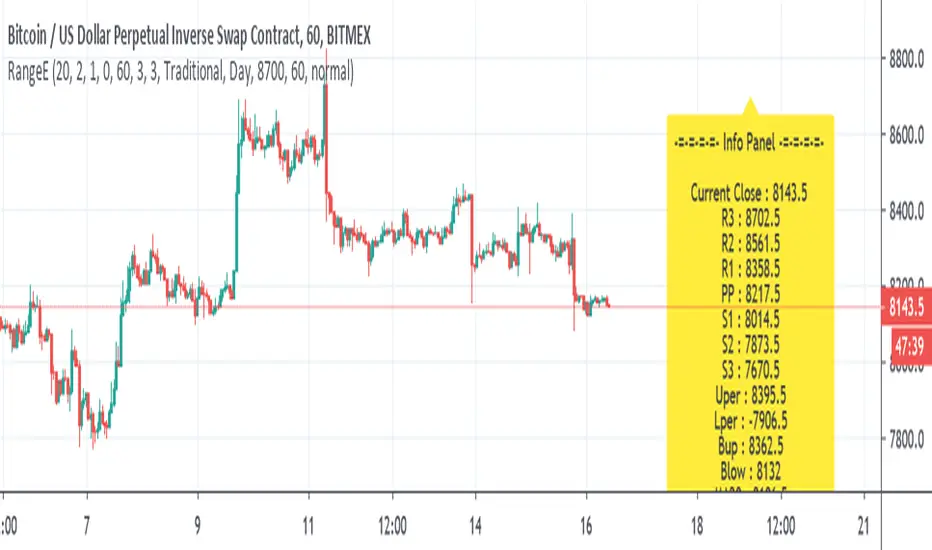
Range EstimateAs a trader I need to know what are the best ranges to get in or out
So this tool try to help a little bit .
First we have Pivot points (all forms with fib ,traditional etc)
next is percentage channel (uper=upper % from close and Lper=lower % from close) , in btc I use 3% up or low for 1 hour candles as it give me good range of lower and upper bound . This you need to change for different TF or different assets
next we have Bollinger upper and lower (Bup= Bollinger upper and Blow=Bollinger lower) it has also MTF function
last we MA =,20,50,100,200
in total the aim of this indicator is to give fast glance on the numbers that important to you as trader fast with a clean graph so you can add your indicator to it to see better how they work
The info panel you can change the font size, you can change distance by offset
and the position on the graph , you need to adjust with position -in this case since it btc I put number of 8700
let say it ETH then I put a number 5% above the close number
if it XRP = then the same trick , lets say 0.3 etc
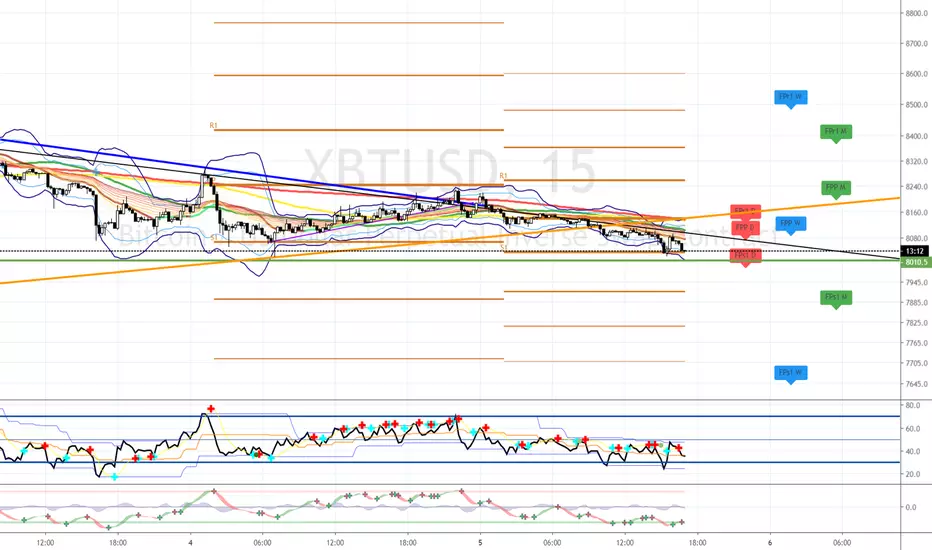
Multi XXL Indikator v2Ma s (50,100,200)
Keltner
Bollinger 2 und 3
Future Pivot
Multi Timeframe MA
Ema s 55=>20
別府 Multiple Moving AveragesThis is yet another script that implements multiple moving averages into one indicator. It also identifies SMA golden crosses and candles where price goes above or below the 200 SMA. It also has a few EMAs and SMAs with configurable periods in case you want to try something out and need a weird EMA or SMA. The default EMAs and SMAs use 50, 100, and 200 periods.

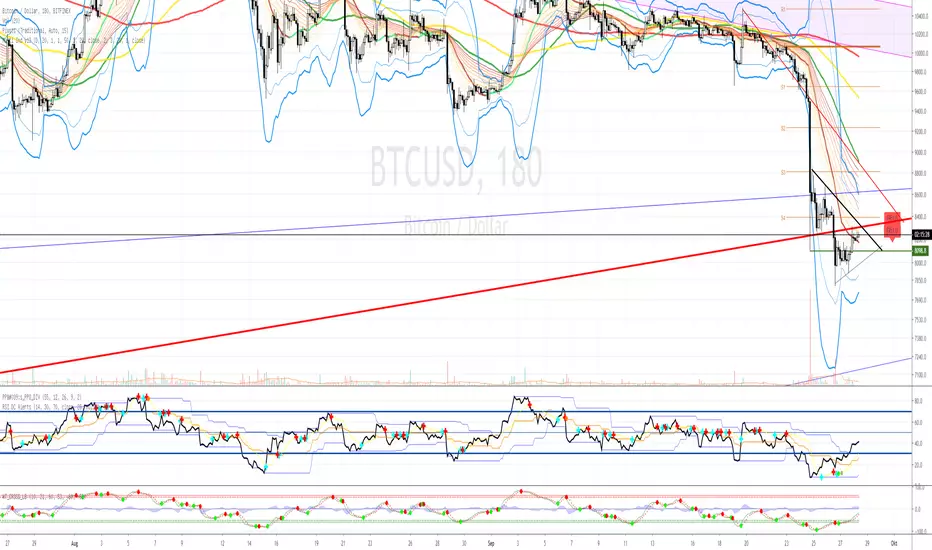
Multi XXL IdicatorMulti XXL Indicator
Ma s (50,100,200)
Keltner
Bollinger 2 und 3
Future Pivot
Multi Timeframe MA
Ema s 55=>20
Multi XXL IdicatorMulti XXL Indicator
Ma s (50,100,200)
Keltner
Bollinger 2 und 3
Future Pivot
Multi Timeframe MA


Polyrithmic MAsThis is the 20/50/100/150 mas grouped together and coloured for quick analysis
The 20 can be used as the line to close a trade and is colored white

10/20/50/100/200 SMA'sMultiple MA's to get a good feel for momentum and interim supports and resistances

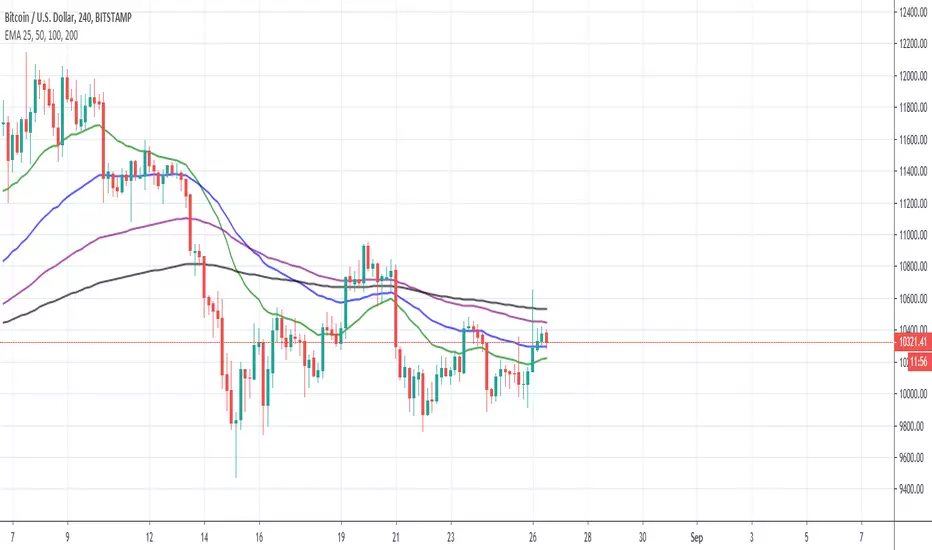
EMA 25, 50, 100, 200Use this script to reduce the amount of indicators. The darker the color, the longer timeframe the EMA is.
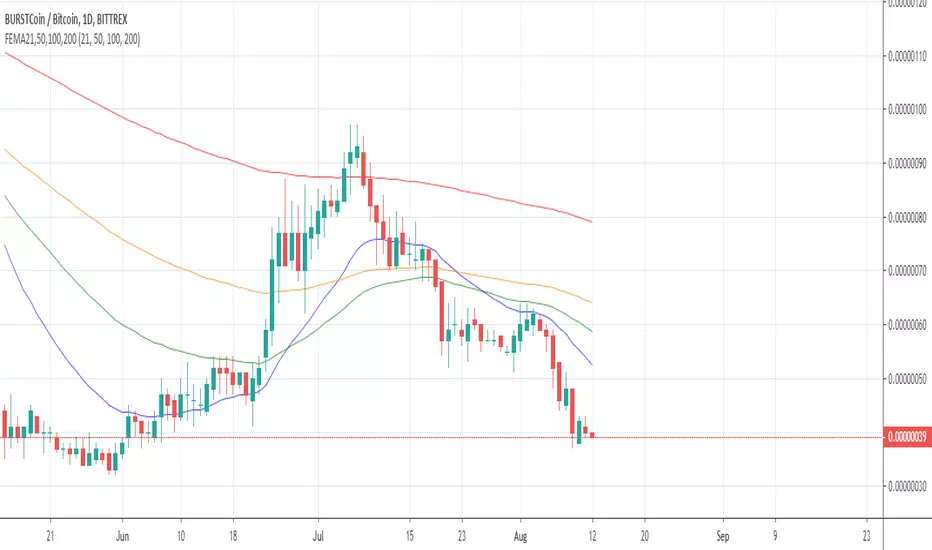
MikeD10375 Fibonacci Moving Averages6 Exponential Moving Average Lines attached to Fibonacci Numbers along with 3 Simple Moving Averages using the popular 50,100, and 200 standard.

Sextuple Exponencial Moving Averages Bompart EMA's 3, 10, 16, 50, 100, 200 ... best for intra-day analysis

6 EMAs + VWAP by Felipe FacchinIndicador personalizado com 6 EMAs + VWAP. Recomendo utilização do tema escuro e EMAs 50, 100 e 200.

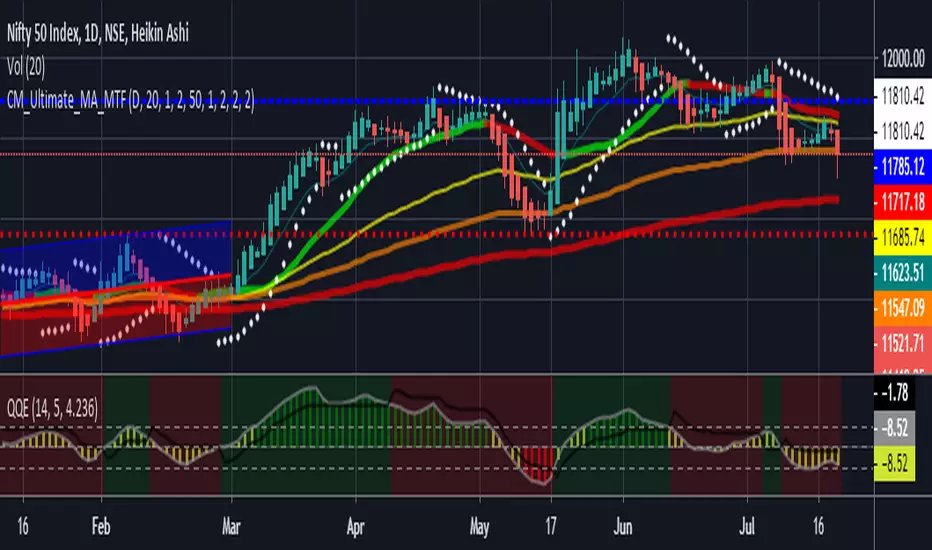

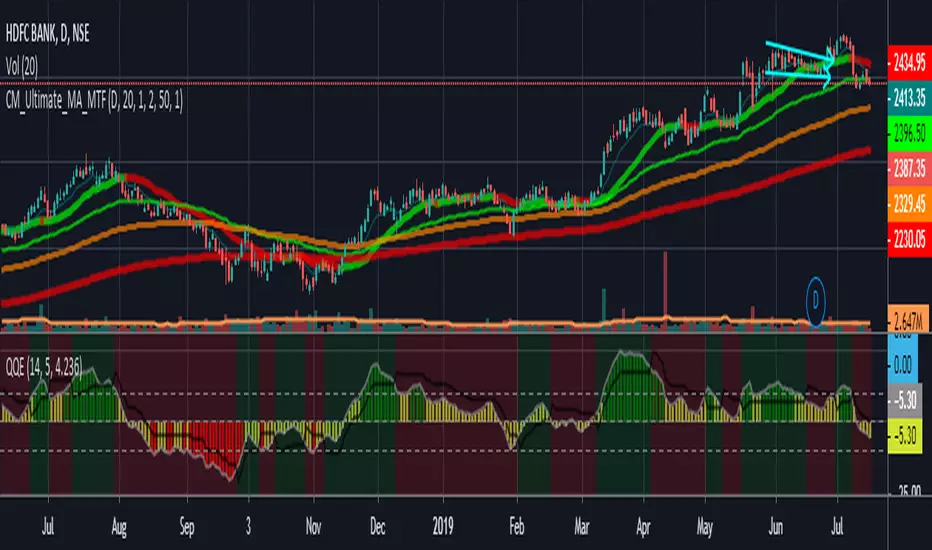
Ultimate_MA_MTF_CMChrisMoody MTF Ultimate Moving Average combined
with Exponential Moving Averages with Price line, i needed to analyze stocks
I have added 50, 100, 200 Period Moving Average to Chrismoody's UMA_MTF
Chris's MA can be found at
i have just combined these averages in a script major contribution goes to chris not me
please look at his indicator still is million times better than me
MBK Multi MAsHello,
this is a Moving Average (9,25,50,100,200,300,400,500) very simple script with golden cross and death cross spots.
feel free to modify it as you like.
trade safe


Squeeze PRO Arrows [Makit0]SQUEEZE PRO INDICATOR v0.5Beta
Script based in:
original John Carter's ideas (SQUEEZE & SQUEEZE PRO)
LazyBear's script (Squeeze Momentum Indicator)
USE IT IN CONJUNCTION WITH THE SQUEEZE PRO INDICATOR
This system is based in the volatility reversion to the mean: volatility contraction leads to volatility expansion and the other way on
The arrows signal is a warning of volatility compression, more often than not this leads to a expansion of volatility and a move in the action price usually bigger than the expected move
Be aware of the trend direction don't take the arrows direction as certanty, use instead the momentum histogram in the Squeeze PRO Indicator to see the slope direction
By default the arrows are setted at 5 dots, they fire in the sixth dot after 5 dots of the same color. Try differents values to get more or less signals
here are 3 levels of compression:
Level 1: ORANGE, the lesser compresion level
Level 2: RED, the normal level marked by the original squeeze indicator
Level 3: YELLOW, the max compression level
The more the compression the bigger the after move
Simple and Exponential Moving Averages
There are 2 groups of Moving Averages within the indicator, the 8 & 21 EMAs and the 50, 100 & 200 SMAs
They are disabled by default, turn it on at your peace
Please check the John Carter's book (Mastering the Trade) and attend his webinars for more insight about the squeeze & squeeze pro systems
I'm starting at trading and learning every day, I attended one of his webinars about the Squeeze Pro, and with help of the LazyBear's Squeeze Momentum Indicator code up the Squeeze PRO.
Please be aware, I'm not an expert trader, only a developer with an idea: learn to pull out money from the market in a consistent way.
This is a Beta version, please feel free to comment and give feedback, anything you consider iteresting, the more you elaborate the better :D
Thanks you all!!!
