Multiple Ema 20/50/100Multiple Ema 20/50/100 and you can add more EMA Plot easily by changing the codes.
Search in scripts for "纳斯达克100场外基金+投资回报率"


50, 100, 200 EMAsA simple script that displays the 50, 100, and 200-period exponential moving averages. Reduce clutter by combining them into one indicator!

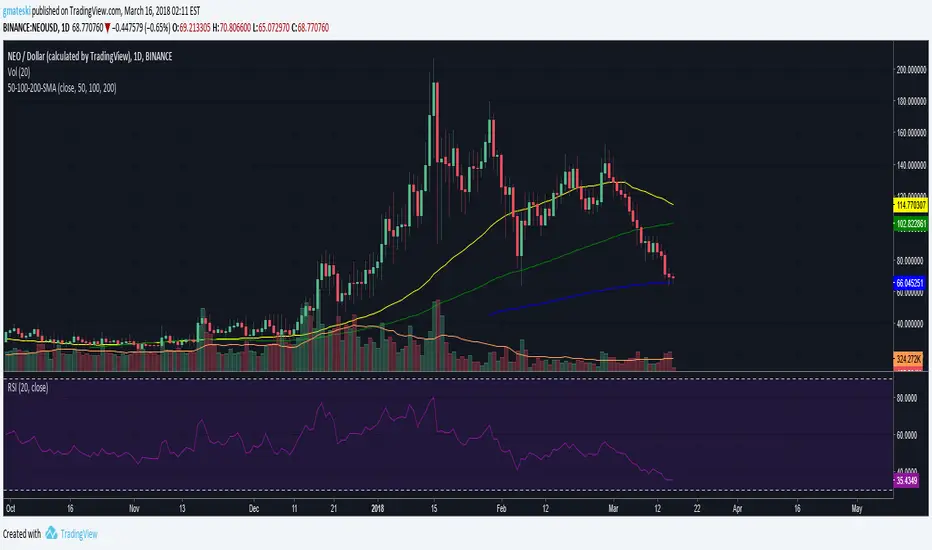
50, 100, 200 SMAsA simple script that displays the 50, 100, and 200-period simple moving averages. Reduce clutter by combining them into one indicator!

50,100,200 MA by CryptoLife71(FIXED)Updated the code by CryptoLife71 so that the 200ma shows correctly.


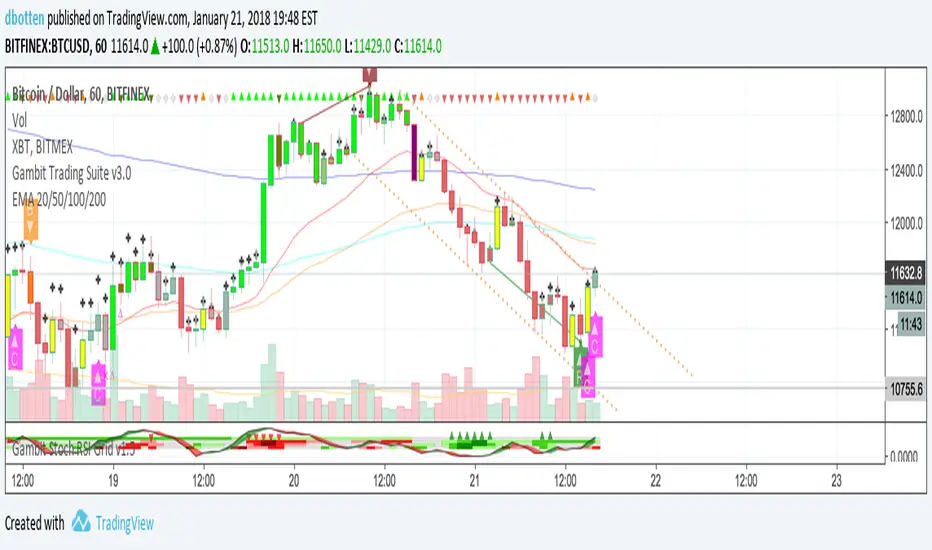
EMA 20/50/100/200Plots exponential moving average on four timeframes at once for rapid indication of momentum shift as well as slower-moving confirmations.
Displays EMA 20, 50, 100, and 200... default colors are hotter for faster timeframes, cooler for slower ones
DECL: 3 X Moving Average (50, 100 and 200 day)Basic Moving Average with 3 different intervals. Default: 50 day (blue), 100 day (red) and 200 day (purple)


BB 100 with Barcolors6/19/15 I added confirmation highlight bars to the code. In other words, if a candle bounced off the lower Bollinger band, it needed one more close above the previous candle to confirm a higher probability that a change in investor sentiment has reversed. Same is true for upper Bollinger band bounces. I also added confirmation highlight bars to the 100 sma (the basis). The idea is that lower and upper bands are potential points of support and resistance. The same is true of the basis if a trend is to continue. 6/28/15 I added a plotshape to identify closes above/below TLine. One thing this system points out is it operates best in a trend reversal. Consolidations will whipsaw the indicator too much. I have found that when this happens, if using daily candles, switch to hourly, 30 min, etc., to catch a better signal. Nothing moves in a straight line. As with any indicator, it is a tool to be used in conjunction with the art AND science of trading. As always, try the indicator for a time so that you are comfortable enough to use real money. This is designed to be used with "BB 25 with Barcolors".

BB 100 with Barcolors6/19/15 I added confirmation highlight bars to the code. In other words, if a candle bounced off the lower Bollinger band, it needed one more close above the previous candle to confirm a higher probability that a change in investor sentiment has reversed. Same is true for upper Bollinger band bounces. I also added confirmation highlight bars to the 100 sma (the basis). The idea is that lower and upper bands are potential points of support and resistance. The same is true of the basis if a trend is to continue. Nothing moves in a straight line. As with any indicator, it is a tool to be used in conjunction with the art AND science of trading. As always, try the indicator for a time so that you are comfortable enough to use real money. This is designed to be used with "BB 25 with Barcolors".
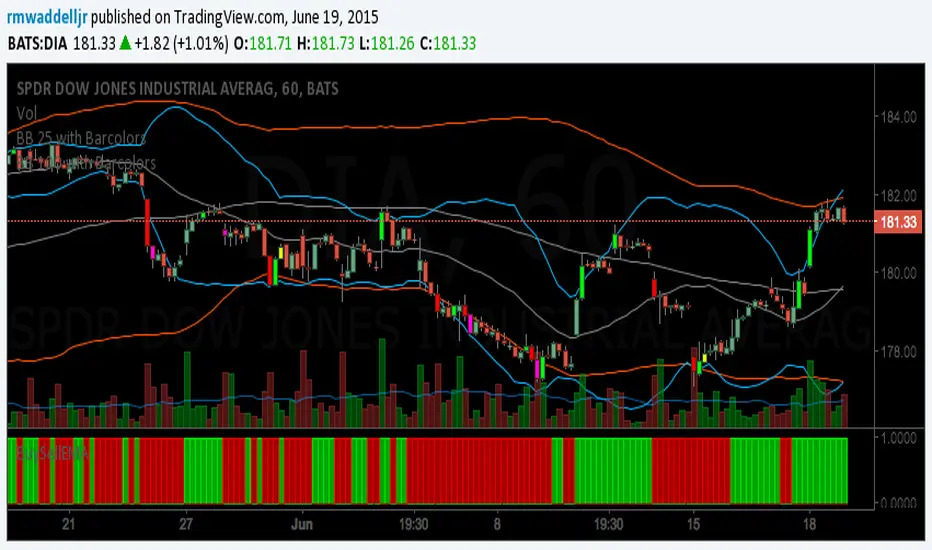
BB 100 with BarcolorsI cleaned up the highlight barcolor to reflect red or lime depending if it closed > or < the open.
The description is in the code. you want to catch bounces off the 25 (upper or lower) and 100 (upper or lower).
Works well on the hourly and 30 min charts. Haven't tested it beyond that. Haven't tested Forex, just equities.

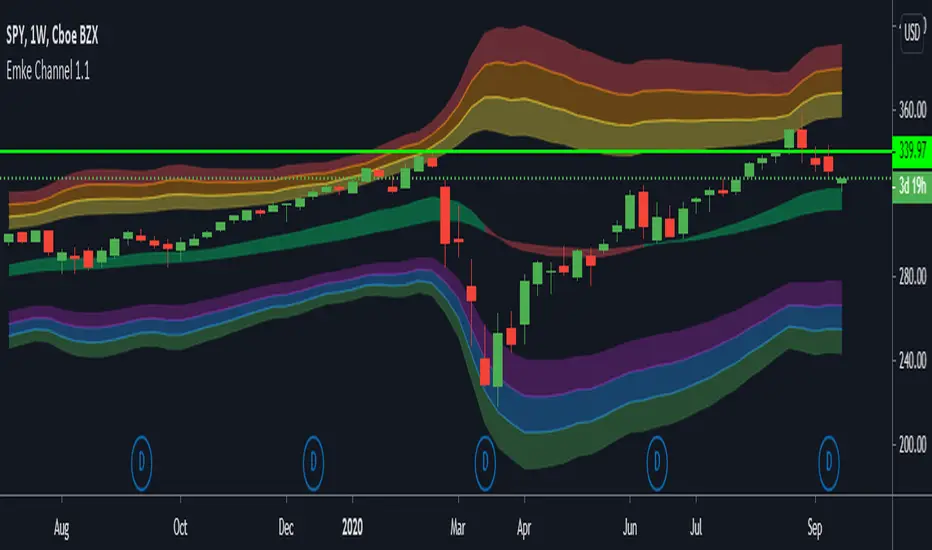
EMA Keltner Channel 1D100/200 EMAs, along with Keltner Bands based off them. Colors correspond to actions you should be ready to take in the area. Use to set macro mindset.
Uses the security function to display only the 1D values.
Red= Bad
Orange = Not as Bad, but still Bad.
Yellow = Warning, might also be Bad.
Purple = Dip a toe in.
Blue = Give it a shot but have a little caution.
Green = It's second mortgage time.
Multi-Timeframe Trend Table - EMA Based Trend Analysis📊 Stay Aligned with Higher Timeframe Trends While Scalping
This powerful indicator displays real-time trend direction for 1-hour and 4-hour timeframes in a clean, easy-to-read table format. Perfect for traders who want to align their short-term trades with higher timeframe momentum.
🎯 Key Features
Multi-Timeframe Analysis: Monitor 1H and 4H trends while trading on any timeframe (3min, 5min, 15min, etc.)
EMA-Based Logic: Uses proven EMA 50 and EMA 100 crossover methodology
Visual Clarity: Color-coded table with green (uptrend) and red (downtrend) indicators
Customizable Display: Toggle EMA values and adjust table position
Real-Time Updates: Automatically refreshes with each bar close
Lightweight: Minimal resource usage with efficient data requests
📈 How It Works
The indicator determines trend direction using a simple but effective rule:
UPTREND: Price is above both EMA 50 AND EMA 100
DOWNTREND: Price is below either EMA 50 OR EMA 100
🔧 Settings
Show EMA Values: Display actual EMA 50/100 values in the table
Table Position: Choose from 4 corner positions (Top Right, Top Left, Bottom Right, Bottom Left)
Plot Current EMAs: Optional display of EMA lines on your current chart
💡 Trading Applications
✅ Trend Confirmation: Ensure your trades align with higher timeframe direction
✅ Risk Management: Avoid counter-trend trades in strong directional markets
✅ Entry Timing: Use lower timeframe for entries while respecting higher timeframe bias
✅ Scalping Enhancement: Perfect for 1-5 minute scalping with higher timeframe context
🎨 Visual Design
Clean, professional table design
Intuitive color coding (Green = Up, Red = Down)
Compact size that doesn't obstruct your chart
Clear typography for quick reading
📋 Perfect For
Day traders and scalpers
Swing traders seeking trend confirmation
Multi-timeframe analysis enthusiasts
Traders who want simple, effective trend identification
🚀 Easy Setup
Add to any chart (works on all timeframes)
Customize table position and settings
Start trading with higher timeframe awareness
Watch the table update automatically
No complex configurations needed - just add and trade!
This indicator is designed for educational and informational purposes. Always combine with proper risk management and your own analysis.

MA Crossover BIFTY BNF with Broker Inputs//@version=6
strategy("MA Crossover with Broker Inputs", overlay=true, margin_long=100, margin_short=100, process_orders_on_close=true)
// === BROKER & ORDER SETTINGS ===
broker = input.string("Dhan", title="Broker", options= )
orderType = input.string("MKT", title="Order Type", options= )
clientID = input.string("", title="Client ID (Optional)")
secretKey = input.string("", title="Secret Key (from JSON)")
// === INSTRUMENT SELECTION ===
instrument = input.string("BANKNIFTY", title="Select Instrument", options= )
expiryMode = input.string("Auto", title="Expiry Mode", options= )
manualExpiry = input.string("17Dec2025", title="Manual Expiry Date (if Manual Mode)")
optionType = input.string("CE", title="Option Type", options= )
strikeSel = input.string("ATM", title="Strike Selection", options= )
// === RISK MANAGEMENT ===
stopLossPts = input.int(50, title="Stop Loss (points)")
takeProfitPts = input.int(100, title="Take Profit (points)")
// === STRATEGY LOGIC: Moving Average Crossover ===
fastLength = input.int(9, title="Fast MA Length")
slowLength = input.int(18, title="Slow MA Length")
price = close
maFast = ta.sma(price, fastLength)
maSlow = ta.sma(price, slowLength)
// Crossover Long
if (ta.crossover(maFast, maSlow))
strategy.entry("Long", strategy.long, comment="MA Crossover Long")
// Crossunder Short
if (ta.crossunder(maFast, maSlow))
strategy.entry("Short", strategy.short, comment="MA Crossover Short")
// Apply SL and TP
strategy.exit("Exit Long", from_entry="Long", stop=close - stopLossPts, limit=close + takeProfitPts)
strategy.exit("Exit Short", from_entry="Short", stop=close + stopLossPts, limit=close - takeProfitPts)
// === PLOTS ===
plot(maFast, color=color.green, title="Fast MA")
plot(maSlow, color=color.red, title="Slow MA")
