VSA Volume OverlaySimple. When the VSA volume is above the average volume the line will draw orange. When below average volume plot , it will draw white.
Search in scripts for "纳斯达克指数期货cfd"

dabilThe strategy is probably to go short or long with the trend depending on the case, but if all time units 1 minute then 3 minutes then 5 minutes then 15 minutes then 1 hour all show the same direction, but first the 1 hour must be bullish in which the 1 hour candle closes above the previous one, for example if the trend is bearish then the market wants to change direction, then a 1 hour bullish close must then be followed by a 1 hour bearish close below the bullish candle, then another bullish candle must shoot above the previous bullish candle, then 15 minutes also shoot above the previous 15 bullish candles, then 1 and 2...3.5. Then I can rise with the market by only covering the last 15 bullish candles with my stop loss, if my SL is 50 pips then I want 100 pips and then I'm out.

MACD Positive & Negative AlertThe MACD (Moving Average Convergence Divergence) is a momentum and trend-following indicator that helps traders identify the strength and direction of a trend, spot potential reversals, and fine-tune entry/exit timing.
Core Components
- MACD Line:
The difference between the 12-period and 26-period EMA (Exponential Moving Averages). This line highlights shifts in momentum and identifies the prevailing trend direction.
- Signal Line:
A 9-period EMA of the MACD line, acting as a trigger for buy/sell signals. When the MACD line crosses above the signal line, it suggests a bullish signal; when it crosses below, it suggests a bearish one.
- Histogram:
Shows the difference between the MACD line and the signal line as a bar graph. The histogram helps traders gauge the strength of the momentum and can warn of possible reversals. A rapidly growing histogram means strengthening momentum, while a shrinking one indicates weakening momentum.
Main Uses
- Trend Identification:
A positive MACD value typically signals a bullish trend, while a negative value signals a bearish trend.
- Momentum Analysis:
Divergences between MACD and price can warn of upcoming reversals. Increasing MACD histogram bars confirm strong momentum; shrinking bars suggest consolidation or reversal.
- Signal Generation:
Crossovers between the MACD line and the signal line generate trade signals—bullish (buy) if the MACD moves above the signal, bearish (sell) if it falls below l.
Example Interpretation
- MACD Crossover:
If the MACD line crosses above the signal line, it's often considered a buy signal; a cross below is a sell signal.
- Zero Line Cross:
If the MACD histogram moves from below zero to above, this is considered a bullish momentum shift; above zero to below is a bearish move.
The MACD is most effective in trending markets and should ideally be used alongside additional indicators for robust trading decisions.

FX Market Sessions serkanMarket stock market opening and closing indicators
Opening and closing time ranges
Frankfurt
London
CM
New York opening and closing time ranges
ST Fractals With Percentage DifferenceThis indicator identifies Williams Fractals on your price chart, helping traders spot potential reversal points and short-term highs and lows. This changes default value to 1 and adds percentage difference similar to ST Fractals option on MT5
How It Works:
Up Fractals (▲): Plotted above a candle that is higher than its surrounding candles — a potential short-term top.
Down Fractals (▼): Plotted below a candle that is lower than its surrounding candles — a potential short-term bottom.
Fractals are only drawn if the price difference from the next candle exceeds a minimum percentage, to avoid signals caused by small fluctuations.
The script ensures that both up and down fractals never appear on the same candle, keeping your chart clear.
Settings:
Periods (n): Determines how many candles before and after are considered to find a fractal. Default: 2.
Min % Difference: Filters out insignificant fractals by requiring a minimum difference from the next candle. Default: 0.01%.
Usage Tips:
Can be used to identify support and resistance levels.
Often combined with trend indicators or moving averages to confirm reversals.
Works best in markets with clear trends or volatility, rather than very flat markets.
Visuals:
Green triangle ▲ → Up Fractal (potential top)
Red triangle ▼ → Down Fractal (potential bottom)

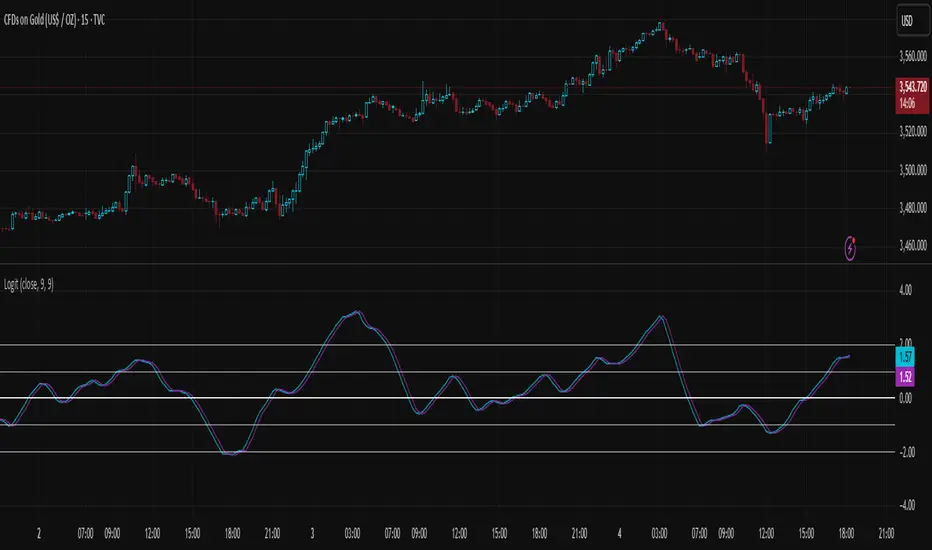
Logit Transform -EasyNeuro-Logit Transform
This script implements a novel indicator inspired by the Fisher Transform, replacing its core arctanh-based mapping with the logit transform. It is designed to highlight extreme values in bounded inputs from a probabilistic and statistical perspective.
Background: Fisher Transform
The Fisher Transform, introduced by John Ehlers , is a statistical technique that maps a bounded variable x (between a and b) to a variable approximately following a Gaussian distribution. The standard form for a normalized input y (between -1 and 1) is F(y) = 0.5 * ln((1 + y)/(1 - y)) = arctanh(y).
This transformation has the following properties:
Linearization of extremes:
Small deviations around the mean are smooth, while movements near the boundaries are sharply amplified.
Gaussian approximation:
After transformation, the variable approximates a normal distribution, enabling analytical techniques that assume normality.
Probabilistic interpretation:
The Fisher Transform can be linked to likelihood ratio tests, where the transform emphasizes deviations from median or expected values in a statistically meaningful way.
In technical analysis, this allows traders to detect turning points or extreme market conditions more clearly than raw oscillators alone.
Logit Transform as a Generalization
The logit function is defined for p between 0 and 1 as logit(p) = ln(p / (1 - p)).
Key properties of the logit transform:
Maps probabilities in (0, 1) to the entire real line, similar to the Fisher Transform.
Emphasizes values near 0 and 1, providing sharp differentiation of extreme states.
Directly interpretable in terms of odds and likelihood ratios: logit(p) = ln(odds).
From a statistical viewpoint, the logit transform corresponds to the canonical link function in binomial generalized linear models (GLMs). This provides a natural interpretation of the transformed variable as the logarithm of the likelihood ratio between success and failure states, giving a rigorous probabilistic framework for extreme value detection.
Theoretical Advantages
Distributional linearization:
For inputs that can be interpreted as probabilities, the logit transform creates a variable approximately linear in log-odds, similar to Fisher’s goal of Gaussianization but with a probabilistic foundation.
Extreme sensitivity:
By amplifying small differences near 0 or 1, it allows for sharper detection of market extremes or overbought/oversold conditions.
Statistical interpretability:
Provides a link to statistical hypothesis testing via likelihood ratios, enabling integration with probabilistic models or risk metrics.
Applications in Technical Analysis
Oscillator enhancement:
Apply to RSI, Stochastic Oscillators, or other bounded indicators to accentuate extreme values with a well-defined probabilistic interpretation.
Comparative study:
Use alongside the Fisher Transform to analyze the effect of different nonlinear mappings on market signals, helping to uncover subtle nonlinearity in price behavior.
Probabilistic risk assessment:
Transforming input series into log-odds allows incorporation into statistical risk models or volatility estimation frameworks.
Practical Considerations
The logit diverges near 0 and 1, requiring careful scaling or smoothing to avoid numerical instability. As with the Fisher Transform, this indicator is not a standalone trading signal and should be combined with complementary technical or statistical indicators.
In summary, the Logit Transform builds upon the Fisher Transform’s theoretical foundation while introducing a probabilistically rigorous mapping. By connecting extreme-value detection to odds ratios and likelihood principles, it provides traders and analysts with a mathematically grounded tool for examining market dynamics.
Multi-Timeframe HTS Retest Strategy v6Multi-Timeframe HTS Retest Strategy v6 is a trend-following tool designed to detect high-probability retest entries aligned with higher timeframe direction. The indicator applies HTS bands (short & long) on both the current and higher timeframe (4x–8x multiplier) to confirm market bias.
A strong trend is validated when HTS bands separate on the higher timeframe. On the lower timeframe, the strategy tracks price behavior relative to the bands: after breaking outside, price must retest either the fast (blue) or slow (red) band, confirmed by a rejection candle. This generates precise BUY or SELL retest signals.
Features include flexible average methods (RMA, EMA, SMA, etc.), customizable cross detection (final cross, 4 crosses, or both), volume-based retest conditions, and clear visual signals (dots for trend start, triangles for retests). Alerts are integrated for automation.
This strategy is suitable for forex, crypto, indices, and stocks, supporting both scalping and swing trading.

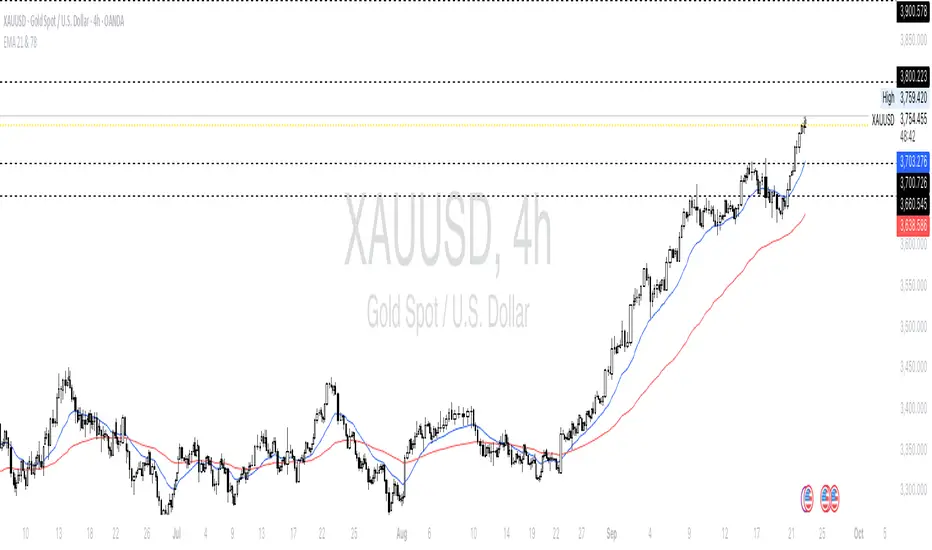
EMA 21 & 78 - With Instrument Nameonly add EMA21 and 78, I saw the 21 and 78 period is the most favor period when trading with gold
Sequential Pattern Strength [QuantAlgo]🟢 Overview
The Sequential Pattern Strength indicator measures the power and sustainability of consecutive price movements by tracking unbroken sequences of up or down closes. It incorporates sequence quality assessment, price extension analysis, and automatic exhaustion detection to help traders identify when strong trends are losing momentum and approaching potential reversal or continuation points.
🟢 How It Works
The indicator's key insight lies in its sequential pattern tracking system, where pattern strength is measured by analyzing consecutive price movements and their sustainability:
if close > close
upSequence := upSequence + 1
downSequence := 0
else if close < close
downSequence := downSequence + 1
upSequence := 0
The system calculates sequence quality by measuring how "perfect" the consecutive moves are:
perfectMoves = math.max(upSequence, downSequence)
totalMoves = math.abs(bar_index - ta.valuewhen(upSequence == 1 or downSequence == 1, bar_index, 0))
sequenceQuality = totalMoves > 0 ? perfectMoves / totalMoves : 1.0
First, it tracks price extension from the sequence starting point:
priceExtension = (close - sequenceStartPrice) / sequenceStartPrice * 100
Then, pattern exhaustion is identified when sequences become overextended:
isExhausted = math.abs(currentSequence) >= maxSequence or
math.abs(priceExtension) > resetThreshold * math.abs(currentSequence)
Finally, the pattern strength combines sequence length, quality, and price movement with momentum enhancement:
patternStrength = currentSequence * sequenceQuality * (1 + math.abs(priceExtension) / 10)
enhancedSignal = patternStrength + momentum * 10
signal = ta.ema(enhancedSignal, smooth)
This creates a sequence-based momentum indicator that combines consecutive movement analysis with pattern sustainability assessment, providing traders with both directional signals and exhaustion insights for entry/exit timing.
🟢 Signal Interpretation
Positive Values (Above Zero): Sequential pattern strength indicating bullish momentum with consecutive upward price movements and sustained buying pressure = Long/Buy opportunities
Negative Values (Below Zero): Sequential pattern strength indicating bearish momentum with consecutive downward price movements and sustained selling pressure = Short/Sell opportunities
Zero Line Crosses: Pattern transitions between bullish and bearish regimes, indicating potential trend changes or momentum shifts when sequences break
Upper Threshold Zone: Area above maximum sequence threshold (2x maxSequence) indicating extremely strong bullish patterns approaching exhaustion levels
Lower Threshold Zone: Area below negative threshold (-2x maxSequence) indicating extremely strong bearish patterns approaching exhaustion levels

Stacey Burke Signal Day LTE“Previously published as ‘Day Zero Fakeout Detector MTF’”
Stacey Burke Signal Day LTE
Automatic detection of Day Zero, Inside Days, and Outside Days for Stacey Burke’s intraday playbook
🔎 Stacey Burke’s Signal Days
This indicator highlights the key daily patterns that often lead to high-probability intraday setups in Stacey Burke’s methodology:
1️⃣ Day Zero
The reset days within a 3-day cycle (e.g. breakout → continuation → exhaustion/reversal).
Can mark the beginning of a new directional phase.
Trades back inside the prior range after a Peak Formation High (PFH) or Peak Formation Low (PFL).
Bias: Look for measured parabolic session moves. When combined with trend following indicators, these signal days can be very powerful.
2️⃣ Inside Day
A day where the entire range is contained within the prior day’s range.
Signals consolidation and energy build-up.
Often leads to explosive breakouts in the next session.
Bias: Trade breakouts of the inside day’s high/low or breakout reversal in the session at key timings in the direction of higher timeframe bias. When combined with trend following indicators, these signal days can be very powerful.
3️⃣ Outside Day (Engulfing Day)
`
A day where the range is larger than the prior day’s range, engulfing both high and low.
Marks trapped traders and fakeouts on both sides.
Often precedes strong continuations or sharp reversals from outside of the ranges.
Bias: Align trades with the true continuation move. When combined with trend following indicators, these signal days can be very powerful.
📌 How They Work Together
Day Zero → Signals the new cycle after PFH/PFL.
Inside Day → Signals compression → expect breakout setups.
Outside Day → Signals exhaustion/fakeouts → expect reversals or continuations.
Together, they give traders a clear daily roadmap for where liquidity sits and when to expect the highest-probability setups.
✅ Example in Practice
Market rallies for 3 days → PFH forms → Day Zero short bias.
Next day prints an Inside Day → watch for breakout continuation short, and breakout reversals.
Later, an Outside Day traps both longs and shorts → the following session offers a clean intraday reversal or continuation trade in line with the underlying MTF trend/bias.
⚙️ Features of This Indicator
Automatic detection of Day Zero, Inside Days, and Outside Days
Multi-Timeframe (MTF) support for cycle alignment
Visual markers for PFH/PFL and consolidation zones
Measured move projections for breakout targets
👉 Stacey Burke Signal Day LTE gives traders just a few of the most important signal days — Day Zero, Inside Day, and Outside Day — to structure their intraday trades around fake outs, breakouts, and reversals within the daily cycles of the week. (This is work in progress: Next up, FRD/FGD's, 3-day cycle detecting, 3DLs, 3DSs).

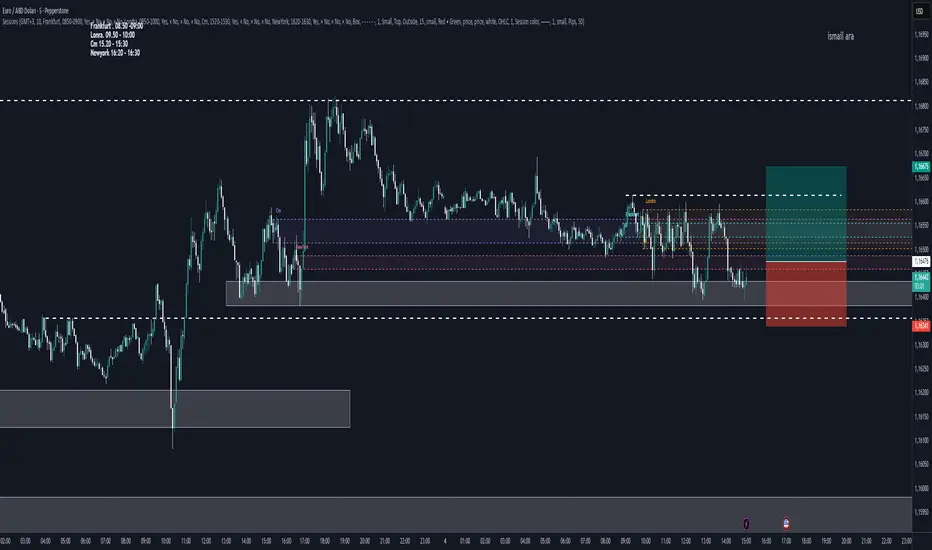
Clean Zone + SL/TP (Latest Only)📌 Description
Clean Zone + SL/TP (Latest Only) is an indicator designed to highlight the most recent supply or demand zone based on pivot highs/lows, and automatically plot entry, stop loss, and multiple take profit levels.
🔹 Automatic Direction Detection
The script can auto-detect trade direction (Long/Short) using pivot logic, or you can override manually.
🔹 Zone Drawing
Only the latest valid supply (red) or demand (green) zone is displayed.
Zones are extended to the right for a customizable number of bars.
🔹 Entry / SL / TP Levels
Entry, Stop Loss, and TP1/TP2/TP3 levels are plotted automatically.
Targets can be calculated either by zone size or by ATR-based multiples.
Risk/Reward ratios are fully adjustable.
🔹 Customizable Display
Toggle visibility for zones (box), entry/SL/TP lines, and price labels.
Labels show only on the latest bar for a clean chart look.
🎯 Use Case
This tool helps traders quickly identify the cleanest and most recent supply/demand setup and manage trades with predefined risk/reward targets. It’s especially useful for price action traders and those who prefer simple, uncluttered charts.

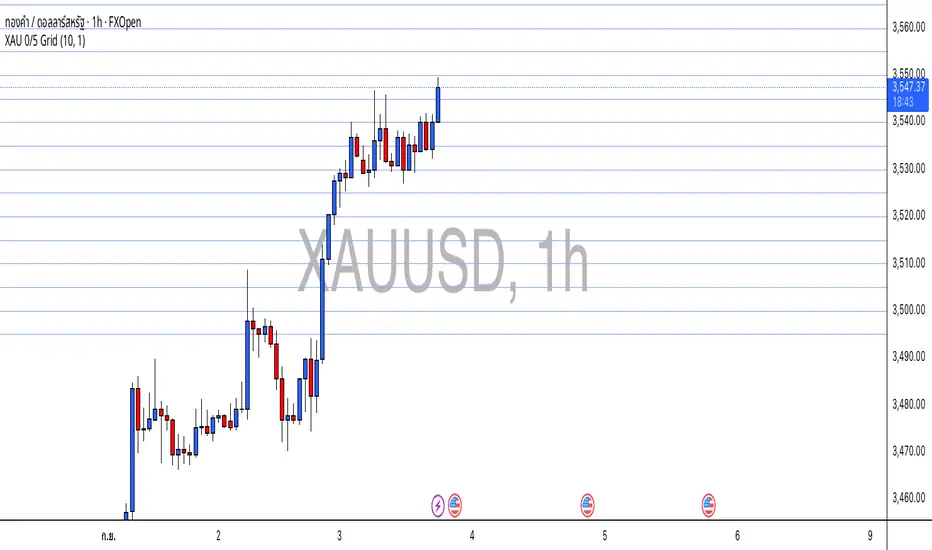
XAU 0/5 GridThis indicator draws horizontal price grids for XAUUSD. It anchors the grid to a base price that ends with 0 or 5, then plots equally spaced levels every 5 price units above and below that base. It’s a clean way to eyeball fixed-interval structure for rough support/resistance zones and simple TP/SL planning.
How it works
Base (0/5):
base = floor(close / 5) × 5 → forces the base to always end with 0/5.
Grid levels:
level_i = base + i × 5, where i is any integer (positive/negative).
The script updates positions only when the base changes to avoid flicker and reduce chart load.
It uses a persistent line array to manage the line objects efficiently.
Usage
Add the indicator to an XAUUSD chart on any timeframe.
Configure in the panel:
Show Lines – toggle visibility
Lines each side – number of lines above/below the base
Line Color / Line Width – appearance
Use the grid as fixed reference levels (e.g., 3490, 3495, 3500, 3505, …) for planning TP/SL or observing grid breaks.
Highlights
Strict 0/5 anchoring keeps levels evenly spaced and easy to read on gold.
Auto-reanchors when price moves to a new 0/5 zone, maintaining a steady view.
Lightweight design: lines are created once and then updated, minimizing overhead.
Limitations
Visualization only — not a buy/sell signal.
Spacing is fixed at 5 price units, optimized for XAUUSD. If used on other symbols/brokers with different tick scales, adjust the logic accordingly.
Grid lines do not guarantee support/resistance; always combine with broader market context.
X-Scalp by LogicatX-Scalp by Logicat — Clean-Range MTF Scalper
Turn noisy intraday action into clear, actionable scalps. X-Scalp builds “Clean Range” zones only when three timeframes agree (default: M30/M15/M5), then waits for a single, high-quality M5 confirmation to print a BUY/SELL label. It’s fast, simple, and ruthlessly focused on precision.
What it does
Clean Range zones: Drawn from the last completed M30 candle only when M30/M15/M5 align (all green or all red).
Size filter (pips): Ignore tiny, low-value ranges with a configurable minimum height (auto-pip detection included).
Extend-until-mitigated: Zones stretch right and “freeze” on first mitigation (close inside or close beyond, your choice). Optional fade when mitigated.
Laser M5 entries (one per box):
Red M5 bar inside a green zone → SELL
Green M5 bar inside a red zone → BUY
Prints once per zone on the closed M5 candle—no spam.
Quality of life: Keep latest N zones, customizable colors, optional H4 reference lines, alert conditions for both zone creation and entries.
Why traders love it
Clarity: Filters chop; you see only aligned zones and one clean trigger.
Speed: Designed for scalpers on FX, XAU/USD, indices, and more.
Control: Tune lookback, pip threshold, mitigation logic, and visuals to fit your playbook.
Tips
Use on liquid sessions for best results.
Combine with your risk model (fixed R, partials at mid/edge, etc.).
Backtest different pip filters per symbol.
Disclaimer: No indicator guarantees profits. Trade responsibly and manage risk.

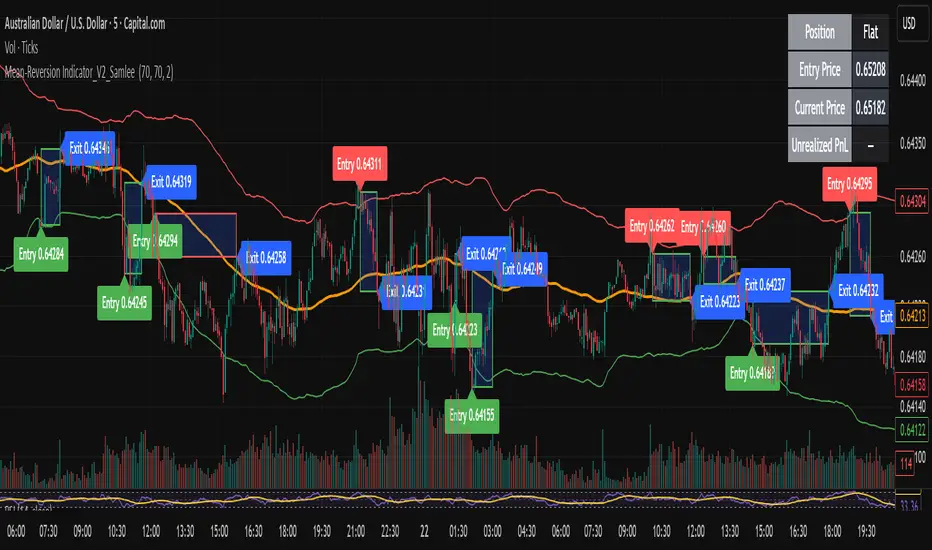
Mean-Reversion Indicator_V2_SamleeOverview
This is the second version of my mean reversion indicator. It combines a moving average with adaptive standard deviation bands to detect when the price deviates significantly from its mean. The script provides automatic entry/exit signals, real-time PnL tracking, and shaded trade zones to make mean reversion trading more intuitive.
Core Logic
Mean benchmark: Simple Moving Average (MA).
Volatility bands: Standard deviation of the spread (close − MA) defines upper and lower bands.
Trading rules:
Price breaks below the lower band → Enter Long
Price breaks above the upper band → Enter Short
Price reverts to MA → Exit position
What’s different vs. classic Bollinger/Keltner
Bandwidth is based on the standard deviation of the price–MA spread, not raw closing prices.
Entry signals use previous-bar confirmation to reduce intrabar noise.
Exit rule is a mean-touch condition, rather than fixed profit/loss targets.
Enhanced visualization:
A shaded box dynamically shows the distance between entry and current/exit price, making it easy to see profit/loss zones over the holding period.
Instant PnL labels display current position side (Long/Short/Flat) and live profit/loss in both pips and %.
Entry and exit points are clearly marked on the chart with labels and exact prices.
These visualization tools go beyond what most indicators provide, giving traders a clearer, more practical view of trade evolution.
Key Features
Automatic detection of position status (Long / Short / Flat).
Chart labels for entries (“Entry”) and exits (“Exit”).
Real-time floating PnL calculation in both pips and %.
Info panel (top-right) showing entry price, current price, position side, and PnL.
Dynamic shading between entry and current/exit price to visualize profit/loss zones.
Usage Notes & Risk
Mean reversion may underperform in strong trending markets; parameters (len_ma, len_std, mult) should be validated per instrument and timeframe.
Works best on relatively stable, mean-reverting pairs (e.g., AUDNZD).
Risk management is essential: use independent stop-loss rules (e.g., limit risk to 1–2% of equity per trade).
This script is provided for educational purposes only and is not financial advice.
PnL Bubble [%] | Fractalyst1. What's the indicator purpose?
The PnL Bubble indicator transforms your strategy's trade PnL percentages into an interactive bubble chart with professional-grade statistics and performance analytics. It helps traders quickly assess system profitability, understand win/loss distribution patterns, identify outliers, and make data-driven strategy improvements.
How does it work?
Think of this indicator as a visual report card for your trading performance. Here's what it does:
What You See
Colorful Bubbles: Each bubble represents one of your trades
Blue/Cyan bubbles = Winning trades (you made money)
Red bubbles = Losing trades (you lost money)
Bigger bubbles = Bigger wins or losses
Smaller bubbles = Smaller wins or losses
How It Organizes Your Trades:
Like a Photo Album: Instead of showing all your trades at once (which would be messy), it shows them in "pages" of 500 trades each:
Page 1: Your first 500 trades
Page 2: Trades 501-1000
Page 3: Trades 1001-1500, etc.
What the Numbers Tell You:
Average Win: How much money you typically make on winning trades
Average Loss: How much money you typically lose on losing trades
Expected Value (EV): Whether your trading system makes money over time
Positive EV = Your system is profitable long-term
Negative EV = Your system loses money long-term
Payoff Ratio (R): How your average win compares to your average loss
R > 1 = Your wins are bigger than your losses
R < 1 = Your losses are bigger than your wins
Why This Matters:
At a Glance: You can instantly see if you're a profitable trader or not
Pattern Recognition: Spot if you have more big wins than big losses
Performance Tracking: Watch how your trading improves over time
Realistic Expectations: Understand what "average" performance looks like for your system
The Cool Visual Effects:
Animation: The bubbles glow and shimmer to make the chart more engaging
Highlighting: Your biggest wins and losses get extra attention with special effects
Tooltips: hover any bubble to see details about that specific trade.
What are the underlying calculations?
The indicator processes trade PnL data using a dual-matrix architecture for optimal performance:
Dual-Matrix System:
• Display Matrix (display_matrix): Bounded to 500 trades for rendering performance
• Statistics Matrix (stats_matrix): Unbounded storage for complete statistical accuracy
Trade Classification & Aggregation:
// Separate wins, losses, and break-even trades
if val > 0.0
pos_sum += val // Sum winning trades
pos_count += 1 // Count winning trades
else if val < 0.0
neg_sum += val // Sum losing trades
neg_count += 1 // Count losing trades
else
zero_count += 1 // Count break-even trades
Statistical Averages:
avg_win = pos_count > 0 ? pos_sum / pos_count : na
avg_loss = neg_count > 0 ? math.abs(neg_sum) / neg_count : na
Win/Loss Rates:
total_obs = pos_count + neg_count + zero_count
win_rate = pos_count / total_obs
loss_rate = neg_count / total_obs
Expected Value (EV):
ev_value = (avg_win × win_rate) - (avg_loss × loss_rate)
Payoff Ratio (R):
R = avg_win ÷ |avg_loss|
Contribution Analysis:
ev_pos_contrib = avg_win × win_rate // Positive EV contribution
ev_neg_contrib = avg_loss × loss_rate // Negative EV contribution
How to integrate with any trading strategy?
Equity Change Tracking Method:
//@version=6
strategy("Your Strategy with Equity Change Export", overlay=true)
float prev_trade_equity = na
float equity_change_pct = na
if barstate.isconfirmed and na(prev_trade_equity)
prev_trade_equity := strategy.equity
trade_just_closed = strategy.closedtrades != strategy.closedtrades
if trade_just_closed and not na(prev_trade_equity)
current_equity = strategy.equity
equity_change_pct := ((current_equity - prev_trade_equity) / prev_trade_equity) * 100
prev_trade_equity := current_equity
else
equity_change_pct := na
plot(equity_change_pct, "Equity Change %", display=display.data_window)
Integration Steps:
1. Add equity tracking code to your strategy
2. Load both strategy and PnL Bubble indicator on the same chart
3. In bubble indicator settings, select your strategy's equity tracking output as data source
4. Configure visualization preferences (colors, effects, page navigation)
How does the pagination system work?
The indicator uses an intelligent pagination system to handle large trade datasets efficiently:
Page Organization:
• Page 1: Trades 1-500 (most recent)
• Page 2: Trades 501-1000
• Page 3: Trades 1001-1500
• Page N: Trades to
Example: With 1,500 trades total (3 pages available):
• User selects Page 1: Shows trades 1-500
• User selects Page 4: Automatically falls back to Page 3 (trades 1001-1500)
5. Understanding the Visual Elements
Bubble Visualization:
• Color Coding: Cyan/blue gradients for wins, red gradients for losses
• Size Mapping: Bubble size proportional to trade magnitude (larger = bigger P&L)
• Priority Rendering: Largest trades displayed first to ensure visibility
• Gradient Effects: Color intensity increases with trade magnitude within each category
Interactive Tooltips:
Each bubble displays quantitative trade information:
tooltip_text = outcome + " | PnL: " + pnl_str +
"\nDate: " + date_str + " " + time_str +
"\nTrade #" + str.tostring(trade_number) + " (Page " + str.tostring(active_page) + ")" +
"\nRank: " + str.tostring(rank) + " of " + str.tostring(n_display_rows) +
"\nPercentile: " + str.tostring(percentile, "#.#") + "%" +
"\nMagnitude: " + str.tostring(magnitude_pct, "#.#") + "%"
Example Tooltip:
Win | PnL: +2.45%
Date: 2024.03.15 14:30
Trade #1,247 (Page 3)
Rank: 5 of 347
Percentile: 98.6%
Magnitude: 85.2%
Reference Lines & Statistics:
• Average Win Line: Horizontal reference showing typical winning trade size
• Average Loss Line: Horizontal reference showing typical losing trade size
• Zero Line: Threshold separating wins from losses
• Statistical Labels: EV, R-Ratio, and contribution analysis displayed on chart
What do the statistical metrics mean?
Expected Value (EV):
Represents the mathematical expectation per trade in percentage terms
EV = (Average Win × Win Rate) - (Average Loss × Loss Rate)
Interpretation:
• EV > 0: Profitable system with positive mathematical expectation
• EV = 0: Break-even system, profitability depends on execution
• EV < 0: Unprofitable system with negative mathematical expectation
Example: EV = +0.34% means you expect +0.34% profit per trade on average
Payoff Ratio (R):
Quantifies the risk-reward relationship of your trading system
R = Average Win ÷ |Average Loss|
Interpretation:
• R > 1.0: Wins are larger than losses on average (favorable risk-reward)
• R = 1.0: Wins and losses are equal in magnitude
• R < 1.0: Losses are larger than wins on average (unfavorable risk-reward)
Example: R = 1.5 means your average win is 50% larger than your average loss
Contribution Analysis (Σ):
Breaks down the components of expected value
Positive Contribution (Σ+) = Average Win × Win Rate
Negative Contribution (Σ-) = Average Loss × Loss Rate
Purpose:
• Shows how much wins contribute to overall expectancy
• Shows how much losses detract from overall expectancy
• Net EV = Σ+ - Σ- (Expected Value per trade)
Example: Σ+: 1.23% means wins contribute +1.23% to expectancy
Example: Σ-: -0.89% means losses drag expectancy by -0.89%
Win/Loss Rates:
Win Rate = Count(Wins) ÷ Total Trades
Loss Rate = Count(Losses) ÷ Total Trades
Shows the probability of winning vs losing trades
Higher win rates don't guarantee profitability if average losses exceed average wins
7. Demo Mode & Synthetic Data Generation
When using built-in sources (close, open, etc.), the indicator generates realistic demo trades for testing:
if isBuiltInSource(source_data)
// Generate random trade outcomes with realistic distribution
u_sign = prand(float(time), float(bar_index))
if u_sign < 0.5
v_push := -1.0 // Loss trade
else
// Skewed distribution favoring smaller wins (realistic)
u_mag = prand(float(time) + 9876.543, float(bar_index) + 321.0)
k = 8.0 // Skewness factor
t = math.pow(u_mag, k)
v_push := 2.5 + t * 8.0 // Win trade
Demo Characteristics:
• Realistic win/loss distribution mimicking actual trading patterns
• Skewed distribution favoring smaller wins over large wins
• Deterministic randomness for consistent demo results
• Includes jitter effects to prevent visual overlap
8. Performance Limitations & Optimizations
Display Constraints:
points_count = 500 // Maximum 500 dots per page for optimal performance
Pine Script v6 Limits:
• Label Count: Maximum 500 labels per indicator
• Line Count: Maximum 100 lines per indicator
• Box Count: Maximum 50 boxes per indicator
• Matrix Size: Efficient memory management with dual-matrix system
Optimization Strategies:
• Pagination System: Handle unlimited trades through 500-trade pages
• Priority Rendering: Largest trades displayed first for maximum visibility
• Dual-Matrix Architecture: Separate display (bounded) from statistics (unbounded)
• Smart Fallback: Automatic page clamping prevents empty displays
Impact & Workarounds:
• Visual Limitation: Only 500 trades visible per page
• Statistical Accuracy: Complete dataset used for all calculations
• Navigation: Use page input to browse through entire trade history
• Performance: Smooth operation even with thousands of trades
9. Statistical Accuracy Guarantees
Data Integrity:
• Complete Dataset: Statistics matrix stores ALL trades without limit
• Proper Aggregation: Separate tracking of wins, losses, and break-even trades
• Mathematical Precision: Pine Script v6's enhanced floating-point calculations
• Dual-Matrix System: Display limitations don't affect statistical accuracy
Calculation Validation:
// Verified formulas match standard trading mathematics
avg_win = pos_sum / pos_count // Standard average calculation
win_rate = pos_count / total_obs // Standard probability calculation
ev_value = (avg_win * win_rate) - (avg_loss * loss_rate) // Standard EV formula
Accuracy Features:
• Mathematical Correctness: Formulas follow established trading statistics
• Data Preservation: Complete dataset maintained for all calculations
• Precision Handling: Proper rounding and boundary condition management
• Real-Time Updates: Statistics recalculated on every new trade
10. Advanced Technical Features
Real-Time Animation Engine:
// Shimmer effects with sine wave modulation
offset = math.sin(shimmer_t + phase) * amp
// Dynamic transparency with organic flicker
new_transp = math.min(flicker_limit, math.max(-flicker_limit, cur_transp + dir * flicker_step))
• Sine Wave Shimmer: Dynamic glowing effects on bubbles
• Organic Flicker: Random transparency variations for natural feel
• Extreme Value Highlighting: Special visual treatment for outliers
• Smooth Animations: Tick-based updates for fluid motion
Magnitude-Based Priority Rendering:
// Sort trades by magnitude for optimal visual hierarchy
sort_indices_by_magnitude(values_mat)
• Largest First: Most important trades always visible
• Intelligent Sorting: Custom bubble sort algorithm for trade prioritization
• Performance Optimized: Efficient sorting for real-time updates
• Visual Hierarchy: Ensures critical trades never get hidden
Professional Tooltip System:
• Quantitative Data: Pure numerical information without interpretative language
• Contextual Ranking: Shows trade position within page dataset
• Percentile Analysis: Performance ranking as percentage
• Magnitude Scaling: Relative size compared to page maximum
• Professional Format: Clean, data-focused presentation
11. Quick Start Guide
Step 1: Add Indicator
• Search for "PnL Bubble | Fractalyst" in TradingView indicators
• Add to your chart (works on any timeframe)
Step 2: Configure Data Source
• Demo Mode: Leave source as "close" to see synthetic trading data
• Strategy Mode: Select your strategy's PnL% output as data source
Step 3: Customize Visualization
• Colors: Set positive (cyan), negative (red), and neutral colors
• Page Navigation: Use "Trade Page" input to browse trade history
• Visual Effects: Built-in shimmer and animation effects are enabled by default
Step 4: Analyze Performance
• Study bubble patterns for win/loss distribution
• Review statistical metrics: EV, R-Ratio, Win Rate
• Use tooltips for detailed trade analysis
• Navigate pages to explore full trade history
Step 5: Optimize Strategy
• Identify outlier trades (largest bubbles)
• Analyze risk-reward profile through R-Ratio
• Monitor Expected Value for system profitability
• Use contribution analysis to understand win/loss impact
12. Why Choose PnL Bubble Indicator?
Unique Advantages:
• Advanced Pagination: Handle unlimited trades with smart fallback system
• Dual-Matrix Architecture: Perfect balance of performance and accuracy
• Professional Statistics: Institution-grade metrics with complete data integrity
• Real-Time Animation: Dynamic visual effects for engaging analysis
• Quantitative Tooltips: Pure numerical data without subjective interpretations
• Priority Rendering: Intelligent magnitude-based display ensures critical trades are always visible
Technical Excellence:
• Built with Pine Script v6 for maximum performance and modern features
• Optimized algorithms for smooth operation with large datasets
• Complete statistical accuracy despite display optimizations
• Professional-grade calculations matching institutional trading analytics
Practical Benefits:
• Instantly identify system profitability through visual patterns
• Spot outlier trades and risk management issues
• Understand true risk-reward profile of your strategies
• Make data-driven decisions for strategy optimization
• Professional presentation suitable for performance reporting
Disclaimer & Risk Considerations:
Important: Historical performance metrics, including positive Expected Value (EV), do not guarantee future trading success. Statistical measures are derived from finite sample data and subject to inherent limitations:
• Sample Bias: Historical data may not represent future market conditions or regime changes
• Ergodicity Assumption: Markets are non-stationary; past statistical relationships may break down
• Survivorship Bias: Strategies showing positive historical EV may fail during different market cycles
• Parameter Instability: Optimal parameters identified in backtesting often degrade in forward testing
• Transaction Cost Evolution: Slippage, spreads, and commission structures change over time
• Behavioral Factors: Live trading introduces psychological elements absent in backtesting
• Black Swan Events: Extreme market events can invalidate statistical assumptions instantaneously

Indicator 102#M3indicator based on Daily and weekly fib Level. Initial Breakout and breakdowns have been denoted as well


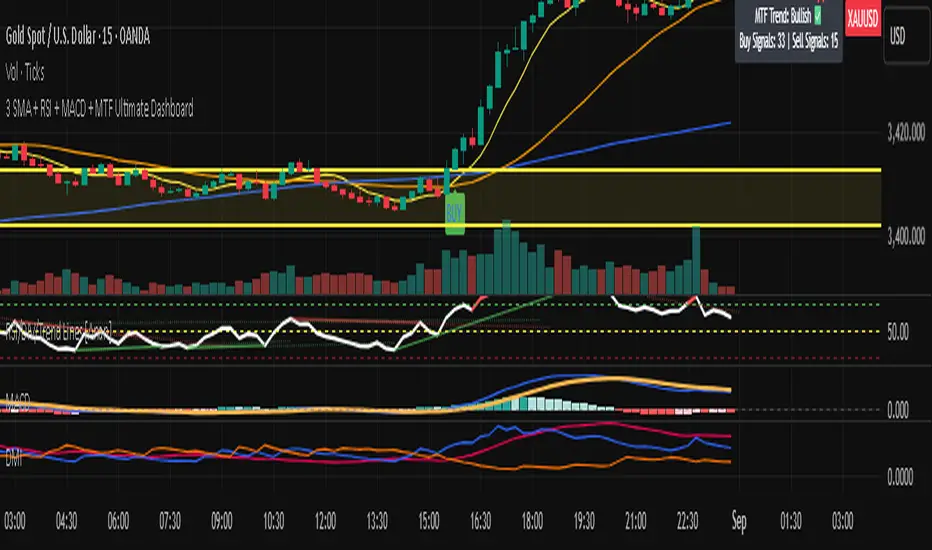
3 SMA + RSI + MACD + MTF Ultimate Dashboard🎯 Overview:
High-precision trading indicator combining trend, momentum, and multi-timeframe confirmation for reliable buy/sell signals in Forex, Crypto, and other markets.
🔹 Core Features:
📈 3 SMAs (7/25/99) – Short, Medium & Long-term trend detection
⚡ RSI Filter – Avoid weak signals (Buy >55 / Sell <45)
💎 MACD with Threshold – Reduce false crossovers
⏱️ Multi-Timeframe Trend (H4) – Confirm overall market direction
✅ Dashboard & Signals:
🟢 Clear Buy & Sell arrows on chart
📊 Live dashboard showing filter status & total signals
🔔 Audio & Push Alerts – Mobile/Desktop/Webhook
💎 Benefits:
⚡ Minimizes false signals
📈 Works on M15, H1, H4, Daily
🎯 Combines trend, momentum, and confirmation filters in one dashboard
⚠️ Note: Signals are generated only after candle close for maximum reliability.

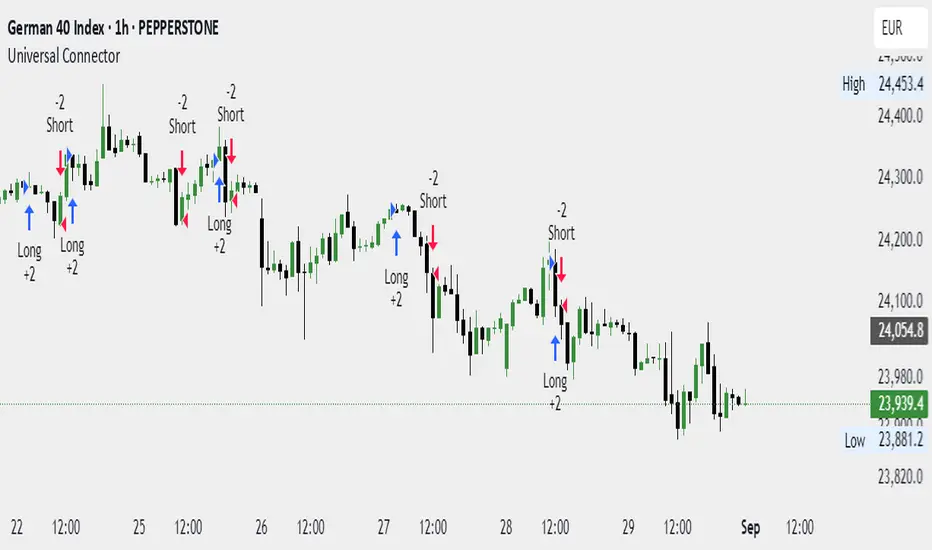
Universal Webhook Connector Demo.This strategy demonstrates how to generate JSON alerts from TradingView for multiple trading platforms.
Users can select platform_name (MT5, TradeLocker, DxTrade, cTrader, etc).
Alerts are constructed in JSON format for webhook execution.
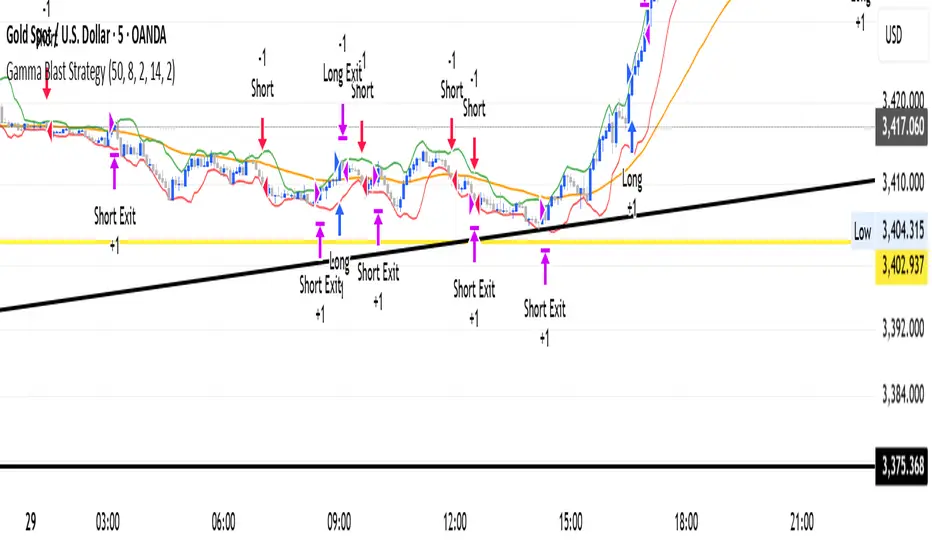
Gamma Blast StrategyGamma Blast Strategy used for quick 2-5 ticks on Buys, but on a sideways market can get up to 15-20 ticks.
Liquidity levels + Order BlocksThis script mark liquidity levels, and monthly, weekly and daily candle open. The order blocks indicator is on construction.
