NYSE Advancing Issues & Volume RatiosOverview
This comprehensive market breadth indicator tracks two essential NYSE ratios that provide deep insights into market sentiment and internal strength:
NYSE Advancing Issues Ratio
NYSE Advancing Volume Ratio
Dual Ratio Analysis
Issues Ratio: Measures the percentage of NYSE stocks advancing vs. total issues
Volume Ratio: Measures the percentage of NYSE volume flowing into advancing stocks
Both ratios displayed as easy-to-read percentages (0-100%)
Customizable Display Options
Toggle each ratio on/off independently
Choose from multiple moving average types (SMA, EMA, WMA)
Adjustable moving average periods
Custom color schemes for better visualization
Reference Levels
50% Line: Market neutral point (gray dashed)
10% Line: Extremely bearish breadth (red dotted)
90% Line: Extremely bullish breadth (green dotted)
Optional background highlighting for extreme readings
Smart Alerts
Cross above/below 50% (neutral) for both ratios
Extreme readings: Above 90% (strong bullish) and below 10% (strong bearish)
Real-time notifications for key market breadth shifts
📈 How to Interpret
Bullish Signals
Above 50%: More stocks/volume advancing than declining
Above 90%: Extremely strong market breadth (rare occurrence)
Divergence: Price making new highs while breadth weakens (potential warning)
Market Timing
Extreme readings (10%/90%) often coincide with market turning points
Breadth thrusts from extreme levels can signal powerful moves
Use with other technical indicators for enhanced timing
Search in scripts for "纳斯达克指数期货cfd"

Floating Dashboard + KDE (v6)Simple indicator that displays ADX, RSI, MACD, ATR, Average Volume and KDE with dynamic Table and Label.

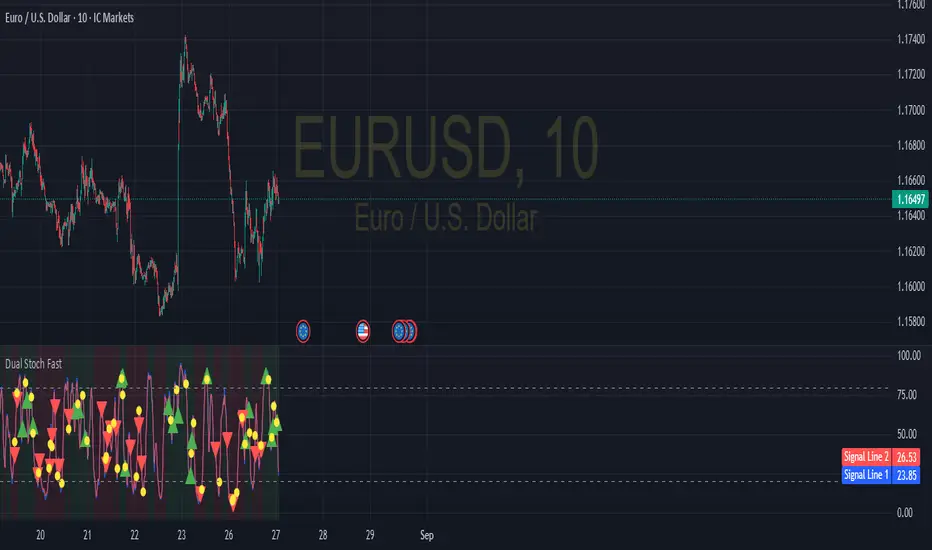
Dual Stochastic with Trend FilterThe "Dual Stochastic with Trend Filter" is an oscillator indicator designed to provide clearer, trend-aligned trading signals. It uses two distinct stochastic oscillators to identify potential entry points and incorporates an optional EMA-based trend filter to ensure that you are trading in the direction of the broader market momentum.
How It Works and How to Use It
This indicator combines two key technical analysis concepts: momentum (via stochastics) and trend (via moving averages).
Core Components:
Dual Stochastic Oscillators:
Signal Line 1 (Blue): A standard stochastic oscillator.
Signal Line 2 (Red): A second stochastic oscillator, often using a different source (like hlcc4) to provide a smoother, more reliable signal.
A buy signal is generated when the Blue Line (d1) crosses above the Red Line (d2).
A sell signal is generated when the Blue Line (d1) crosses below the Red Line (d2).
Trend Filter (Optional):
This feature uses a fast and a slow Exponential Moving Average (EMA) to determine the overall market trend.
When the fast EMA is above the slow EMA, the background will turn green, indicating an uptrend.
When the fast EMA is below the slow EMA, the background will turn red, indicating a downtrend.
This filter can be toggled on or off in the indicator settings.
How to Use:
With Trend Filter Enabled (Recommended):
Long (Buy) Entry: Look for a green triangle buy signal (▲). This signal only appears when:
The Blue Signal Line crosses above the Red Signal Line.
The market is in a confirmed uptrend (green background).
Short (Sell) Entry: Look for a red triangle sell signal (▼). This signal only appears when:
The Blue Signal Line crosses below the Red Signal Line.
The market is in a confirmed downtrend (red background).
Exit Signal:
A yellow circle (●) appears to suggest closing an open trade. This signal is triggered for a long position if either the stochastics have a bearish cross or the trend flips to a downtrend. Conversely, for a short position, it's triggered by a bullish stochastic cross or a trend flip to an uptrend.
With Trend Filter Disabled:
If you turn off the "Use Trend Filter" option, the indicator will function as a simple dual stochastic crossover system.
A green triangle (▲) will appear every time the Blue Line crosses above the Red Line.
A red triangle (▼) will appear every time the Blue Line crosses below the Red Line.
The background coloring and exit signals based on trend flips will be deactivated. This mode is more sensitive but may produce more false signals in choppy markets.
Key Visuals:
Blue Line: The primary signal line.
Red Line: The secondary, often smoother, signal line.
Green Triangle (▲): Bullish entry signal.
Red Triangle (▼): Bearish entry signal.
Yellow Circle (●): Suggested trade exit/stop.
Green/Red Background: Visual confirmation of the current uptrend or downtrend.
By filtering stochastic signals with the dominant trend, this indicator helps traders avoid common pitfalls like entering short positions during a strong uptrend or buying into a bearish market. This alignment of momentum and trend is key to improving signal quality.
Disclaimer
This indicator is provided for educational and informational purposes only and should not be considered as financial advice or a recommendation to buy or sell any asset. All trading and investment decisions are your own sole responsibility.
Trading financial markets involves a high level of risk, and you may lose more than your initial investment. Past performance is not indicative of future results. The signals generated by this indicator are not guaranteed to be accurate, and you should always use this tool in conjunction with other forms of analysis and sound risk management practices.
Before using this indicator in a live trading environment, it is strongly recommended that you backtest it thoroughly and practice with it on a demo account. The author is not responsible for any financial losses you may incur from using this script.
VPOC Harmonics - Liquidity-Weighted Price / Time RatiosVPOC Harmonics - Liquidity-Weighted Price / Time Ratios
Summary
This indicator transforms a swing’s price range, duration, and liquidity profile into a structured set of price-per-bar ratios. By anchoring two points and manually entering the swing’s VPOC (highest-volume price), it generates candidate compression values that unify price, time, and liquidity structure. These values can be applied to chart scaling, harmonic testing, and liquidity-aware market geometry.
________________________________________
Overview
Most swing analysis tools only consider price (ΔP) and time (N bars). This script goes further by incorporating the VPOC (Point of Control) — the price with the highest traded volume — directly into swing geometry.
• Anchors define the swing’s Low (L), High (H), and bar count (N).
• The user manually enters the VPOC (highest-volume price).
• The indicator then computes a suite of ratios that integrate range, duration, and liquidity placement.
The output is a table of liquidity-weighted price-per-bar candidates, designed for compression testing and harmonic analysis across swings and instruments.
________________________________________
How to Use
1. Select a Swing
- Place Anchor A and Anchor B to define the swing’s Low, High, and bar count.
2. Find the VPOC
- Apply TradingView’s Fixed Range Volume Profile tool over the same swing.
- Identify the Point of Control (POC) — the price level with the highest traded volume.
3. Enter the VPOC
- Manually input the POC into the indicator settings.
4. Review Outputs
- The table will display candidate ratios expressed mainly as price-per-bar values.
5. Apply in Practice
- Use the ratios as chart compression inputs or as benchmarks for testing harmonic alignments across swings.
________________________________________
Outputs
Swing & Inputs
• Bars (N): total bar count of the swing.
• Low (L): swing low price.
• High (H): swing high price.
• ΔP = H − L: price range.
• Mid = (L + H) ÷ 2: midpoint price.
• VPOC (V): user-entered highest-volume price.
• Base slope s0 = ΔP ÷ N: average change per bar.
• π-adjusted slope sπ = (π × ΔP) ÷ (2 × N): slope adjusted for half-cycle arc geometry.
________________________________________
VPOC Harmony Ratios (L, H, V, N)
• λ = (V − L) ÷ ΔP: normalized VPOC position within the range.
• R = (V − L) ÷ (H − V): symmetry ratio comparing lower vs. upper segment.
• s1 = (V − L) ÷ N: slope from Low → VPOC.
• s2 = (H − V) ÷ N: slope from VPOC → High.
________________________________________
Blended Means (s1, s2)
These combine the two segment slopes in different ways:
• HM(s1,s2) = 2 ÷ (1/s1 + 1/s2): Harmonic mean, emphasizes the smaller slope.
• GM(s1,s2) = sqrt(s1 × s2): Geometric mean, balances both slopes proportionally.
• RMS(s1,s2) = sqrt((s1² + s2²) ÷ 2): Root-mean-square, emphasizes the larger slope.
• L2 = sqrt(s1² + s2²): Euclidean norm, the vector length of both slopes combined.
________________________________________
Slope Blends
• Quadratic weighting: s_quad = s0 × ((V−L)² + (H−V)²) ÷ (ΔP²)
• Tilted slope: s_tilt = s0 × (0.5 + λ)
• Entropy-scaled slope: s_ent = s0 × H2(λ), with H2(λ) = −
________________________________________
Curvature & Liquidity Extensions
• π-arc × λ: s_arc = sπ × λ
• Liquidity-π: s_piV = sπ × (V ÷ Mid)
________________________________________
Scale-Normalized Families
With k = sqrt(H ÷ L):
• k (scale factor) = sqrt(H ÷ L)
• s_comp = s0 ÷ k: compressed slope candidate
• s_exp = s0 × k: expanded slope candidate
• Exponentiated blends:
- s_kλ = s0 × k^(2λ−1)
- s_φλ = s0 × φ^(2λ−1), with φ = golden ratio ≈ 1.618
- s_√2λ = s0 × (√2)^(2λ−1)
________________________________________
Practical Application
All formulas generate liquidity-weighted price-per-bar ratios that integrate range, time, and VPOC placement.
These values are designed for:
• Chart compression settings
• Testing harmonic alignments across swings
• Liquidity-aware scaling experiments
________________________________________

Inefficient Candle TrackerThe Inefficient Candle Tracker indicator highlights large, inefficient price moves and plots their midpoints as Squared Up Points.
Detects large candles using Percentile or ATR multiple methods
Draws dynamic dashed lines at candle midpoints until price “squares them up”
Built-in alerts for new SUP creation and when levels are touched
Great for spotting unfinished business in price action, confluence with support/resistance, and potential return levels.

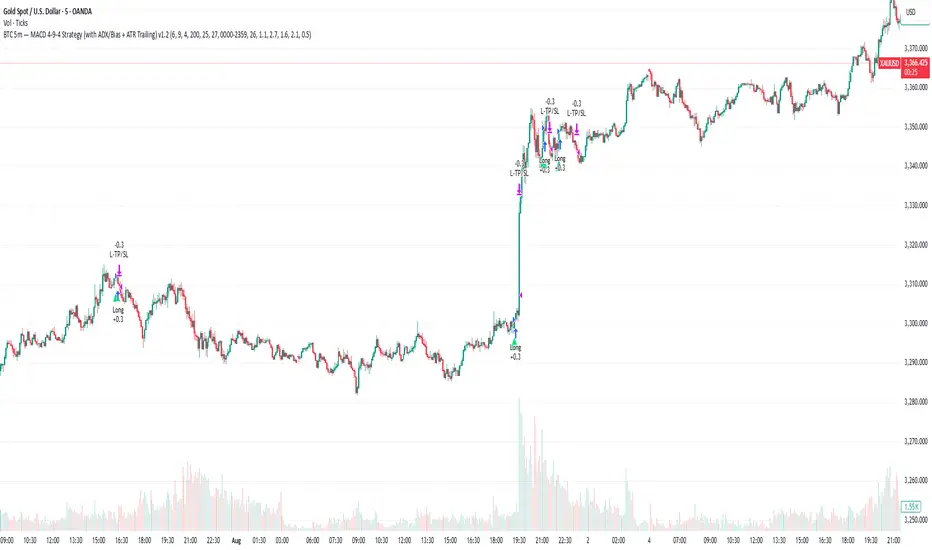
Gold 5m — MACD 694 Strategy (with ADX/Bias + ATR Trailing)This is my sustain gold trade for trading gold 5m TF
Previous Closes (1 & 2 Days Ago)it give closing price of last 2 days, generally of 2 days close broken then you get good move for intraday

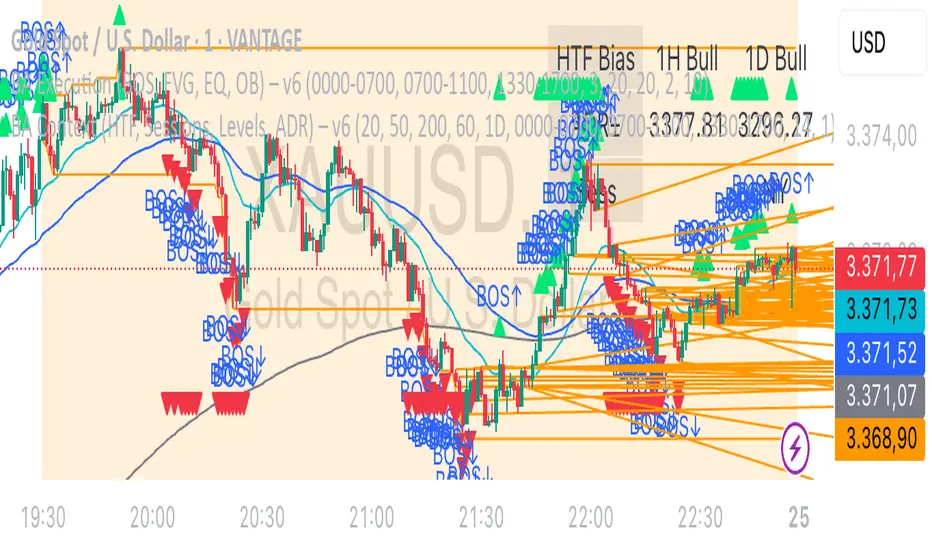
BA Context (HTF, Sessions, Levels, ADR) – v6BA Context is a combination of various indicators, designed primarily for higher timeframes to support context analysis.

RSI Multi Length + Normalized BBW (Butrait)RSI + BB: este indicador muestra cuando el valor esta en sobre venta o sobre compra.

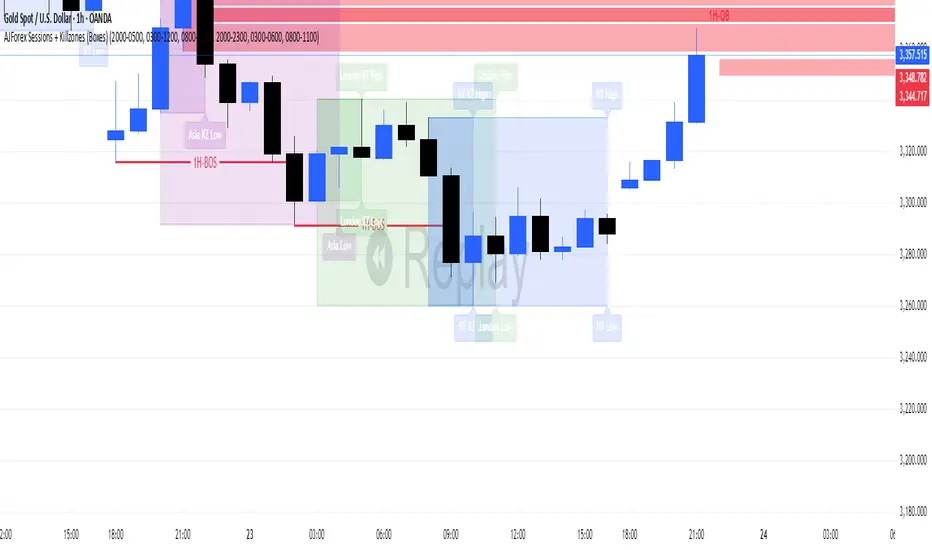
AJForex Sessions + Killzones (Boxes)use timeline UTC -4 AJForex Sessions + Killzones (Boxes)AJForex Sessions + Killzones (Boxes)AJForex Sessions + Killzones (Boxes)AJForex Sessions + Killzones (Boxes)AJForex Sessions + Killzones (Boxes)AJForex Sessions + Killzones (Boxes)AJForex Sessions + Killzones (Boxes)AJForex Sessions + Killzones (Boxes)AJForex Sessions + Killzones (Boxes)
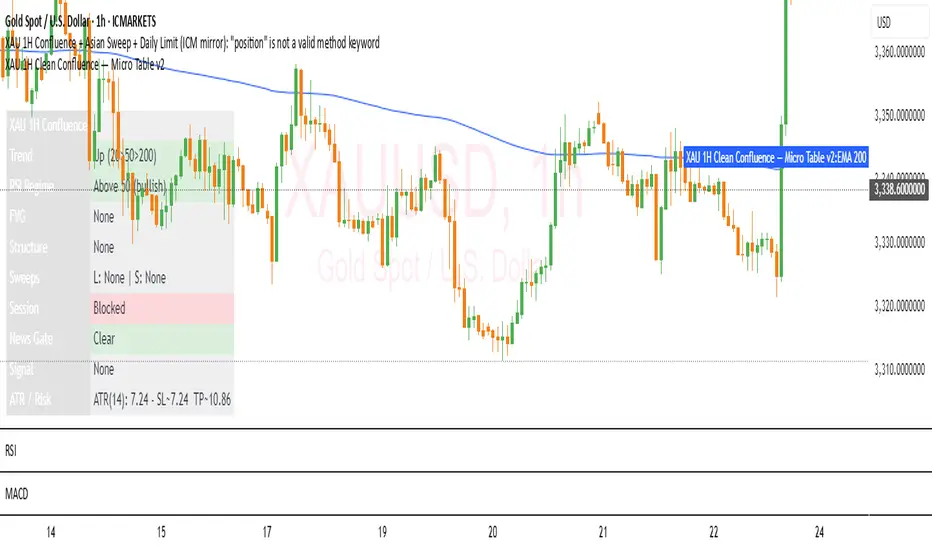
XAU 1H Clean Confluence — Micro Table v2XAU 1H Clean Confluence — Micro Table
What it is
A clean, low-clutter 1-hour XAUUSD indicator that summarizes confluences in a compact on-chart table. It’s designed for traders who want structure + momentum + location without covering the chart in drawings.
Best used on: ICMARKETS:XAUUSD or your broker’s XAUUSD feed, 1H timeframe.
Style: Table-only by default (optional EMA200 line and tiny signal markers).
How signals are built (long example; shorts mirror)
A Long Confluence is printed when all of the below are true:
Trend alignment: EMA20 > EMA50 > EMA200
Pullback & re-engage: price crossed back above EMA20 after a pullback
RSI regime: RSI(14) crosses up through 50 (trend confirmation)
Displacement/imbalance: a 3-candle Bull FVG exists (low > high )
Structure: either a BOS up or CHOCH up via swing pivots (pivotLen input)
Sweep (optional): if enabled, require a sweep of Asian Low and/or PDL first
Time gating (optional): only during London/NY windows and outside news windows
Short signals use the mirrored conditions (EMA stack down, cross back below EMA20, RSI cross down through 50, Bear FVG, BOS/CHOCH down, optional Asian High/PDH sweep).
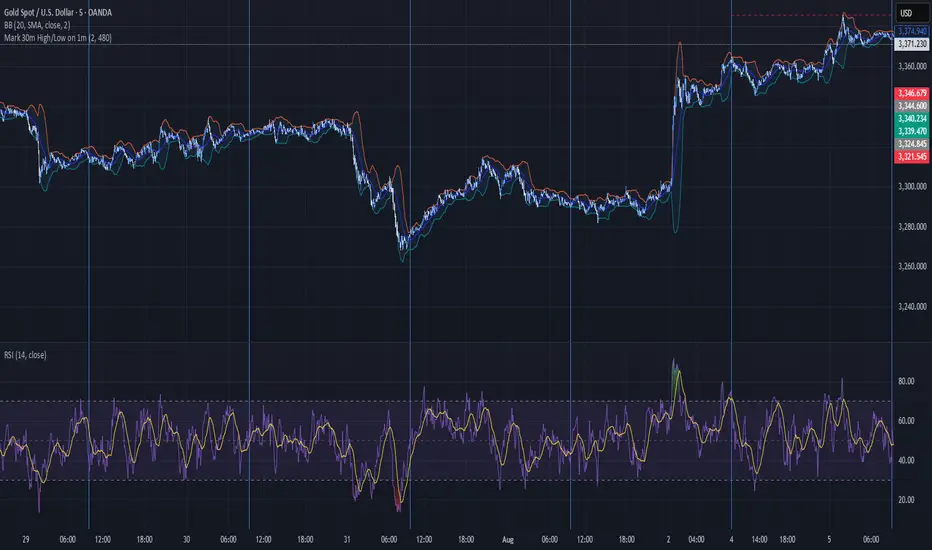
Daily High & Low - 200 bars (Historical)Daily highs and lows.
High marked with a red line.
Low marked with a green line.
plotted on the 5 min chart.

Mark 30m High/Low on 1m30 MIN HIGHS AND LOWS
Marked on the one minute chart.
High is marked with a green line.
Low is marked with a red line.
ICT Silver Bullet Zones (All Sessions)This Pine Script v6 indicator highlights the ICT Silver Bullet windows (10:00–11:00 local time) for all major forex/trading sessions: London, New York AM, New York PM, and Asia.
✅ Features:
Clearly visualizes Silver Bullet zones for each session.
Labels are centered inside each zone for easy identification.
Fully compatible with Pine Script v6 and TradingView.
Adjustable opacity and label size for better chart visibility.
Works on any timeframe and keeps historical zones visible.
Use Case:
Perfect for ICT strategy traders who want to identify high-probability trading windows during major market sessions. Helps in planning entries and understanding liquidity timing without cluttering the chart.
Instructions:
Add the script to your TradingView chart.
Adjust opacity and label size to suit your chart style.
Observe the SB zones for all sessions and plan trades according to ICT methodology.

Berlin High/Low bis 15:30dayHigh := na(dayHigh) ? high : math.max(dayHigh, high)
dayLow := na(dayLow) ? low : math.min(dayLow, low)
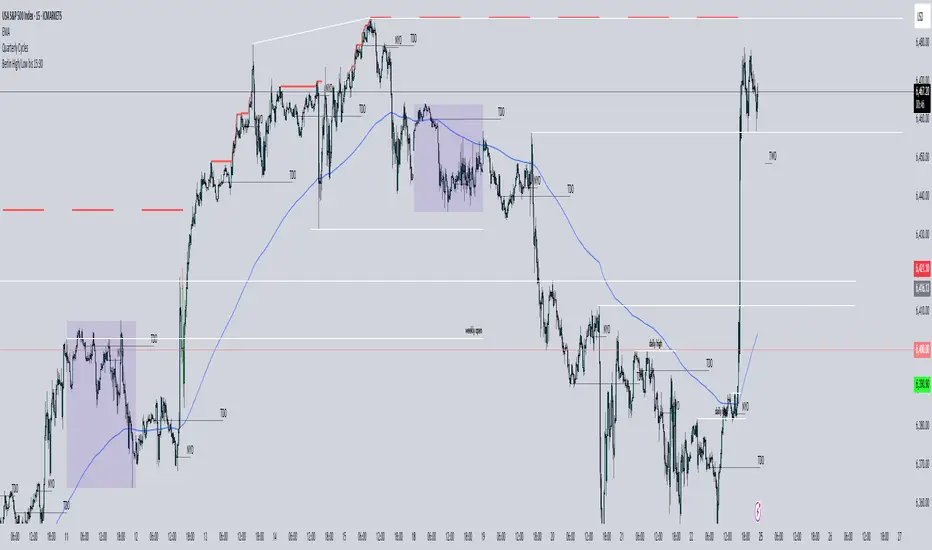
ICT Macro Time Window NYThis script highlights the typical ICT “macro” algorithm activity windows on your chart. It marks 10 minutes before to 10 minutes after each full hour, based on New York time (NY). The display is restricted to the 00:00 – 16:00 NY time range.
Overlay on chart with semi-transparent background
Automatically adjusts to the chart timeframe
Customizable: window start/end minutes, hours, and background color
Ideal for traders following ICT concepts to visually identify high-probability algorithm activity periods.

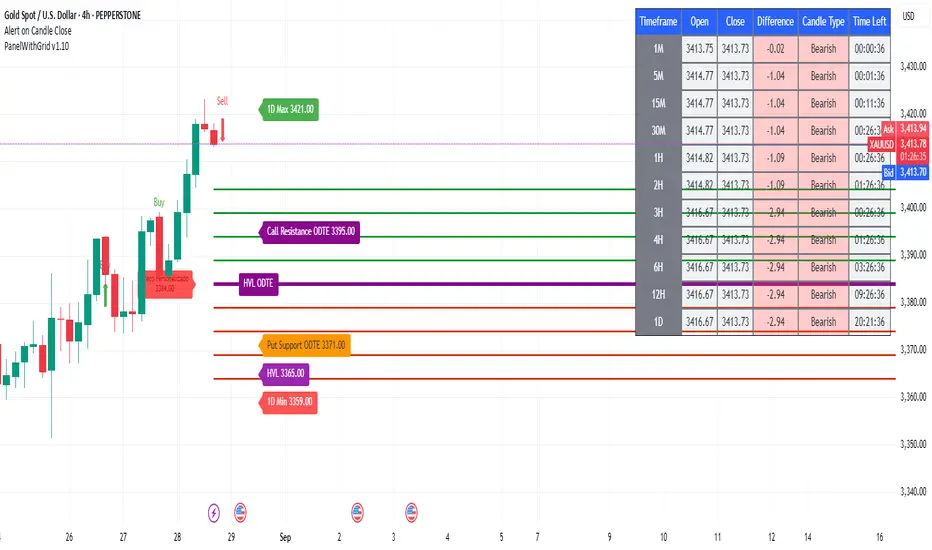
PanelWithGrid v1.7PanelWithGrid v1.7 - Advanced Multi-Timeframe Grid and Panel Indicator
DESCRIPTION:
PanelWithGrid v1.7 is a comprehensive tool for traders who want to monitor multiple timeframes simultaneously while operating based on a customizable price grid. This indicator combines two essential functionalities in a single script:
🎯 MAIN FEATURES:
✅ CUSTOMIZABLE GRID SYSTEM
Configurable timeframe for the grid base (1M to Monthly)
Selection of the reference candlestick level (0 = current, 1 = previous, etc.)
NEW: Custom price as the grid base
Adjustable distance between lines in points
Colored lines (red = base, blue = above, gold = below)
Informative label with the base value
✅ COMPLETE MULTI-TIMEFRAME DASHBOARD
Monitoring of 11 timeframes: 1M, 5M, 15M, 30M, 1H, 2H, 3H, 4H, 6H, 12H, and 1D
Real-time data: open, close, difference, and candlestick type
Countdown to close Each candle
Intuitive colors (green for bullish, red for bearish)
✅ CONFLUENCE SYSTEM
Visual and audio alerts for bullish/bearish confluence on all timeframes
Special confluence analysis for 1H candles after 30 minutes of formation
Buy/sell arrows on the chart for clear signals
⚙️ MAIN SETTINGS:
Grid Settings:
Timeframe for Grid: Select the period for the baseline
Candle Level: 0 (current candle), 1 (last candle), etc.
Grid Distance: Distance between lines in points
NEW: Use Custom Price - Enables manual price as a base
Custom Close Price - Sets the manual value for the grid
🎨 VISUAL:
Grid with lines extended to the right
Panel positioned in the upper left corner
Colors organized for easy interpretation
Informative labels directly on the chart
🔔 ADVANCED FEATURES:
Alerts configured for confluences
Optimized for performance
Real-time updates
Compatible with all pairs and markets
PERFECT FOR:
Scalpers and day traders
Level-based trading
Multiple timeframe analysis
Reversal and breakout strategies
UPDATE v1.7:
Added custom price option for the grid
Improved line stability
Performance optimization
Bug fixes minors
INSTRUCTIONS FOR USE:
Apply the indicator to the chart
Set the desired timeframe and level for the grid
Adjust the distance between lines according to your strategy
Use the custom price if you want a specific basis
Monitor the dashboard to see the convergence between timeframes
Trade based on the identified confluences
ST-Stochastic DashboardST-Stochastic Dashboard: User Manual & Functionality
1. Introduction
The ST-Stochastic Dashboard is a comprehensive tool designed for traders who utilize the Stochastic Oscillator. It combines two key features into a single indicator:
A standard, fully customizable Stochastic Oscillator plotted directly on your chart.
A powerful Multi-Timeframe (MTF) Dashboard that shows the status of the Stochastic %K value across three different timeframes of your choice.
This allows you to analyze momentum on your current timeframe while simultaneously monitoring for confluence or divergence on higher or lower timeframes, all without leaving your chart.
Disclaimer: In accordance with TradingView's House Rules, this document describes the technical functionality of the indicator. It is not financial advice. The indicator provides data based on user-defined parameters; all trading decisions are the sole responsibility of the user. Past performance is not indicative of future results.
2. How It Works (Functionality)
The indicator is divided into two main components:
A. The Main Stochastic Indicator (Chart Pane)
This is the visual representation of the Stochastic Oscillator for the chart's current timeframe.
%K Line (Blue): This is the main line of the oscillator. It shows the current closing price in relation to the high-low range over a user-defined period. A high value means the price is closing near the top of its recent range; a low value means it's closing near the bottom.
%D Line (Black): This is the signal line, which is a moving average of the %K line. It is used to smooth out the %K line and generate trading signals.
Overbought Zone (Red Area): By default, this zone is above the 75 level. When the Stochastic lines are in this area, it indicates that the asset may be "overbought," meaning the price is trading near the peak of its recent price range.
Oversold Zone (Blue Area): By default, this zone is below the 25 level. When the Stochastic lines are in this area, it indicates that the asset may be "oversold," meaning the price is trading near the bottom of its recent price range.
Crossover Signals:
Buy Signal (Blue Up Triangle): A blue triangle appears below the candles when the %K line crosses above the Oversold line (e.g., from 24 to 26). This suggests a potential shift from bearish to bullish momentum.
Sell Signal (Red Down Triangle): A red triangle appears above the candles when the %K line crosses below the Overbought line (e.g., from 76 to 74). This suggests a potential shift from bullish to bearish momentum.
B. The Multi-Timeframe Dashboard (Table on Chart)
This is the informational table that appears on your chart. Its purpose is to give you a quick, at-a-glance summary of the Stochastic's condition on other timeframes.
Function: The script uses TradingView's request.security() function to pull the %K value from three other timeframes that you specify in the settings.
Efficiency: The table is designed to update only on the last (most recent) bar (barstate.islast) to ensure the script runs efficiently and does not slow down your chart.
Columns:
Timeframe: Displays the timeframe you have selected (e.g., '5', '15', '60').
Stoch %K: Shows the current numerical value of the %K line for that specific timeframe, rounded to two decimal places.
Status: Interprets the %K value and displays a clear status:
OVERBOUGHT (Red Background): The %K value is above the "Upper Line" setting.
OVERSOLD (Blue Background): The %K value is below the "Lower Line" setting.
NEUTRAL (Black/Dark Background): The %K value is between the Overbought and Oversold levels.
3. Settings / Parameters in Detail
You can access these settings by clicking the "Settings" (cogwheel) icon on the indicator name.
Stochastic Settings
This group controls the behavior and appearance of the main Stochastic indicator plotted in the pane.
Stochastic Period (length)
Description: This is the lookback period used to calculate the Stochastic Oscillator. It defines the number of past bars to consider for the high-low range.
Default: 9
%K Smoothing (smoothK)
Description: This is the moving average period used to smooth the raw Stochastic value, creating the %K line. A higher value results in a smoother, less sensitive line.
Default: 3
%D Smoothing (smoothD)
Description: This is the moving average period applied to the %K line to create the %D (signal) line. A higher value creates a smoother signal line that lags further behind the %K line.
Default: 6
Lower Line (Oversold) (ul)
Description: This sets the threshold for the oversold condition. When the %K line is below this value, the dashboard will show "OVERSOLD". It is also the level the %K line must cross above to trigger a Buy Signal triangle.
Default: 25
Upper Line (Overbought) (ll)
Description: This sets the threshold for the overbought condition. When the %K line is above this value, the dashboard will show "OVERBOUGHT". It is also the level the %K line must cross below to trigger a Sell Signal triangle.
Default: 75
Dashboard Settings
This group controls the data and appearance of the multi-timeframe table.
Timeframe 1 (tf1)
Description: The first timeframe to be displayed in the dashboard.
Default: 5 (5 minutes)
Timeframe 2 (tf2)
Description: The second timeframe to be displayed in the dashboard.
Default: 15 (15 minutes)
Timeframe 3 (tf3)
Description: The third timeframe to be displayed in the dashboard.
Default: 60 (1 hour)
Dashboard Position (table_pos)
Description: Allows you to select where the dashboard table will appear on your chart.
Options: top_right, top_left, bottom_right, bottom_left
Default: bottom_right
4. How to Use & Interpret
Configuration: Adjust the Stochastic Settings to match your trading strategy. The default values (9, 3, 6) are common, but feel free to experiment. Set the Dashboard Settings to the timeframes that are most relevant to your analysis (e.g., your entry timeframe, a medium-term timeframe, and a long-term trend timeframe).
Analysis with the Dashboard: The primary strength of this tool is confluence. Look for situations where multiple timeframes align. For example:
If the dashboard shows OVERSOLD on the 15-minute, 60-minute, and your current 5-minute chart, a subsequent Buy Signal on your 5-minute chart may carry more weight.
Conversely, if your 5-minute chart shows OVERSOLD but the 60-minute chart is strongly OVERBOUGHT, it could indicate that you are looking at a minor pullback in a larger downtrend.
Interpreting States:
Overbought is not an automatic "sell" signal. It simply means momentum has been strong to the upside, and the price is near its recent peak. It could signal a potential reversal, but the price can also remain overbought for extended periods in a strong uptrend.
Oversold is not an automatic "buy" signal. It means momentum has been strong to the downside. While it can signal a potential bounce, prices can remain oversold for a long time in a strong downtrend.
Use the signals and dashboard states as a source of information to complement your overall trading strategy, which should include other forms of analysis such as price action, support/resistance levels, or other indicators.

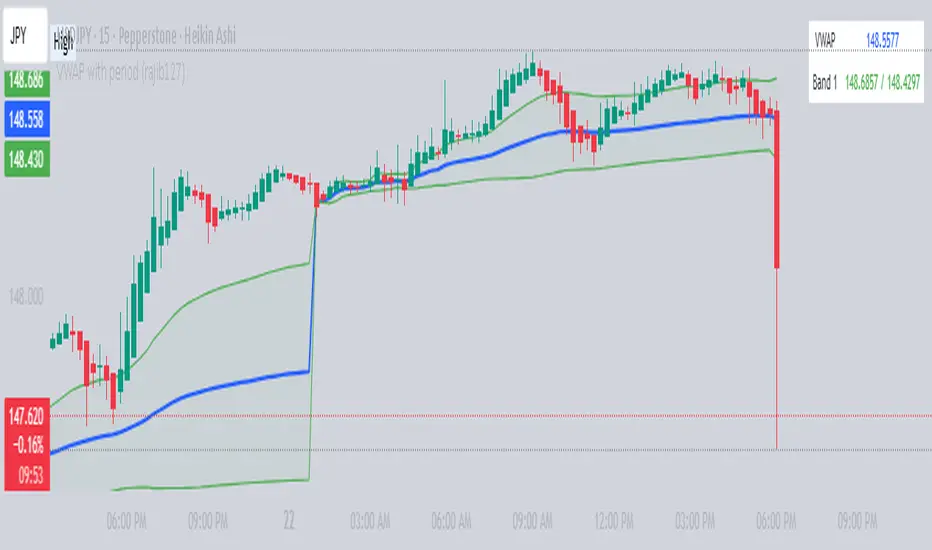
VWAP with period (rajib127)VWAP with Adjustable Period (rajib127)
This advanced VWAP (Volume Weighted Average Price) indicator offers enhanced functionality with customizable anchor periods and multiple standard deviation bands.
Key Features:
Adjustable Anchor Period: Unlike standard VWAP that resets daily, this indicator allows you to set custom anchor timeframes (Daily, Weekly, Monthly) to match your trading strategy
Multiple Deviation Bands: Display up to 3 sets of bands with customizable multipliers for better support/resistance identification
Dual Calculation Modes: Choose between Standard Deviation or Percentage-based band calculations
Flexible Price Sources: Select from 7 different price calculation methods (Typical, Close, High, Low, Median, Weighted, Open)
Timeframe Visibility Control: Option to hide VWAP on higher timeframes (Daily and above) for cleaner charts
Visual Enhancements: Color-coded bands with fill areas and real-time value display table
Trading Applications:
Identify dynamic support and resistance levels
Spot mean reversion opportunities when price deviates from bands
Use different anchor periods for swing trading vs day trading strategies
Combine with other indicators for confluence-based entries
Unique Advantage:
The ability to adjust the VWAP reset period makes this indicator versatile for various trading styles - from intraday scalping with hourly resets to swing trading with weekly anchors.
Perfect for traders who want more control over their VWAP analysis beyond the standard daily reset limitation.
US100 Liquidity Precision StrategyScalping strategy 5-10 point sl / 17 points tp
Automatic BE
Consistent money over time

Filter EMA200 (HTF) + Trigger HMA (with HTF)Trend Filter: EMA200 calculated on the 5-minute timeframe, plotted on the current chart. It acts as the main directional filter.
Trigger: Hull Moving Average (HMA) with adjustable length and selectable source timeframe (default HMA24 on 1-minute). It provides faster entries and exits.
Trading logic is simple:
Only take long signals when price closes above both the filter EMA and the trigger HMA.
Only take short signals when price closes below both lines.
This combination helps reduce false breakouts while keeping entries fast and responsive.
