ColorSMAColorSMA Indicator – Description & Usage Guide
Overview
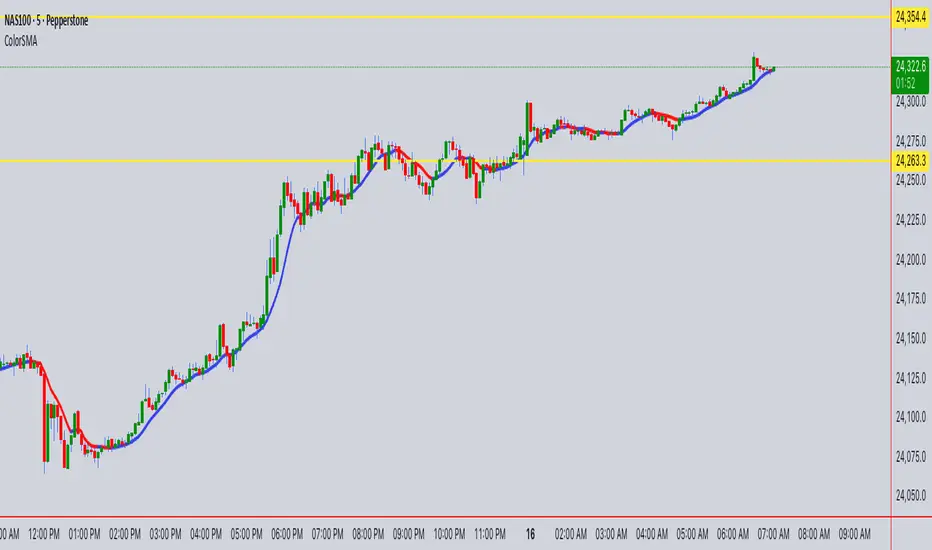
The ColorSMA indicator is a dynamic trend-following moving average designed to adapt to volatility and provide clearer visual cues for traders. Unlike a standard simple moving average (SMA), this tool applies a volatility filter using a standard deviation channel and then smooths the price before calculating the moving average.
The result is a single line on the chart that changes color depending on its trend direction:
Blue (Uptrend) – The moving average is rising compared to the previous bar.
Red (Downtrend) – The moving average is falling compared to the previous bar.
This visual coloring makes it easier to spot the trend direction at a glance.
How It Works
Baseline SMA
The script first calculates a classic SMA based on the selected Length (default = 9).
This baseline acts as the foundation of the indicator.
Volatility Filter (SD Channel)
A standard deviation multiplier is applied to create an upper and lower channel around the SMA.
If price moves outside this channel, it gets “clamped” back within the channel range.
This reduces noise and prevents false signals in highly volatile conditions.
Smoothed Price (Extra Smooth)
The filtered price is then smoothed with another SMA (default = 3).
This step makes the line cleaner and easier to interpret.
Trend Coloring
If the current smoothed SMA is higher than its previous value → the line is Blue.
If it is lower → the line is Red .
This simple but effective color-coding highlights trend shifts without cluttering the chart.
Inputs & Settings
Source: The price source used in the calculation (default = close).
Length: The SMA period length (default = 9).
Extra Smooth : Additional smoothing for the final line (default = 3). Lower values make it more responsive, higher values make it smoother.
Width (Volatility Filter – SD Channel): The multiplier applied to the standard deviation. Controls how wide the channel is (default = 0.3).
Length (Volatility Filter – SD Channel): The period for calculating standard deviation (default = 1).
What You See on the Chart
A single moving average line that changes color:
Blue (Up) = trend strength or bullish direction.
Red (Down) = trend weakness or bearish direction.
The line itself is already filtered through a volatility channel and smoothing, so it reacts to market conditions while reducing noise.
How to Use It
Trend Identification
Use the color changes (Blue/Red) to quickly identify short-term trend shifts.
Blue phases suggest bullish bias, Red phases suggest bearish bias.
Entry/Exit Guidance
Traders can align entries with the trend color (e.g., buy when it turns Blue, sell/short when it turns Red).
Combine with price action or other indicators for confirmation.
Volatility Filtering
Adjust the Width and SD Length parameters to tune how sensitive the indicator is to price fluctuations. Narrower channels give more signals; wider channels filter out more noise.
Smoothing Control
If you prefer faster reactions, lower the smoothing value.
If you want steadier signals, increase smoothing.
Summary
The ColorSMA is a visually enhanced moving average that adapts to volatility and simplifies trend detection. It is especially useful for traders who prefer:
Clean charts with minimal clutter.
Clear, color-coded signals for trend direction.
Flexibility to adjust responsiveness via smoothing and channel width.
This indicator is best used as a trend confirmation tool or combined with other strategies such as support/resistance, candlestick patterns, or oscillators for robust trade setups.
Search in scripts for "纳斯达克指数期货cfd"
Heikin FlowHeikin Flow
by Ben Deharde, 2025
Overview
Heikin Flow is a trend and momentum oscillator built on a smoothed reverse-Heikin-Ashi baseline. It quantifies the distance between price and this baseline, then colors the histogram to reflect both direction and acceleration/deceleration. Use it standalone to read trend energy and shifts, or pair it with Heikin Rider for momentum-aware breakout confirmation.
What It Does
Computes a reverse-HA baseline and optionally smooths it with a selectable MA.
Plots a histogram of distance (price minus baseline) to visualize directional pressure.
Colors the histogram by trend state (above/below baseline) and momentum (accelerating vs. decelerating).
Provides alerts on zero-line crosses to spotlight potential momentum regime changes.
The histogram also helps to spot divergence between price and momentum (e.g., price making new highs while the histogram weakens).
How It Works
Reverse-HA Baseline
Heikin Flow derives a “reverse close” value from Heikin Ashi context (using prior HA open/close with current bar range) to capture underlying pressure. This value is range-bounded to avoid extremes, then optionally smoothed. The resulting line acts as a soft directional baseline.
Smoothing (Noise Control)
Choose SMA/EMA/HMA/VWMA/RMA and a length to control baseline responsiveness. Shorter lengths react faster, longer lengths emphasize trend consistency by filtering noise—useful when pairing with breakout tools like Rider.
Trend & Momentum Logic
Trend: If price is above the baseline, the environment is considered uptrend; below indicates downtrend.
Momentum: The change in distance bar-to-bar distinguishes acceleration (growing distance) from deceleration (shrinking distance).
This dual readout helps you see not just direction, but the quality of that direction—strong push vs. weakening move.
Coloring (Aligned with Heikin Rider Palette)
Deep Blue: Uptrend & accelerating
Light Blue: Uptrend & decelerating
Deep Red: Downtrend & accelerating
Soft Orange: Downtrend & decelerating
This mirrors the palette logic from Heikin Rider for immediate visual consistency across the suite.
How to use
Read the histogram above/below zero (price–baseline) as directional bias; watch color changes for momentum context.
Use zero-line crosses as momentum regime shifts; confirm with price action or Heikin Rider breakout signals.
Watch for divergence between price action and the histogram as an early clue of weakening moves.
Adjust smoothing method/length to fit your market and timeframe—faster for scalping, slower to highlight sustained trends.
Inputs
Smoothing Type & Length for the baseline (SMA/EMA/HMA/VWMA/RMA)
Info Box toggles (display and formatting)
Live Mode option for real-time vs. confirmed-bar behavior (avoids inadvertent lookahead)
Originality
Heikin Flow adapts the HA-driven methodology to an oscillator that focuses on distance-to-baseline and momentum quality, using a reverse-HA construction and flexible MA smoothing—complementing Heikin Rider’s smoothed HA envelope breakout design for a cohesive, momentum-aware workflow.
Alerts
Bullish Heikin Flow Cross — distance crosses above 0 (on bar close)
Bearish Heikin Flow Cross — distance crosses below 0 (on bar close)

Stop Loss Advisor📊 Stop Loss Advisor - Advanced Risk Management Tool
A sophisticated Pine Script v5 indicator designed to suggest optimal stop loss distances based on market volatility, combining ATR and Standard Deviation analysis for precise risk management.
🎯 What Makes This Different from Bollinger Bands?
While Bollinger Bands focus on mean reversion and overbought/oversold conditions using a moving average center line, this indicator is specifically designed for risk management . It creates dynamic bands around the current price to suggest where NOT to place your stop loss, preventing you from being stopped out by normal market noise.
⚡ Key Features
Dynamic ATR Calculation - Fully customizable ATR periods with adaptive volatility filtering
Standard Deviation Integration - Optional StdDev component for enhanced statistical accuracy
Multiple Combination Modes - Average, Maximum, ATR Weighted, or StdDev Weighted
Flexible Price Sources - Choose from Close, HL2, HLC3, or OHLC4
Automatic Pip Calculation - Works across all instruments with automatic pip value detection
Smart Alerts System - Get notified when suggested stop loss exceeds your base risk tolerance
Real-time Information Table - Displays current values and risk status
Visual Labels - Shows exact pip distances directly on chart
Band Smoothing - Prevents erratic movements with customizable averaging
📈 How It Works
ATR Analysis : Calculates Average True Range to measure current market volatility
Statistical Enhancement : Optionally combines with Standard Deviation for more robust calculations
Dynamic Bands : Creates upper and lower bands that expand/contract with volatility
Pip Conversion : Automatically converts distances to pips for easy interpretation
Risk Assessment : Compares suggested distances with your base stop loss tolerance
🔧 Customization Options
ATR Settings:
Customizable ATR period (default: 14)
Adjustable multiplier with 0.1 step precision
Optional volatility filtering for enhanced sensitivity
Standard Deviation (Optional):
Independent period and multiplier settings
Multiple price source options
Four combination modes with ATR
Visual Customization:
Fully customizable colors for all elements
Multiple line styles (solid, dashed, dotted)
Optional band filling with transparency control
Show/hide ATR line overlay
Configurable band smoothing
💡 Perfect For
Forex Traders - Especially effective on major pairs and XAUUSD
Risk Managers - Calculate optimal stop distances before entering trades
Scalpers - Avoid being stopped out by normal market fluctuations
Swing Traders - Adapt stop losses to current volatility conditions
📊 Indicator Values
The information table displays:
Current ATR Value (in pips)
Suggested Long Stop Loss (distance in pips)
Suggested Short Stop Loss (distance in pips)
Risk Status - "SAFE" or "HIGH RISK" based on your base tolerance
Standard Deviation Value (when enabled)
Combination Method (when using both ATR and StdDev)
⚠️ Important Notes
This indicator suggests minimum stop loss distances, not entry/exit signals
Always combine with your trading strategy and risk management rules
Do not use as a standalone trading system
Backtesting recommended before live implementation
Default settings work well for most scenarios, but optimization is encouraged
🎨 Default Configuration
ATR Period: 14
ATR Multiplier: 2.0
Price Source: Close
Base Stop Loss: 20 pips
Band Smoothing: 3 periods
Standard Deviation: Optional (20 period, 2.0 multiplier)
🚀 Getting Started
Add the indicator to your chart
Set your base stop loss tolerance in the settings
Choose your preferred price source and ATR parameters
Enable Standard Deviation for enhanced accuracy (optional)
Monitor the information table for real-time risk assessment
Use the suggested distances as minimum stop loss levels
Pro Tip: In low volatility markets, the bands will contract suggesting tighter stops. In high volatility periods, they expand warning you to use wider stops to avoid being stopped out by normal price action.
📝 Version History & Updates
This indicator is actively maintained and updated based on user feedback. Future enhancements may include multi-timeframe analysis, trend-based asymmetric bands, and additional statistical measures.
Transform your risk management approach with data-driven stop loss suggestions that adapt to real market conditions!

Ultimate📖 Indicator Description – Ultimate
The Ultimate Indicator is a complete charting framework that combines linear regression channels, dynamic deviation bands, EMA ribbons, volatility spreads, and entry/exit markers. It is designed to help traders visualize trend direction, potential reversals, and trade setups with precision.
🔹 What You See on the Chart
Channel Lines (Linear Regression Bands)
Green dotted line (median): Fair value trendline based on regression.
Red dashed line (upper band): Dynamic resistance zone.
Blue dashed line (lower band): Dynamic support zone.
Mid-bands (thin dotted red/blue): Halfway between median and outer bands, useful for scaling entries or partial exits.
🔹 EMA Ribbon (Light Green Shades)
Multiple EMAs (5, 8, 13, 21, 34) plotted in progressively lighter green.
Helps visualize momentum shifts and trend strength.
Ribbon turns more aqua/green when short-term EMAs align bullishly.
🙌Markers on Price
🔴 Red Circle (Dot): Short entry signal (price rejecting upper deviation band).
🔵 Blue Circle (Dot): Long entry signal (price bouncing off lower deviation band).
❌ Red X: Peak formation detected, potential short setup (not always valid).
🔷 Blue Diamond: Trough formation detected, potential long setup (not always valid).
Numbers Above/Below Candles
🔴Red numbers (above peaks): % spread from the bottom to the peak, showing upward volatility.
🔵 Blue numbers (below troughs): % spread from the top to the trough, showing downward volatility.
These values help traders gauge the strength of recent swings and compare volatility expansions.
🔹 Signal Logic🔹
🔵Long Signal (Blue Circle):
Forms when price makes a trough and crosses back above the lower regression band.
Confirms potential upside reversal with stop-loss guided by ATR or swing low.
🔴Short Signal (Red Circle):
Forms when price makes a peak and crosses below the upper regression band.
Confirms potential downside reversal with stop-loss guided by ATR or swing high.
❌ Peaks (Red X):
Indicate local tops. Not all peaks convert into shorts, but they warn of resistance zones.
🔹Troughs (Blue Diamonds):
Indicate local bottoms. Not all troughs convert into longs, but they warn of support zones.
🔹 Alerts
When a valid long or short setup is confirmed, an alert fires with:
Ticker name
Entry price
Suggested position size (Quantity)
Stop loss level (ATR-based or HL-based)
Take profit level (calculated by reward multiple)
🔹 Inputs & Customization
Quantity: Lot size suggestion.
Deviation: Multiplier for regression channel width.
Take Profit: Risk-to-reward multiplier.
Stop Loss: ATR or High/Low based.
Trend Lines: Choose between extended or fixed channels.
Period: Lookback window for regression.
Spread Percentages: Toggle volatility labels on/off.
🔹 How to Use
Trend Following: Ride price inside the channel using EMA ribbon alignment.
Reversal Trading: Enter at deviation extremes with confirmation signals.
Volatility Mapping: Use spread % labels to measure the strength of market swings.
Risk Management: ATR-based stops adapt to volatility, while HL stops give structural support/resistance.
✅ In summary:
The Ultimate Indicator is not just a regression channel—it’s a multi-layered system that highlights trend bias, entry/exit signals, volatility spreads, and adaptive risk levels. It allows traders to see at a glance whether the market is trending, ranging, or preparing for a reversal.

Weighted Sector ADD (sign-weighted)What it is
A true, cap-weighted advances/declines (ADD) proxy for the S&P 500 using sector ETFs. Each sector contributes +1 if it’s up on the bar, −1 if it’s down, 0 if flat. Those signals are then weighted by your sector weights (auto-normalized to 100%) and summed into a single breadth line. The result is a fast, low-noise read of how much of the S&P (by sector weight) is advancing vs. declining right now.
- Tracks participation, not price magnitude—perfect for spotting “broad vs. narrow” moves
- Heavily weighted sectors (e.g., Tech) matter proportionally more, reflecting real index impact
- Simple scale: ~−1 to +1 (all weight down → all weight up)
Chart Elements
- Green/Red Columns – “Weighted ADD”: Current bar’s weighted breadth (sign-based by default)
- Blue Line – “Weighted MA”: SMA of the weighted ADD (regime filter)
- Zero/Guide Lines (optional): 0.0, ±0.2 (mild), ±0.6 (strong)
- Labels (optional): Text markers at those guide levels
- Advancing Weight % (optional): Label showing ((ADD+1)/2)*100 → share of total sector weight advancing
How to Read (Quick Guide)
- +0.60 to +1.00 → Broad, one-sided risk-on (most sector weight advancing)
- +0.20 to +0.60 → Moderate, supportive breadth
- −0.20 to +0.20 → Mixed/choppy; rotation
- −0.60 to −1.00 → Broad, one-sided risk-off
- MA above/below zero → Simple regime indicator; zero-crosses could be potential alert triggers
- Divergence: Strong price move with a weak/flat ADD could potentially warn of narrow participation
Inputs & settings
Calculation
- Use returns instead of up/down sign?
OFF (default): true weighted participation (+1/−1/0)
ON: weighted sector returns (winsor-capped). Use if you want magnitude, not just direction
- Winsor cap (returns mode): Caps per-sector contribution in returns mode (e.g., 0.02 = ±2%)
- Smoothing MA length: SMA period for the blue “Weighted MA” line
- Source timeframe: Compute signals on another TF (e.g., “60”) but plot on your chart TF
Visibility
- Show Weighted ADD (bars): Toggle the green/red columns
- Show Weighted ADD MA: Toggle the blue SMA line
- Show Zero Line (0): Toggle the 0.0 reference line
- Show ±0.2 / ±0.6 guide lines: Toggle the helper levels
- Show guide labels: Draw small text labels at 0, ±0.2, ±0.6
- Guide label offset (bars left): Move labels left if they overlap the right edge values
- Show Advancing Weight % label: Toggle the % of sector weight currently advancing
Sector Symbols (ETF proxies)
- XLK, XLY, XLF, XLV, XLC, XLI, XLP, XLE, XLB, XLU, XLRE: Defaults to the SPDR sector ETFs. You can swap for alternative proxies if desired.
Sector Weights (auto-normalize)
- Weight inputs for each sector (e.g., Tech 0.30, Financials 0.13…). These auto-normalize to 1.0 so you can paste rough numbers; the script scales them.
- Keep weights fresh. GICS sector weights drift; update periodically (e.g., quarterly).
Alerts included
- “Weighted ADD crossed above 0”
- “Weighted ADD crossed below 0”
Version
v1.0 – Initial release (weighted sign-based ADD + SMA, zero/guide lines & labels, Adv % label, alerts).

sarbesh tiwari- Separate ATRprice action. itv shows good result. donate if make profit.contact at mitthu497@gmail.com

RSI (8 & 13) + Fibonacci LevelsIndicator Description: RSI (8 & 13) + Fibonacci Levels
This custom indicator is designed to provide a dual-speed RSI framework with embedded Fibonacci retracement levels for advanced momentum and reversal analysis. It combines the power of relative strength measurement with the natural harmony of Fibonacci ratios to give traders a structured approach to market timing and confluence trading.
The indicator plots two RSI lines on a dedicated sub-chart:
RSI Fast (8) → short-term momentum, highly sensitive to price action, helps identify quick shifts and micro-trends.
RSI Slow (13) → smoother and less volatile, acts as confirmation of broader trend direction and underlying strength.
By combining both RSI speeds, traders can spot alignment, divergences, and crossover signals between fast and slow momentum. When both lines move in sync, it reflects strong conviction; when they diverge, it signals potential exhaustion or trend shifts.
Overlaying Fibonacci retracement levels on RSI adds an extra dimension of precision. Instead of using arbitrary zones, the indicator relies on mathematically significant levels tied to natural market cycles:
23.6% → shallow pullbacks, early momentum pauses.
38.2% → minor retracements, often signaling trend continuation.
50% → balance point between strength and weakness.
61.8% → golden ratio, strong correction or reversal zone.
78.6% → deep retracement, last line before full reversal.
In addition, the script marks the classic RSI boundaries:
70 (Overbought) → potential profit-taking, stretched bullish conditions.
30 (Oversold) → potential accumulation, stretched bearish conditions.
Together, these zones help traders gauge not only when the RSI is “too high” or “too low,” but also where price momentum aligns with natural Fibonacci retracement zones. This approach transforms RSI from a simple oscillator into a multi-layered momentum map.
Practical Uses:
Trend Confirmation → When RSI(8) and RSI(13) are both above 50 and rising, bullish strength is confirmed.
Divergence Detection → If price makes higher highs but RSI(8) fails to confirm, it warns of weakening momentum.
Reversal Hunting → Look for RSI rejection candles at Fib levels (e.g., fast RSI hitting 61.8 and rolling over).
Entry/Exit Timing → Use fast RSI crossovers with slow RSI as tactical entries within the broader structure.
Confluence Trading → Strong signals occur when RSI rejection coincides with price structure (double tops/bottoms, Fibonacci levels on chart, Bollinger Band rejections).
This indicator is especially powerful when paired with Bollinger Bands or price action rejection patterns, creating a system where price extremes are validated against RSI Fib zones.
Ultimately, the RSI (8 & 13) + Fibonacci Levels indicator acts as a precision filter — helping traders separate noise from genuine turning points and reinforcing entries/exits with multiple layers of confluence.

Bollinger Bands (SMA 21, 2.618σ)Indicator Description: Bollinger Bands (2.618σ, 21 SMA) + RSI with Fibonacci
This custom indicator combines Bollinger Bands and Relative Strength Index (RSI), enhanced with Fibonacci-based configurations, to provide confluence signals for rejection candles, reversal setups, and continuation patterns.
Bollinger Bands Settings (Customized)
Middle Band → 21-period Simple Moving Average (SMA)
Upper Band → SMA + 2.618 standard deviations
Lower Band → SMA − 2.618 standard deviations
These parameters expand the bands compared to the traditional (20, 2.0) settings, making them better suited for volatility extremes and higher timeframe swing analysis.
Color Scheme
Middle Band = Orange
Upper Band = Red
Lower Band = Green
This color-coding emphasizes key rejection levels visually.
Candle Rejection Logic
The indicator is designed to highlight potential rejection candles when price interacts with the outer Bollinger Bands:
At the Upper Band, rejection signals suggest overextension and potential downside reaction.
At the Lower Band, rejection signals suggest oversold conditions and potential upside reaction.
Rejection Candle Types Tracked
Hammer (bullish reversal, lower rejection wick at bottom band)
Inverted Hammer (bearish reversal, upper rejection wick at top band)
Doji candles (indecision at band extremes)
Double Top formations near the upper band
Double Bottom formations near the lower band
Relative Strength Index (RSI) Settings
RSI is configured with Fibonacci retracement levels instead of traditional 30/70 thresholds.
Fibonacci sequence levels used include:
23.6% (0.236)
38.2% (0.382)
50% (0.5)
61.8% (0.618)
78.6% (0.786)
This alignment with Fibonacci ratios provides deeper market structure insights into momentum strength and exhaustion points.
Trading Confluence Zones
Upper Band + RSI at 0.618–0.786 zone → High probability bearish rejection.
Lower Band + RSI at 0.236–0.382 zone → High probability bullish reversal.
Band interaction + Doji or Hammer candles → Stronger signal confirmation.
Use Cases
Identifying trend exhaustion when price repeatedly fails to break above the upper band.
Spotting accumulation or distribution phases when price consolidates around Fibonacci-based RSI zones.
Detecting false breakouts when candle patterns (like Doji or Inverted Hammer) occur beyond the bands.
Why 2.618 Deviation & 21 SMA?
Standard Bollinger Bands (20, 2.0) capture ~95% of price action.
By widening to 2.618σ, we target extreme volatility outliers — areas where reversals are statistically more likely.
A 21-period SMA aligns better with common cycle lengths (3 trading weeks on daily charts) and Fibonacci-related time cycles.
Practical Strategy
Step 1: Watch when price touches or pierces the upper/lower band.
Step 2: Check for candle rejection patterns (Hammer, Inverted Hammer, Doji, Double Top/Bottom).
Step 3: Confirm with RSI Fibonacci levels for confluence.
Step 4: Trade with the prevailing trend or look for reversal setups if multiple confluence factors align.
Cautions
Not all touches of the bands signal reversals — strong trends can ride along the bands for extended periods.
Always combine with price action structure, volume, and higher timeframe trend bias.
📌 Summary
This indicator blends volatility-based bands with Fibonacci momentum analysis and classical candle rejection patterns. The combination of Bollinger Bands (21, 2.618σ) and RSI Fibonacci levels helps traders detect high-probability rejection zones, reversal opportunities, and overextended conditions with improved accuracy over traditional default settings.

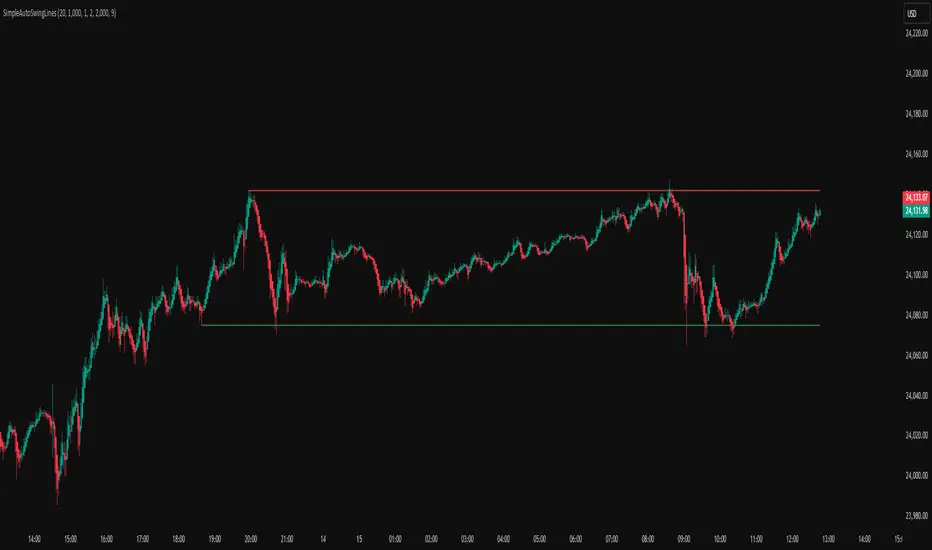
Simple Auto Swing Lines# Simple Auto Swing Lines
## What It Does
This indicator automatically draws horizontal support and resistance lines based on swing highs and lows with line management and touch-based alerts.
## How It Works
**Swing Detection:**
- Uses pivot point analysis to identify significant highs and lows
- Configurable pivot strength determines sensitivity (higher = more significant swings)
- Draws horizontal lines from these swing points extending to current price
**Line Management:**
- Proximity Filter: Removes lines that are too close together to prevent clutter
- Auto-Hide Feature: Lines disappear after price closes beyond them for a set number of candles
- Permanent Clipping: Once a line is crossed for the threshold period, it stays hidden
- Dynamic Updates: Only shows the most relevant recent swing levels
**Touch-Based Alert System:**
- "Swing High touched" - Alerts when price touches resistance lines from any direction
- "Swing Low touched" - Alerts when price touches support lines from any direction
- "Any Swing Level touched" - Combined alert for any swing line interaction
## Key Settings
**Pivot Detection:**
- Pivot Strength (50): Higher values = fewer, more significant swing lines
- Max Lookback Bars (1000): How far back to look for swing points
**Line Appearance:**
- Max Lines (5): Maximum number of swing lines per side (total lines = 2x this number)
- Line Thickness (1-5): Customize line width
- Resistance/Support Colors: Red for highs, green for lows
- Show Labels: Optional swing high/low labels (default: off)
**Display Controls:**
- Proximity Filter (2000 ticks): Minimum distance between lines to prevent clutter
- Candles Before Hide (7): How many consecutive closes beyond a line before permanent removal
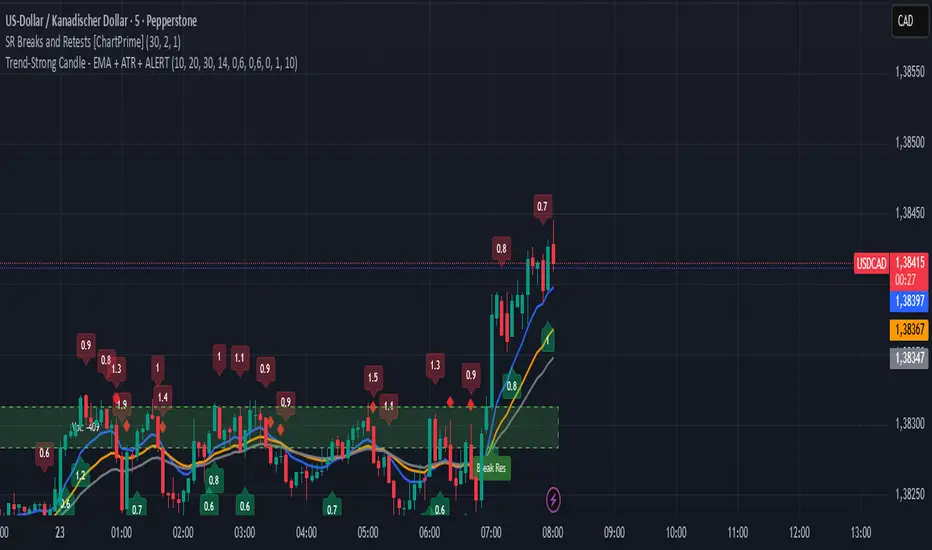
Trend-Strong Candle - Pro Multi Assetighlights:
Major Assets Mode (optional): EURUSD, GBPUSD, USDJPY, AUDUSD, USDCAD, NZDUSD, EURGBP, EURJPY
One‑per‑bar alerts, 24/7 toggle, no session limits
Default EMAs 20/40/60, improved stability and EMA-close filters
Lightweight performance, warning-free calculations, and clearer arrows/plots
Daily/Weekly Wick (Shadow) Range📈 Detailed Guide to the Daily/Weekly Wick (Shadow) Range Indicator
This indicator is a powerful visualization tool designed to map the key price levels established during the previous trading period (either the previous day or the previous week). Instead of just showing a single line for the high and low, it highlights the entire range of the upper and lower wicks (shadows), representing the "battleground" where buyers and sellers were most active.
How It Works
The Wick (Shadow) Range indicator fetches the Open, High, Low, and Close data from the last completed daily or weekly candle and projects those levels onto your current chart. This creates two distinct colored zones.
Upper Wick (Green Zone): This area spans from the Previous High down to the top of the Previous Candle's Body. It visually represents the territory where sellers successfully pushed the price down from its peak. This entire zone can be considered a resistance area.
Lower Wick (Red Zone): This area spans from the bottom of the Previous Candle's Body down to the Previous Low. It shows where buyers stepped in to defend a price level and push it back up. This entire zone can be considered a support area.
How to Use It in Your Trading
This indicator isn't meant to give direct buy or sell signals on its own. Instead, it provides crucial context about market structure. Here are several ways to incorporate it into your strategy:
1. Identifying Key Support & Resistance
This is the indicator's primary function. The most significant levels are:
Key Resistance: The top edge of the green zone (the previous period's high).
Key Support: The bottom edge of the red zone (the previous period's low).
Look for the current price to react when it approaches these boundaries. These are high-probability areas for price to pause or reverse.
2. Watching for Price Rejection (Reversal Trading)
The colored zones are perfect for spotting rejection signals.
Bearish Rejection 📉: If the current price enters the green zone but fails to stay there, closing back below it (often forming a new wick), it's a strong sign that sellers are still in control at that level. This can be an excellent entry signal for a short position.
Bullish Rejection 📈: If the current price dips into the red zone and is quickly bought back up, it shows that buyers are actively defending that area. This can be a great entry signal for a long position.
3. Confirming Breakouts (Trend Trading)
The zones also help validate breakouts.
Bullish Breakout: If the price pushes decisively through the entire green zone and closes above the previous high, it signals that the previous resistance has been broken and the trend may continue upward.
Bearish Breakdown: If the price falls decisively through the entire red zone and closes below the previous low, it confirms that support has failed and the price may continue downward.
4. Setting Context with Timeframes
Weekly Setting: Use the "Weekly" option to identify major, significant support and resistance levels that can influence the market for the entire week. These are powerful levels for swing trading.
Daily Setting: Use the "Daily" option for intraday trading. The previous day's high and low are critical pivot points that many day traders watch.
⚙️ Indicator Settings
The indicator has one simple setting, which you can access by clicking the gear icon ⚙️ next to its name on the chart.
Select Wick Timeframe: This dropdown menu allows you to switch the indicator's calculation between the Daily and Weekly timeframe instantly.

Gold H4 First Hour Scalping IndicatorUpdated V4
This Indicator shows how much on an average gold moved in first 4 hour. Then The possible direction in the next h4

AWSA "Level Indicator with ATR" isn't a single, defined indicator but typically refers to a trading strategy or indicator that uses the Average True Range (ATR) to create dynamic levels on a price chart, such as support, resistance, or stop-loss levels. The ATR is a volatility indicator that measures market volatility; when high, it suggests the market has large price swings, and when low, small price swings. By using the ATR value with a multiplier, traders can set price levels that adapt to changing market volatility, providing more objective and dynamic trading signals than fixed-price levels.

Iani SMC Sniper XAU v2.2 (Long+Short + News Countdown, v6)Iani SMC Sniper v2.6 — Anytime • Auto Pip • FVG 50% • OB • News Panel
Smart-Money Concepts made simple for intraday XAU/USD (works on any symbol).
Finds BOS, 50% FVG “sniper” entries, optional Order Blocks, London H/L, news countdown, and a mini info panel.
What it does
BOS (Break of Structure): detects bullish/bearish BOS after London sweep logic.
FVG 50% entries: plots precise long/short entry dots at the midpoint of the gap.
Auto TP/SL: TP = RR × risk, SL below/above recent swing with a small buffer.
Order Blocks (optional): marks the last opposite candle after BOS and alerts on OB revisit.
London High/Low: tracks session range; session filter is optional.
News countdown: shows next event time and minutes left (user-selectable timezone).
Mini Panel: top-left table with Trend (last BOS), Next news, R:R, Pip size.
Inputs (key)
Auto pip size: uses syminfo.mintick. Manual override available.
Risk:Reward (RR): default 2.0.
Pivot length: swing sensitivity.
Sessions: enable if you want signals only 12:00–20:00 (symbol timezone). Off = anytime.
News timezone: pick your own (e.g., Europe/Brussels, America/New_York).
Absolute & daily times: add your events (strings like 2025-09-17 20:00 or 14:30,16:00…).
Show labels/levels/OBs: toggle on/off.
Alerts included
BOS Bullish / BOS Bearish
BUY Entry / SELL Entry (return to 50% FVG)
Bullish OB revisit / Bearish OB revisit
TP Long/Short reached, SL Long/Short hit
NEWS WARNING (warning window only; does not block signals)
To use: Add Alert → Condition: this indicator → choose any of the alertconditions.
Best use
Bias: H1 for structure.
Execution: M15 (standard) or M5 (aggressive).
Works great on XAUUSD, but is symbol-agnostic (auto pip adapts).
Notes
News times display in the timezone you pick in settings.
OBs are a simple implementation meant for quick visual guidance.
Labels: BUY/SELL near entries, TP/SL on set and when hit, BOS up/down.
Risk disclaimer
This tool is for education only. Not financial advice. Backtest and manage risk.

Iani SMC Sniper XAU v2.2 (Long+Short + News Countdown, v6)Iani SMC Sniper XAU (v2.2) — smart-money logic for XAUUSD.
This indicator hunts “sniper entries” using a simple SMC sequence:
Sweep → BOS → 50% FVG entry
• After London session builds its range, we wait for a liquidity sweep (price dips below London Low for longs / wicks above London High for shorts).
• A BOS confirms direction (close breaks the last swing).
• First FVG that prints after BOS gives the entry at 50% (mid-gap).
• SL anchored to the protective swing (with a small safety buffer). TP is plotted using your Risk:Reward.
News countdown (non-blocking):
The script does not auto-fetch news; you set daily times (e.g., 14:30, 16:00) and/or specific dates (“YYYY-MM-DD HH:MM”). A countdown label shows “NEWS in Xm”. Signals are not blocked—this is just a safety heads-up for prop-firm rules.
Inputs: pivot length, RR, pip size (XAU default 0.10), session filter (after London), news times (recurring & absolute), show/hide levels & labels.
Plots & labels: London High/Low (daily), Entry/SL/TP lines, BOS/Sweep/BUY/SELL markers, news badge.
Alerts: BOS Bull/Bear, BUY/SELL Entry touch, TP/SL hit, NEWS WARNING.
Notes:
• Designed for XAUUSD intraday; works on other symbols if you adjust pip size.
• Uses symbol timezone; adjust your news times for DST if needed.
• Indicator only—no orders, no backtest. Manage risk and execution in MT5/your platform.
Changelog (v2.2): Pine v6, robust time parsing, one-line logical expressions (fixed EOL errors), mirrored short logic, cleaner London H/L reset, countdown label.
Disclaimer: Educational tool, not financial advice. Past performance ≠ future results.
Tags: SMC, ICT, XAUUSD, Gold, Liquidity Sweep, BOS, FVG, London Session, News, Intraday, Scalping, DayTrading.

ZigZag++ + 4 EMA89 Trend Candles + BUY/SELL LabelsThis script combines ZigZag patterns, EMA89 trend detection, and custom buy/sell scalp signals. It helps identify trend direction and potential entry points in trending markets.
Features:
- ZigZag structure points
- EMA89 as dynamic trend filter
- Buy/Sell scalp markers
- HL/HH swing labels
- Works best on 15m–4h timeframes

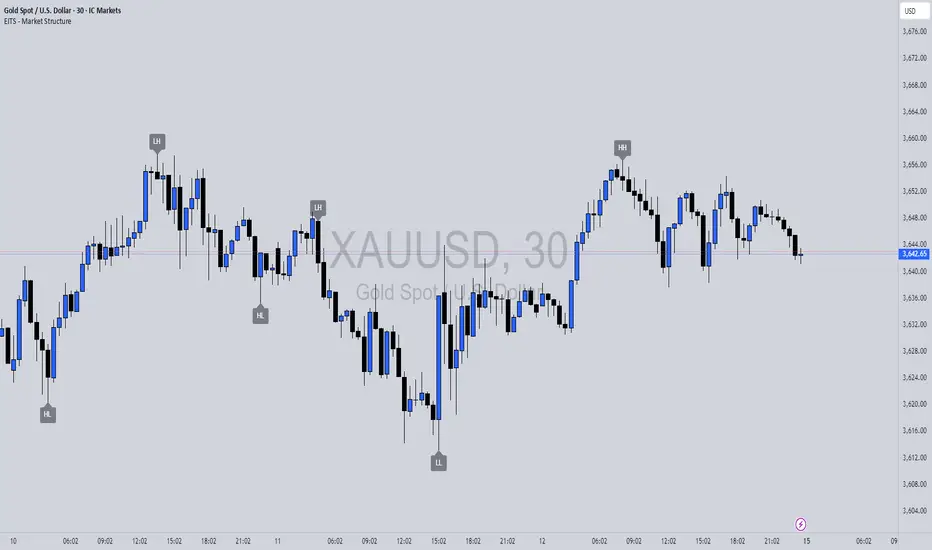
EITS - Market StructureThis script marks the Swing Lows and Highs of a chosen pair. H,HH,L,LL,HL,LH will be marked on chart. Have fun!!
ZigZag++ + 4 EMA89 Trend Candles + BUY/SELL LabelsThis script combines ZigZag patterns, EMA89 trend detection, and custom buy/sell scalp signals. It helps identify trend direction and potential entry points in trending markets.
Features:
- ZigZag structure points
- EMA89 as dynamic trend filter
- Buy/Sell scalp markers
- HL/HH swing labels
- Works best on 15m–4h timeframes

ZigZag+4 EMA89 Trend Candles + BUY/SELL SCALPThis script combines ZigZag patterns, EMA89 trend detection, and custom buy/sell scalp signals. It helps identify trend direction and potential entry points in trending markets.
Features:
- ZigZag structure points
- EMA89 as dynamic trend filter
- Buy/Sell scalp markers
- HL/HH swing labels
- Works best on 15m–4h timeframes

First H4 Window Box with PanelThis indicator will explain in detail about the characterstics of first hour open in Gold

NX - ICT PD ArraysThis Pine Script indicator identifies and visualizes Fair Value Gaps (FVGs) and Order Blocks (OBs) based on refined price action logic.
FVGs are highlighted when price leaves an imbalance between candles, while Order Blocks are detected using ICT methodology—marking the last opposing candle before a displacement move.
The script dynamically tracks and updates these zones, halting box extension once price interacts with them. Customizable colors and lookback settings allow traders to tailor the display to their strategy.

Fibo RSIThis is a customized Relative Strength Index (RSI) indicator designed to replicate TradingView’s default RSI while adding additional reference levels for deeper market analysis.
🔹 Features:
RSI length set to 8 by default (user adjustable).
Calculates RSI using the standard ta.rsi() function.
Plots the RSI line in a clean, separate panel.
Adds 7 key levels for analysis: 0, 20, 30, 50, 70, 80, 100.
Levels are drawn as thin, solid straight lines for a cleaner look (instead of default dashed).
🔹 Use cases:
Identify momentum shifts with enhanced precision.
Use intermediate levels (20, 30, 50, 70, 80) as potential support/resistance zones.
Ideal for traders who want a Fibonacci-like structure in RSI analysis.

First Window Box + Asia Open HourFirst Window Box + Asia Open Hour is an indicator which marks the High and Low of the Asia Open First hour along with the range marking of First Four Hour and its lenght comparing to the length of last 10 days first four hour range.
