Chaikin MF% (CMFP) w. Alerts, Bells & Whistles [LucF]This is Chaikin’s Money Flow indicator on a 0-100 scale with buy/sell signals, alerts and other bells & whistles.
It includes:
- a fast EMA (16 periods by default),
- a slow MA (64 periods by default),
- histograms,
- 3 different sorts of crosses,
- big swings identification,
- buy/sell signals on CMFP crossing back from outside user-defined levels,
- buy/sell signals on the slow MA pivots above/below user-defined levels,
- alerts on big swings and buy/sells.
This indicator started with @LazyBear code (VAPI) at:
@cI8DH then changed the scale to 0-100, which I find very useful:
I then added the rest.
The chart above shows both clean and busy versions of the indicator.
Note that the default length is 10 rather than the commonly used 20. I use CMFP in conjunction with VFI and like the fact that it is faster than VFI. The default inputs show the way I normally use this indicator, with the slow MA shown in histogram mode. I find it gives good context to the signal line. Crosses between the two are often useful.
The buy/sell signals aren’t the main attraction of this indicator, and nothing to write home about. Like the big swing markers, I think it’s more realistic to view them as pointers to potentially interesting areas on charts. Their nature makes them more suited to identifying reversals. They certainly aren’t reliable enough to turn this study into a strategy and I normally don’t use them. The levels pre-defined for the buy/sell signals on CMFP are most useful on short intervals. The buy/sell signals on the slow MA pivots work on a more complete range of intervals. Optimization for your specific instruments and intervals will improve their reliability.
As usual when defining alerts, be sure you already have defined proper inputs and that you are on the intended interval, as they will be used when triggering alerts.
Search in scripts for "美元指数跌破100大关"

3 of SlowStochastics
스토캐스틱 3개를 한번에 볼수 있습니다. 천장과 바닥은 각 100의 위치마다 존재합니다
You can see three slow stochastics at once. The ceiling and floor are located at each 100 (0 - 100 - 200- 300)

Percentage Price Oscillator (PPO)The Percentage Price Oscillator (PPO) is a momentum oscillator that measures the difference between two moving averages as a percentage of the larger moving average. As with its cousin, MACD, the Percentage Price Oscillator is shown with a signal line, a histogram and a centerline. Signals are generated with signal line crossovers, centerline crossovers, and divergences. First, PPO readings are not subject to the price level of the security. Second, PPO readings for different securities can be compared, even when there are large differences in the price.
Calculations
PPO: {(12-day EMA - 26-day EMA)/26-day EMA} x 100
Signal Line: 9-day EMA of PPO
PPO Histogram: PPO - Signal Line
While MACD measures the absolute difference between two moving averages, PPO makes this a relative value by dividing the difference by the slower moving average (26-day EMA). PPO is simply the MACD value divided by the longer moving average. The result is multiplied by 100 to move the decimal place two spots.
Interpretation
As with MACD, the PPO reflects the convergence and divergence of two moving averages. PPO is positive when the shorter moving average is above the longer moving average. The indicator moves further into positive territory as the shorter moving average distances itself from the longer moving average. This reflects strong upside momentum. The PPO is negative when the shorter moving average is below the longer moving average. Negative readings grow when the shorter moving average distances itself from the longer moving average (goes further negative). This reflects strong downside momentum. The histogram represents the difference between PPO and its 9-day EMA, the signal line. The histogram is positive when PPO is above its 9-day EMA and negative when PPO is below its 9-day EMA. The PPO-Histogram can be used to anticipate signal line crossovers in the PPO.
MACD, PPO and Price
MACD levels are affected by the price of a security. A high-priced security will have higher or lower MACD values than a low-priced security, even if volatility is basically equal. This is because MACD is based on the absolute difference in the two moving averages. Because MACD is based on absolute levels, large price changes can affect MACD levels over an extended period of time. If a stock advances from 20 to 100, its MACD levels will be considerably smaller around 20 than around 100. The PPO solves this problem by showing MACD values in percentage terms.
Conclusions
The Percentage Price Oscillator (PPO) generates the same signals as the MACD, but provides an added dimension as a percentage version of MACD. The PPO levels of the Dow Industrials (price > 20K) can be compared against the PPO levels of IBM (price < 200) because the PPO “levels” the playing field. In addition, PPO levels in one security can be compared over extended periods of time, even if the price has doubled or tripled. This is not the case for the MACD.
Limitations
Despite its advantages, the PPO is still not the best oscillator to identify overbought or oversold conditions because movements are unlimited (in theory). Levels for RSI and the Stochastic Oscillator are limited and this makes them better suited to identify overbought and oversold levels.
Source: Stockcharts

Multiple Moving AveragesThis is really simple. But useful for me as I don't have a paid account. No-pro users can only use 3 indicators at once and because I rely heavily on simple moving averages it can be a real pain.
This one indicator features:
20 MA
50 MA
100 MA
200 MA
which I find are the most useful overall. The 20 and 50 over all time frame but in particular < 1 day, the 100 and 200 at > 4 hr time frames. In general I don't use the 100 MA that much. The daily 200 MA is a critical support for many assets like stocks and cryptos. I'm by no means a pro and if you are learning I recommend becoming familiar with moving averages right at the beginning.
If you want to deactivate some of the lines, you can do it via the indicator's settings icon.

Exponential Moving Average (Set of 3) [Krypt] + 13/34 EMAsI took Krypt's script and essentially added on to it.
the 20/50/100/200 EMAs should be used together as support and resistance as normal.
Wait for price to break 200 EMA
Wait for 50 EMA to cross 200 EMA
Wait for pullback to 50 EMA to open position
20 and 100 EMAs are for extra information about moving support and resistance
and 13/34 EMAs should be used in conjunction
When 13 EMA crosses 34 EMA, open position
When price gets far from 13/34, close position (because price will attempt to revert back to mean)
This is better for scalping and swing trades than the 20/50/100/200 setup.
Twitter: @AzorAhai06

Ichimoku Cloud Score v1.0This script calculates a simple Ichimoku Score based on the signals documented here , with a few additions. Each of the score components can be individually weighted via the script inputs . The output is a plot of the normalized Ichimoku score, in the range of -100 to 100.
This script has been heavily modified from 'Ichimoku Cloud Signal Score v2.0.0 '. Credit to user 'dashed' for the initial implementation.
This has been modified with several refinements:
Clean/Organized Code
Simplified Inputs
Improved Style
Scores normalized to a range (-100, 100)
Bugfixes and Improvements
Script Inputs: i.imgur.com

Volume RatioDefinition:
Volume ratio can be obtained in a similar way to RSI.
Volume Ratio (%) = 100 - 100/(1+vr)
The parameter "vr" is defined as
vr=(A+U/2)/(D+U/2)
A=Total volume of the periods when the price advanced
D=Total volume of the periods when the price declined
U=Total volume of the periods when the price unchanged
After substitution, following expression can be derived and the denominator represents total volume of all periods.
Volume Ratio (%) = 100 x (A+U/2)/(A+D+U)
Notes:
A similar method to interpret RSI can be employed.
1) Overbought level over 70% and oversold level under 30%. These levels need to be adjusted according to the periods, time frames and issues.
2) Bullish picture over 50% line and bearish picture under 50% line.
3) Crossing oversold level to the upside can be taken as a confirmation of bullish reversal. - and vice versa for a bearish reversal.
4) After a long-term bearish market, the increase of volume can happen in the early stage of a bullish market.
5) Buying opportunity can be suggested when the volume ratio is declining and the price is either advancing or leveling off.

CCI with Volume Weighted EMA Here is an attempt to improve on the CCI using a volume weighted ema which is then plugged into the CCI formula.
Use:
The CCI with VW EMA is an oscillator that gives readings between -100 and +100. The usual use is to 'go long' with values over +100 and short on values less than -100.
Another use of this oscillator is a countertrend indicator where one sells at crosses under +100 and buys on crosses over -100.

Multi-Functional Fisher Transform MTF with MACDL TRIGGERWhat this indicator gives you is a true signal when price is exhausted and ready for a fast turnaround. Fisher Transform is set for multi-time frame and also allows the user to change the length. This way a user can compare two or more time spans and lengths to look for these MACDL divergent triggers after a Fisher exhaustion. With so many indicators, it's probably best to merge these indicators and change the Fisher and Trigger colors so you can still have a look at price action (remember to scale right after merger). I've noticed from time to time when you have Fisher 34 100 and 300 up and running on two different time frames such as 5 and 15 min charts, with MACDL triggers on the 100/300 or 34/100 you get a high probability trade trigger. However, there are rare exceptions such as when price moves in a parabolic state up or down for a long period where this indication does not work. Ideally this indicator works best in a sideways market or slow rising/descending moving market.
This indicator was worked on by Glaz, nmike and myself
LazyBear also introduced the MACDL indicator

CCI Crossover AlertThis very simple indicator will give you a blue background where the CCI crossed from below -100 to above -100, and a red background where it crossed from above 100 to below 100.

RSI Trendlines and Divergences█OVERVIEW
The "RSI Trendlines and Divergences" indicator is an advanced technical analysis tool that leverages the Relative Strength Index (RSI) to draw trendlines and detect divergences. Designed for traders seeking precise market signals, the indicator identifies key pivot points on the RSI chart, draws trendlines between pivots, and detects bullish and bearish divergences. It offers flexible settings, background coloring for breakout signals, and divergence labels, supported by alerts for key events. The indicator is universal and works across all markets (stocks, forex, cryptocurrencies) and timeframes.
█CONCEPTS
The indicator was developed to provide an alternative signal source for the RSI oscillator. Trendline breakouts and bounces off trendlines offer a broader perspective on potential price behavior. Combining these with traditional RSI signal interpretation can serve as a foundation for creating various trading strategies.
█FEATURES
- RSI and Pivot Calculation: Calculates RSI based on the selected source price (default: close) with a customizable period (default: 14). Identifies pivot points on RSI and price for trendlines and divergences.
- RSI Trendlines: Draws trendlines connecting RSI pivots (upper for downtrends, lower for uptrends) with optional extension (default: 30 bars). The trendline appears and generates a signal only after the first RSI crossover. Lines are colored (red for upper, green for lower).
- Trendline Fill: Widens the trendline with a tolerance margin expressed in RSI points, reducing signal noise and visually highlighting trend zones. Breaking this zone is a condition for generating signals, minimizing false signals. The tolerance margin can be increased or decreased.
- Divergence Detection: Identifies bullish and bearish divergences based on RSI and price pivots, displaying labels (“Bull” for bullish, “Bear” for bearish) with adjustable transparency. Divergence labels appear with a delay equal to the specified pivot length (default: 5). Higher values yield stronger signals but with greater delay.
- Breakout Signals: Generates signals when RSI crosses the trendline (bullish for upper lines, bearish for lower lines), with background coloring for signal confirmation.
- Alerts: Built-in alerts for:
Detection of bullish and bearish divergences.
Upper trendline crossover (bullish signal).
Lower trendline crossover (bearish signal).
- Customization: Allows adjustment of RSI length, pivot settings, line colors, fills, labels, and transparency of signals and background.
█HOW TO USE
Add the indicator to your TradingView chart via the Pine Editor or Indicators menu.
Configuring Settings.
RSI Settings
- RSI Length: Period for RSI calculation (default: 14).
- SMA Length: Period for RSI moving average (default: 9).
- Source: Source price for RSI (default: close).
Pivot Settings for Trend
- Left Bars for Pivot: Number of bars back for detecting pivots (default: 10).
- Right Bars for Pivot: Number of bars forward for confirming pivots (default: 10).
- Extension after Second Pivot: Number of bars to extend the trendline (default: 30, 0 = none). Extension increases the number of signals, while shortening reduces them.
- Tolerance: Deviation in RSI points to widen the breakout margin, reducing signal noise (default: 3.0).
Divergence Settings
- Enable Divergence Detection: Enables/disables divergence detection (default: enabled).
- Pivot Length for Divergence: Pivot period for divergences (default: 5).
Style Settings
- Upper Trendline Color: Color for downtrend lines (default: red).
- Upper Fill Color: Fill color for upper lines (default: red, transparency 70).
- Lower Trendline Color: Color for uptrend lines (default: green).
- Lower Fill Color: Fill color for lower lines (default: green, transparency 70).
- SMA Color: Color for RSI moving average (default: yellow).
- Bullish Divergence Color: Color for bullish labels (default: green).
- Bearish Divergence Color: Color for bearish labels (default: red).
- Text Color: Color for label text (default: white).
- Divergence Label Transparency: Transparency of labels (0-100, default: 40).
- Signal Background Transparency: Transparency of breakout signal background (0-100, default: 80).
Interpreting Signals
- Trendlines: Upper lines (red) indicate RSI downtrends, lower lines (green) indicate uptrends. The trendline appears and generates a signal only after the first RSI crossover. Trendline breakouts suggest potential trend reversals.
- Divergences: “Bull” labels indicate bullish divergence (potential rise), “Bear” labels indicate bearish divergence (potential decline), with a delay based on pivot length (default: 5). Divergences serve as confirmation or warning of trend reversal, not as standalone signals.
- Signal Background: Green background signals bullish breakouts, red background signals bearish breakouts.
- RSI Levels: Horizontal lines at 70 (overbought), 50 (midline), and 30 (oversold) help assess market zones.
- Alerts: Set up alerts in TradingView for divergences or trendline breakouts.
Combining with Other Tools: Use with support/resistance levels, Fibonacci levels, or other indicators for signal confirmation.
█APPLICATIONS
The "RSI Trendlines and Divergence" indicator is designed to identify trends and potential reversal points, supporting both trend-following and reversal strategies:
- Trend Confirmation: Trendlines indicate the RSI trend direction, with breakouts signaling potential reversals. The indicator is functional in traditional RSI usage, allowing classic RSI interpretation (e.g., returning from overbought/oversold zones). Combining trendline breakouts with RSI signal levels, such as a return from overbought or oversold zones paired with a trendline breakout, strengthens the signal.
- Divergence Detection: Divergences serve as confirmation or warning of trend reversal, not as standalone signals.
█NOTES
- Adjust settings (e.g., RSI length, pivots, tolerance) to suit your trading style and timeframe.
- Combine with other technical analysis tools to enhance signal accuracy.

FibPulse144 [CHE] FibPulse144 — ADX-gated 13/21 crossover with 144-trend regime and closed-bar labels
Summary
FibPulse144 combines a fast moving-average crossover with a 144-period trend regime and an ADX strength gate. Signals are confirmed on closed bars only and drawn as labels on the price chart, while an ADX line in a separate pane provides context. Color gradients are derived from normalized ADX, so visual intensity reflects trend strength without changing the underlying logic. The approach reduces false flips during weak conditions and keeps entries aligned with the dominant trend.
Motivation: Why this design?
Traditional crossover signals can flip repeatedly during sideways phases and often trigger against the higher-time regime. By requiring alignment with a slower trend proxy and by gating entries through a rising ADX condition, FibPulse144 favors structurally cleaner transitions. Gradient coloring communicates strength visually, helping users temper aggressiveness without additional indicators.
What’s different vs. standard approaches?
Baseline: Classic dual-MA crossover with unconditional signals.
Architecture differences:
Two-bar regime confirmation against a 144-period trend average.
Pending-signal logic that waits for regime and optional ADX approval.
ADX strength gate using the prior reading relative to a user threshold and earlier value.
Gradient colors scaled by an ADX window with gamma controls.
Price-chart labels enforced via overlay on an otherwise pane-based indicator.
Practical effect: Fewer signals during weak or choppy conditions, labels that appear only after a bar closes, and color intensity that mirrors trend quality.
How it works (technical)
The script computes fast and slow moving averages using the selected method and lengths. A separate 144-length average defines the regime using a two-bar confirmation above or below it. Crossovers are observed on the previous bar to avoid intrabar ambiguity; once a prior crossover is detected, it is stored as pending. A pending long requires regime alignment and, if enabled, an ADX condition based on the previous reading being above the threshold and greater than an earlier reading. The state machine holds neutral, long, or short until an exit condition or ADX reset is met. ADX is normalized within a user window, scaled with gamma, and mapped to up and down color palettes to render gradients. Labels on the price panel are forced to overlay, while the ADX line and threshold guide remain in a separate pane.
Parameter Guide
Source — Input data for all calculations. Default: close. Tip: keep consistent with your chart.
MA Type — EMA or SMA. Default: EMA. EMA reacts faster; SMA is smoother.
Fast / Slow — Fast and slow lengths for crossover. Defaults: 13 and 21. Shorter reacts earlier; longer reduces noise.
Trend — Regime average length. Default: 144. Larger values stabilize regime; smaller values increase sensitivity.
Use 144 as trend filter — Enables regime gating. Default: true. Disable to allow raw crossovers.
Use ADX filter — Requires ADX strength. Default: true. Disable to allow signals regardless of strength.
ADX Len — DI and ADX smoothing length. Default: 14. Higher values smooth strength; lower values react faster.
ADX Thresh — Minimum strength for signals. Default: 25. Raise to reduce flips; lower to capture earlier moves.
Entry/Exit labels (price) — Price-panel labels on state changes. Default: true.
Signal labels in ADX pane — Small markers at the ADX value on entries. Default: true.
Label size — tiny, small, normal, large. Default: normal.
Enable barcolor — Optional candle tint by regime and gradient. Default: false.
Enable gradient — Turns on ADX-driven color blending. Default: true.
Window — Bars used to normalize ADX for colors. Default: 100; minimum: 5.
Gamma bars / Gamma plots — Nonlinear scaling for bar and line intensities. Default: 0.80; between 0.30 and 2.00.
Gradient transp (0–90) — Transparency for gradient colors. Default: 0.
MA fill transparency (0–100) — Fill opacity between fast and slow lines. Default: 65.
Palette colors (Up/Down) — Dark and neon endpoints for up and down gradients. Defaults as in the code.
Reading & Interpretation
Fast/Slow lines: When the fast line is above the slow line, the line and fill use the long palette; when below, the short palette is used.
Trend MA (144): Neutral gray line indicating the regime boundary.
Labels on price: “LONG” appears when the state turns long; “SHORT” when it turns short. Labels appear only after the bar closes and conditions are satisfied.
ADX pane: The ADX line shows current strength. The dotted threshold line is the user level for gating. Optional small markers indicate entries at the ADX value.
Bar colors (optional): Candle tint intensity reflects normalized ADX. Higher intensity implies stronger conditions.
Practical Workflows & Combinations
Trend following: Use long entries when fast crosses above slow and price has held above the trend average for two bars, with ADX above threshold. Mirror this for shorts below the trend average.
Exits and stops: Consider reducing exposure when price closes on the opposite side of the trend average for two consecutive bars or when ADX fades below the threshold if the ADX filter is enabled.
Structure confirmation: Combine with higher-timeframe structure such as swing highs and lows or a simple market structure overlay for confirmation.
Multi-asset/Multi-TF: Works across liquid assets. For lower timeframes, consider a slightly lower ADX threshold; for higher timeframes, maintain or raise the threshold to avoid unnecessary flips.
Behavior, Constraints & Performance
Repaint/confirmation: Signals are based on previous-bar crossovers and are confirmed on bar close. No higher-timeframe or security calls are used. Intrabar markers are not relied upon.
Resources: The script declares `max_bars_back` of 2000, uses no loops or arrays, and employs persistent variables for pending signals and state.
Known limits: Crossover systems can lag after sudden reversals. During tight ranges, disabling the ADX filter may increase flips; keeping it enabled may skip early transitions.
Sensible Defaults & Quick Tuning
Starting point: EMA, 13/21/144, ADX length 14, ADX threshold 25, gradients on, barcolor off.
Too many flips: Increase ADX threshold or length; increase trend length; consider SMA instead of EMA.
Too sluggish: Lower ADX threshold slightly; shorten fast and slow lengths; reduce the trend length.
Colors overpowering: Increase gradient transparency or reduce gamma values toward one.
What this indicator is—and isn’t
This is a visualization and signal layer that combines crossover, regime, and strength gating. It does not predict future movements, manage risk, or execute trades. Use it alongside clear structure, risk controls, and a defined position management plan.
Disclaimer
The content provided, including all code and materials, is strictly for educational and informational purposes only. It is not intended as, and should not be interpreted as, financial advice, a recommendation to buy or sell any financial instrument, or an offer of any financial product or service. All strategies, tools, and examples discussed are provided for illustrative purposes to demonstrate coding techniques and the functionality of Pine Script within a trading context.
Any results from strategies or tools provided are hypothetical, and past performance is not indicative of future results. Trading and investing involve high risk, including the potential loss of principal, and may not be suitable for all individuals. Before making any trading decisions, please consult with a qualified financial professional to understand the risks involved.
By using this script, you acknowledge and agree that any trading decisions are made solely at your discretion and risk.
Do not use this indicator on Heikin-Ashi, Renko, Kagi, Point-and-Figure, or Range charts, as these chart types can produce unrealistic results for signal markers and alerts.
Best regards and happy trading
Chervolino

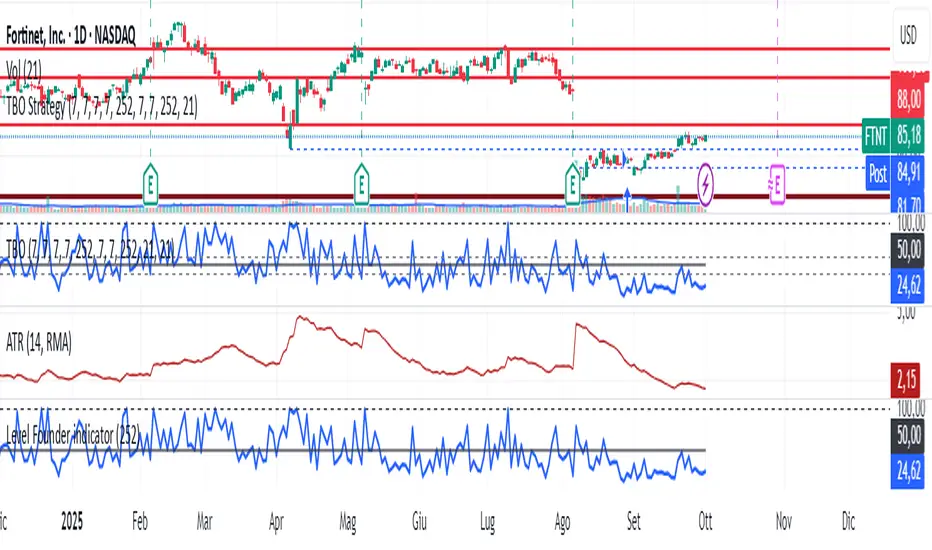
Level Founder indicatorQuesto strumento, ideato per l'individuazione dei livelli orizzontali sensibili si prepone l'obiettivo di semplificare la lettura tecnica dei grafici. Alla base di questo indicatore c'è il concetto di volatilità, inteso come scontro tra domanda ed offerta, come escursione delle forze nel campo di battaglia fino alla determinazione del prezzo finale di ogni candela. Di fatto, andando a cogliere quella che è la volatilità candela per candela, l'indicatore la calcola in termini assoluti rendendola un numericamente comparabile, in un range tra 0 e 100. Quando questo valore tocca i 100 si genera un picco di volatilità, il quale va ad identificare un punto di attenzione sul grafico di uno strumento. In corrispondenza di questi picchi si osserva dove la battaglia tra compratori e venditori si è conclusa, ovvero dove domanda ed offerta si sono incontrati per definire un prezzo: la chiusura di candela. In corrispondenza di tale prezzo si ha, quindi, un accordo certo tra domanda ed offerta dopo un periodo di contrattazione volatile, andando a certificare quello che è un livello di prezzo "sudato" per un determinato sottostante. Tale soglia si traduce in un livello orizzontale sensibile, che in futuro (avendo il mercato memoria degli scontri passati) potrà comportarsi da supporto o da resistenza, a seconda della situazione. In breve quindi, si traccia una linea orizzontale in corrispondenza delle chiusure di candela che condividono un picco sull'indicatore "Level Founder Indicator". Funziona su ogni time-frame e sottostante.
N.B. A ridosso di questi livelli si possono cercare pattern per l'operatività oppure cercare delle rotture di questi livelli per delle conferme/inversioni, spaziando dal trading intraday all'investimento di lungo periodo.
ENGLISH VERSION:
This tool, designed to identify sensitive horizontal levels, aims to simplify the technical reading of charts. This indicator is based on the concept of volatility, understood as the clash between supply and demand, the oscillation of forces on the battlefield until the final price of each candlestick is determined. By capturing the volatility candlestick by candlestick, the indicator calculates it in absolute terms, making it numerically comparable, within a range between 0 and 100. When this value reaches 100, a volatility spike is generated, which identifies a point of focus on an instrument's chart. At these peaks, we observe where the battle between buyers and sellers has concluded, that is, where supply and demand have met to define a price: the candlestick's close. At this price, therefore, a definite agreement between supply and demand occurs after a period of volatile trading, certifying what is a "hard-earned" price level for a given underlying asset. This threshold translates into a sensitive horizontal level, which in the future (given the market's memory of past clashes) could act as support or resistance, depending on the situation. In short, a horizontal line is drawn at the candlestick closes that share a peak on the "Level Founder Indicator." It works on any timeframe and underlying asset.
N.B.: Near these levels, you can look for trading patterns or look for breakouts of these levels for confirmations/reversals, ranging from intraday trading to long-term investing.
Previous candle - D-T.R.A.D.I.N.G//@version=6
indicator("Previous candle - byDen (Body % line & Wick size) ", overlay=true, max_boxes_count=200, max_lines_count=200, max_labels_count=200)
// ---------------- Inputs ----------------
showHighLow = input.bool(true, "Show High/Low lines")
showHLBox = input.bool(true, "Show High-Low Box (full range)")
showMidLine = input.bool(true, "Show Middle Line")
showCloseLine = input.bool(true, "Show Close Line")
showBodyPct = input.bool(true, "Show Body % Line")
enableWickBox = input.bool(true, "Show Wick-Body Box (previous candle)")
keepLastWick = input.bool(false, "Keep last Wick-Box when disabled")
bodyPct = input.float(25.0, "Body % Level", step=0.1, minval=0.0, maxval=100.0)
// colors / styles
cHighLow = input.color(color.white, "H/L Line Color")
hlStyleStr = input.string("solid", "H/L Style", options= )
hlWidth = input.int(1, "H/L Width", minval=1, maxval=5)
cMid = input.color(color.yellow, "Mid Line Color")
midStyleStr = input.string("dashed", "Mid Style", options= )
midWidth = input.int(1, "Mid Width", minval=1, maxval=5)
cClose = input.color(color.yellow, "Close Line Color")
closeStyleStr = input.string("dotted", "Close Style", options= )
closeWidth = input.int(1, "Close Width", minval=1, maxval=5)
cBoxBorder = input.color(color.red, "HL Box Border")
cBoxFill = color.new(input.color(color.gray, "HL Box Fill"), 85)
cBullBox = color.new(input.color(color.green, "Bull WickBox"), 80)
cBearBox = color.new(input.color(color.red, "Bear WickBox"), 80)
cWboxBorder = input.color(color.white, "WickBox Border")
cBodyPct = input.color(color.blue, "Body % Line Color")
bodyPctStyle = input.string("dashed", "Body % Line Style", options= )
bodyPctWidth = input.int(1, "Body % Line Width", minval=1, maxval=5)
// table colors / pip size
cPipBox = input.color(color.new(color.blue, 80), "Table Background Color")
cPipText = input.color(color.white, "Table Text Color")
pipSize = input.float(0.1, "Pip size (XAUUSD=0.1)", step=0.01)
wickLabelText = input.string("Wick", "Opis za wick")
bodyLabelText = input.string("H/L-Body%", "Opis za H/L-Body%")
descFontSizeStr = input.string("small", "Table Description Font Size", options= )
valFontSizeStr = input.string("normal", "Table Value Font Size", options= )
// custom texts for line labels
txtHigh = input.string("High", "Label Text - High")
txtLow = input.string("Low", "Label Text - Low")
txtMid = input.string("Mid", "Label Text - Mid")
txtClose = input.string("Close", "Label Text - Close")
txtBody = input.string("Body%", "Label Text - Body %")
lineFontSizeStr = input.string("small", "Line Label Font Size", options= )
lineLabelPos = input.string("above", "Line Label Position", options= )
lineLabelAlign = input.string("center", "Line Label Align", options= )
// ---------------- Candle Display Options ----------------
highDisplay = input.string("Both", "High Line Display", options= )
lowDisplay = input.string("Both", "Low Line Display", options= )
midDisplay = input.string("Both", "Mid Line Display", options= )
closeDisplay = input.string("Both", "Close Line Display", options= )
bodyDisplay = input.string("Both", "Body % Line Display", options= )
hlBoxDisplay = input.string("Both", "HL Box Display", options= )
wickBoxDisplay = input.string("Both", "Wick Box Display", options= )
// timeframe filter
enabledTFs = input.string("1,5,15,30,60,240,D", "Enable on timeframes")
// ---------------- Helpers ----------------
is_tf_enabled(tfStr) =>
str.contains("," + enabledTFs + ",", "," + tfStr + ",")
line_style_from_str(s) =>
s == "dotted" ? line.style_dotted : s == "dashed" ? line.style_dashed : line.style_solid
get_font_size(fs) =>
fs == "tiny" ? size.tiny : fs == "small" ? size.small : fs == "large" ? size.large : fs == "huge" ? size.huge : size.normal
get_label_style(a) =>
a == "left" ? label.style_label_left : a == "right" ? label.style_label_right : label.style_label_center
get_y_pos(basePrice, pos) =>
pos == "above" ? basePrice + (syminfo.mintick * 10) : basePrice - (syminfo.mintick * 10)
// ---------------- Data ----------------
tf = timeframe.period
= request.security(syminfo.tickerid, tf, , lookahead=barmerge.lookahead_off)
midLevel = (prevH + prevL) / 2
isBull = prevC > prevO
// ---------------- Persistent ----------------
var line lHigh = na
var line lLow = na
var line lMid = na
var line lClose = na
var line lBodyPct = na
var box bHL = na
var box wickBox = na
var table wickTable = na
var label labHigh = na
var label labLow = na
var label labMid = na
var label labClose = na
var label labBodyPct = na
offsetBars = input.int(20, "Bars right", minval=1, maxval=500)
leftX_base = bar_index
rightX_base = bar_index + offsetBars
if na(wickTable)
wickTable := table.new(position.bottom_right, 2, 2, border_width=1, frame_color=color.white)
// ---------------- DRAW ----------------
if barstate.isconfirmed and is_tf_enabled(tf)
// delete previous labels
if not na(labHigh)
label.delete(labHigh)
labHigh := na
if not na(labLow)
label.delete(labLow)
labLow := na
if not na(labMid)
label.delete(labMid)
labMid := na
if not na(labClose)
label.delete(labClose)
labClose := na
if not na(labBodyPct)
label.delete(labBodyPct)
labBodyPct := na
// --- DRAW HIGH ---
drawHigh = (highDisplay=="Both") or (highDisplay=="Bullish" and isBull) or (highDisplay=="Bearish" and not isBull)
if showHighLow and drawHigh
if not na(lHigh)
line.delete(lHigh)
lHigh := line.new(leftX_base, prevH, rightX_base, prevH, xloc=xloc.bar_index, color=cHighLow, width=hlWidth, style=line_style_from_str(hlStyleStr))
labHigh := label.new(rightX_base, get_y_pos(prevH,lineLabelPos), txtHigh, xloc=xloc.bar_index, yloc=yloc.price, style=get_label_style(lineLabelAlign), textcolor=cHighLow, size=get_font_size(lineFontSizeStr))
// --- DRAW LOW ---
drawLow = (lowDisplay=="Both") or (lowDisplay=="Bullish" and isBull) or (lowDisplay=="Bearish" and not isBull)
if showHighLow and drawLow
if not na(lLow)
line.delete(lLow)
lLow := line.new(leftX_base, prevL, rightX_base, prevL, xloc=xloc.bar_index, color=cHighLow, width=hlWidth, style=line_style_from_str(hlStyleStr))
labLow := label.new(rightX_base, get_y_pos(prevL,lineLabelPos), txtLow, xloc=xloc.bar_index, yloc=yloc.price, style=get_label_style(lineLabelAlign), textcolor=cHighLow, size=get_font_size(lineFontSizeStr))
// --- DRAW MID ---
drawMid = (midDisplay=="Both") or (midDisplay=="Bullish" and isBull) or (midDisplay=="Bearish" and not isBull)
if showMidLine and drawMid
if not na(lMid)
line.delete(lMid)
lMid := line.new(leftX_base, midLevel, rightX_base, midLevel, xloc=xloc.bar_index, color=cMid, width=midWidth, style=line_style_from_str(midStyleStr))
labMid := label.new(rightX_base, get_y_pos(midLevel,lineLabelPos), txtMid, xloc=xloc.bar_index, yloc=yloc.price, style=get_label_style(lineLabelAlign), textcolor=cMid, size=get_font_size(lineFontSizeStr))
// --- DRAW CLOSE ---
drawClose = (closeDisplay=="Both") or (closeDisplay=="Bullish" and isBull) or (closeDisplay=="Bearish" and not isBull)
if showCloseLine and drawClose
if not na(lClose)
line.delete(lClose)
lClose := line.new(leftX_base, prevC, rightX_base, prevC, xloc=xloc.bar_index, color=cClose, width=closeWidth, style=line_style_from_str(closeStyleStr))
labClose := label.new(rightX_base, get_y_pos(prevC,lineLabelPos), txtClose, xloc=xloc.bar_index, yloc=yloc.price, style=get_label_style(lineLabelAlign), textcolor=cClose, size=get_font_size(lineFontSizeStr))
// --- DRAW BODY% ---
float bodySize = math.abs(prevC-prevO)
float levelPct = na
drawBody = (bodyDisplay=="Both") or (bodyDisplay=="Bullish" and isBull) or (bodyDisplay=="Bearish" and not isBull)
if showBodyPct and bodySize>0 and drawBody
if not na(lBodyPct)
line.delete(lBodyPct)
levelPct := isBull ? (prevC - (bodyPct/100)*bodySize) : (prevC + (bodyPct/100)*bodySize)
lBodyPct := line.new(leftX_base, levelPct, rightX_base, levelPct, xloc=xloc.bar_index, color=cBodyPct, width=bodyPctWidth, style=line_style_from_str(bodyPctStyle))
labBodyPct := label.new(rightX_base, get_y_pos(levelPct,lineLabelPos), txtBody, xloc=xloc.bar_index, yloc=yloc.price, style=get_label_style(lineLabelAlign), textcolor=cBodyPct, size=get_font_size(lineFontSizeStr))
// --- BOXES ---
drawHLBox = (hlBoxDisplay=="Both") or (hlBoxDisplay=="Bullish" and isBull) or (hlBoxDisplay=="Bearish" and not isBull)
if showHLBox and drawHLBox
if not na(bHL)
box.delete(bHL)
bHL := box.new(leftX_base, prevH, rightX_base, prevL, xloc=xloc.bar_index, border_color=cBoxBorder, bgcolor=cBoxFill)
drawWickBox = (wickBoxDisplay=="Both") or (wickBoxDisplay=="Bullish" and isBull) or (wickBoxDisplay=="Bearish" and not isBull)
if enableWickBox and drawWickBox
float topP = isBull ? prevH : prevC
float botP = isBull ? prevC : prevL
if not na(topP) and not na(botP)
if not na(wickBox)
box.delete(wickBox)
wickBox := box.new(leftX_base, topP, rightX_base, botP, xloc=xloc.bar_index, border_color=cWboxBorder, bgcolor=(isBull?cBullBox:cBearBox))
else if not enableWickBox and not keepLastWick and not na(wickBox)
box.delete(wickBox)
wickBox := na
// --- TABLE (vedno na obeh) ---
float wickPips = isBull ? prevH-prevC : prevC-prevL
float bodyPips = na
if not na(levelPct)
bodyPips := isBull ? math.round((prevH-levelPct)/pipSize) : math.round((levelPct-prevL)/pipSize)
table.cell(wickTable, 0, 0, wickLabelText, text_color=cPipText, bgcolor=cPipBox, text_size=get_font_size(descFontSizeStr))
table.cell(wickTable, 1, 0, str.tostring(wickPips/pipSize), text_color=cPipText, bgcolor=cPipBox, text_size=get_font_size(valFontSizeStr))
if not na(bodyPips)
table.cell(wickTable, 0, 1, bodyLabelText, text_color=cPipText, bgcolor=cPipBox, text_size=get_font_size(descFontSizeStr))
table.cell(wickTable, 1, 1, str.tostring(bodyPips), text_color=cPipText, bgcolor=cPipBox, text_size=get_font_size(valFontSizeStr))

Relative Performance Indicator - TrendSpider StyleRelative Performance Indicator - TrendSpider Style
📈 Overview
This Relative Performance (RP) indicator measures how your stock is performing compared to a benchmark index, displayed as a percentile ranking from 0-100. Based on TrendSpider's methodology, it answers the critical question: "Is this stock a leader or a laggard?"
Unlike simple ratio charts, this indicator uses percentile ranking to normalize relative performance, making it easy to identify when a stock is showing exceptional strength (>80) or concerning weakness (<20) compared to its historical relationship with the benchmark.
✨ Key Features
Three Calculation Modes:
Quarterly: 3-month relative performance for swing trading
Yearly: Weighted 4-quarter performance for position trading
TechRank: Composite of 6 technical indicators for multi-factor analysis
Clean Visual Design:
Green fills above 80 (strong outperformance)
Red fills below 20 (significant underperformance)
Dotted median line at 50 for quick reference
Current value label for instant reading
Flexible Benchmarks:
Compare against major indices (SPY, QQQ, IWM)
Sector ETFs for within-sector analysis
Custom symbols for specialized comparisons
Built-in Alerts:
Strong performance zone entry (>80)
Weak performance zone entry (<20)
Median crossovers (50 level)
📊 How To Use
Buy Signals:
RP crosses above 80: Stock entering leadership status
RP holding above 60: Maintaining relative strength
RP rising while price consolidating: Accumulation phase
Sell/Avoid Signals:
RP drops below 50: Losing relative strength
RP below 20: Significant underperformance
RP falling while price rising: Bearish divergence
Sector Rotation:
Compare multiple assets to find strongest sectors
Rotate into high RP assets (>70)
Exit low RP positions (<30)
🎯 Reading The Values
80-100: Exceptional outperformance - Strong buy/hold
60-80: Moderate outperformance - Hold positions
40-60: Market perform - No edge
20-40: Underperformance - Caution/reduce
0-20: Severe underperformance - Avoid/exit
⚙️ Calculation Method
Calculates percentage performance of both your stock and the benchmark
Finds the performance differential
Ranks this differential against historical values using percentile analysis
Normalizes to 0-100 scale for easy interpretation
This percentile approach adapts to different market conditions and volatility regimes, providing consistent signals whether in trending or choppy markets.
💡 Pro Tips
For Growth Stocks: Use quarterly mode with QQQ as benchmark
For Value Stocks: Use yearly mode with SPY as benchmark
For Small Caps: Compare against IWM, not SPY
For Sector Analysis: Use sector ETFs (XLK, XLF, XLE, etc.)
Combine with Price Action: High RP + price breakout = powerful signal
⚠️ Important Notes
RP is relative, not absolute - stocks can fall with high RP if the market falls harder
Choose appropriate benchmarks for meaningful comparisons
Best used in conjunction with price action and volume analysis
Historical lookback period affects sensitivity (adjustable in settings)
🔧 Customization
Fully customizable visual settings, thresholds, calculation periods, and smoothing options. Adjust the normalization lookback period (default 252 days) to fine-tune sensitivity to your trading timeframe.
📌 Credit
Inspired by TrendSpider's Relative Performance implementation, adapted for TradingView with enhanced customization options and Pine Script v6 optimization.
Tags to include: relativeperformance, relativestrength, percentile, ranking, sectorrotation, benchmark, outperformance, trendspider, marketbreadth, strengthindicator
Category: Momentum Indicators / Trend Analysis
Feel free to modify this description to match your style or add any specific points you want to emphasize!

Hurst‑Millard FLD Normalized 2.0 – Signals "Hurst-Millard FLD Normalized 2.0 – Signals" indicator. It analyzes price data using a combination of moving averages (MAs) and the Hurst exponent to decompose price movements into trend, swing, and noise components, generating buy and sell signals. Here's a brief overview of its functionality:Inputs and Modes:Offers Auto Mode (cycle-based) and Manual Mode for configuring three moving averages: Long-Term (LT), Mid-Term (MT), and Short-Term (ST).
Auto Mode calculates MA lengths and offsets based on user-defined target cycle lengths (e.g., LT: 400 bars, MT: 100 bars, ST: 25 bars) with predefined offset ratios (0.2, 0.333, 0.5 respectively).
Manual Mode allows direct input of MA lengths and offsets.
Moving Averages:Computes Simple Moving Averages (SMAs) for LT, MT, and ST based on the closing price.
Applies forward-shifting to simulate future price behavior (e.g., maLongFwd shifts the LT MA by the specified offset).
Decomposition:Trend: Derived from the forward-shifted LT MA (maLongFwd).
Swing: Calculated as the difference between MT and LT MAs, scaled as a percentage of the closing price and amplified (using ATR or a manual factor).
Noise: Calculated as the difference between ST and MT MAs, similarly scaled and amplified.
Hurst Exponent:Estimates the Hurst exponent to measure the persistence or mean-reversion of the noise component.
Uses a 50-bar lookback period, smoothed with a 5-period SMA.
Signal Generation:Generates buy signals when the noise component is less than the swing component and their difference is within a user-defined proximity threshold (default: 25% of swing).
Generates sell signals when noise exceeds swing within the same threshold.
Signals are plotted as diamond shapes at the calculated proximity price level.
Visualization:Plots the trend, swing, and noise components as lines with customizable colors and gradient intensity based on their relative strength.
Optional debugging plots for raw forward-shifted MAs and proximity thresholds.
Displays a periodic debug table (every 100 bars) showing key metrics like close price, MAs, trend, swing, noise, Hurst exponent, and more.
Additional Features:Supports ATR-based amplification for scaling swing and noise.
Allows customization of signal colors, diamond offsets, and proximity thresholds.
Includes debugging options to visualize raw MAs and proximity bands.
In summary, this indicator uses cycle-based or manually configured MAs to break down price action into trend, swing, and noise, calculates the Hurst exponent for noise analysis, and generates buy/sell signals based on the relationship between swing and noise within a proximity threshold. It’s designed for traders to identify potential trend reversals or continuations.

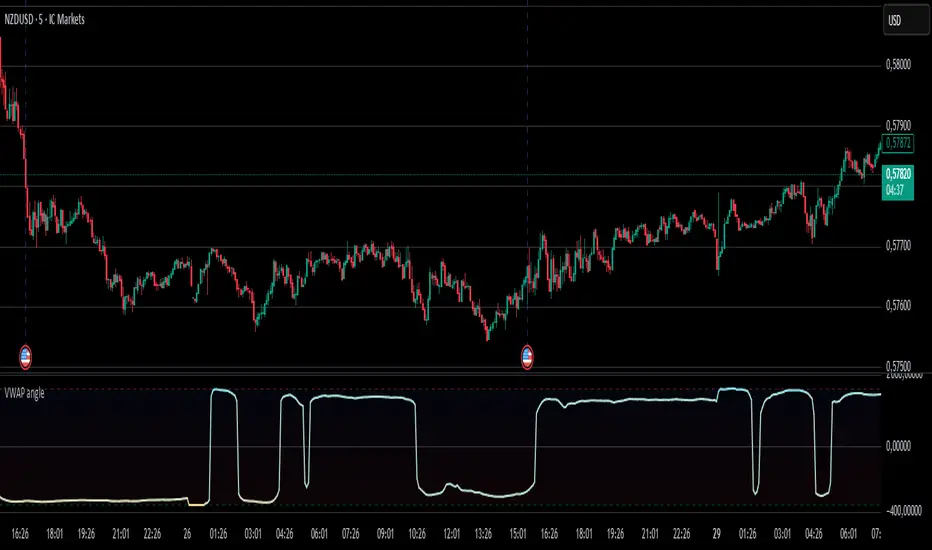
VWAP angleVWAP Angle Indicator
The VWAP Angle indicator is a technical analysis tool designed to measure the directional momentum of the Volume Weighted Average Price (VWAP). Rather than simply plotting the VWAP line itself, this indicator calculates the angle of the VWAP's trajectory over a specified lookback period. It converts the slope into degrees using arctangent mathematics, normalized by the Average True Range (ATR) to account for price volatility. The result is a momentum oscillator that ranges from -100 to +100, providing traders with a clear visual representation of whether the VWAP is trending sharply upward, downward, or moving sideways.
The indicator features customizable overbought and oversold zones (defaulting to +65 and -65 respectively) with color-coded bands to help identify potential reversal points or extreme market conditions. A dynamic color gradient transitions from cyan (bullish angles) to orange (bearish angles), making it easy to spot trend changes at a glance. The visualization includes multiple threshold bands at ±65 and ±80 levels, with shaded regions that intensify as the angle reaches extreme values, helping traders identify when momentum may be overextended.
Built-in alert functionality notifies traders when the VWAP angle crosses into overbought or oversold territories, with optional visual labels appearing directly on the indicator panel. This makes it particularly useful for automated trading strategies or for traders who want real-time notifications of potential trend exhaustion or reversal setups. The indicator works best when combined with other technical tools to confirm signals and filter out false alerts during choppy or ranging market conditions.
Adaptive HMA SignalsAdaptive HMA Signals
This indicator pairs nicely with the Contrarian 100 MA and can be located here:
Overview
The "Adaptive HMA Signals" indicator is a sophisticated technical analysis tool designed for traders aiming to capture trend changes with precision. By leveraging Hull Moving Averages (HMAs) that adapt dynamically to market conditions (volatility or volume), this indicator generates actionable buy and sell signals based on price interactions with adaptive HMAs and slope analysis. Optimized for daily charts, it is highly customizable and suitable for trading forex, stocks, cryptocurrencies, or other assets. The indicator is ideal for swing traders and trend followers seeking to time entries and exits effectively.
How It Works
The indicator uses two adaptive HMAs—a primary HMA and a minor HMA—whose periods adjust dynamically based on user-selected market conditions (volatility via ATR or volume via RSI). It calculates the slope of the primary HMA to identify trend strength and generates exit signals when the price crosses the minor HMA under specific slope conditions. Signals are plotted as circles above or below the price, with inverted colors (white for buy, blue for sell) to enhance visibility on any chart background.
Key Components
Adaptive HMAs: Two HMAs (primary and minor) with dynamic periods that adjust based on volatility (ATR-based) or volume (RSI-based) conditions. Periods range between user-defined minimum and maximum values, adapting by a fixed percentage (3.141%).
Slope Analysis: Calculates the slope of the primary HMA over a 34-bar period to gauge trend direction and strength, normalized using market range data.
Signal Logic: Generates buy signals (white circles) when the price falls below the minor HMA with a flat or declining slope (indicating a potential trend reversal) and sell signals (blue circles) when the price rises above the minor HMA with a flat or rising slope.
Signal Visualization: Plots signals at an offset based on ATR for clarity, using semi-transparent colors to avoid chart clutter.
Mathematical Concepts
Dynamic Period Adjustment:
Primary HMA period adjusts between minLength (default: 144) and maxLength (default: 200).
Minor HMA period adjusts between minorMin (default: 55) and minorMax (default: 89).
Periods decrease by 3.141% under high volatility/volume and increase otherwise.
HMA Calculation:
Uses the Hull Moving Average formula: WMA(2 * WMA(src, length/2) - WMA(src, length), sqrt(length)).
Provides a smoother, faster-responding moving average compared to traditional MAs.
Slope Calculation:
Computes the slope of the primary HMA using a 34-bar period, normalized by the market range (highest high - lowest low over 34 bars).
Slope angle is converted to degrees using arccosine for intuitive trend strength interpretation.
Signal Conditions:
Buy: Slope ≥ 17° (flat or rising), price < minor HMA, low volatility/volume.
Sell: Slope ≤ -17° (flat or declining), price > minor HMA, low volatility/volume.
Signals are triggered only on confirmed bars to avoid repainting.
Entry and Exit Rules
Buy Signal (White Circle): Triggered when the price crosses below the minor HMA, the slope of the primary HMA is flat or rising (≥17°), and volatility/volume is low. The signal appears as a white circle above the price bar, offset by 0.72 * ATR(5).
Sell Signal (Blue Circle): Triggered when the price crosses above the minor HMA, the slope of the primary HMA is flat or declining (≤-17°), and volatility/volume is low. The signal appears as a blue circle below the price bar, offset by 0.72 * ATR(5).
Exit Rules: Exit a buy position on a sell signal and vice versa. Combine with other tools (e.g., support/resistance, RSI) for additional confirmation. Always apply proper risk management.
Recommended Usage
The "Adaptive HMA Signals" indicator is optimized for daily charts but can be adapted to other timeframes (e.g., 1H, 4H) with adjustments to period lengths. It performs best in trending or range-bound markets with clear reversal points. Traders should:
Backtest the indicator on their chosen asset and timeframe to validate signal reliability.
Combine with other technical tools (e.g., trendlines, Fibonacci retracements) for stronger trade setups.
Adjust minLength, maxLength, minorMin, and minorMax based on market volatility and timeframe.
Use the Charger input to toggle between volatility (ATR) and volume (RSI) adaptation for optimal performance in specific market conditions.
Customization Options
Source: Choose the price source (default: close).
Show Signals: Toggle visibility of buy/sell signals (default: true).
Charger: Select adaptation trigger—Volatility (ATR-based) or Volume (RSI-based) (default: Volatility).
Main HMA Periods: Set minimum (default: 144) and maximum (default: 200) periods for the primary HMA.
Minor HMA Periods: Set minimum (default: 55) and maximum (default: 89) periods for the minor HMA.
Slope Period: Fixed at 34 bars for slope calculation, adjustable via code if needed.
Why Use This Indicator?
The "Adaptive HMA Signals" indicator combines the responsiveness of HMAs with dynamic adaptation to market conditions, offering a robust tool for identifying trend reversals. Its clear visual signals, customizable periods, and adaptive logic make it versatile for various markets and trading styles. Whether you’re a beginner or an experienced trader, this indicator enhances your ability to time entries and exits with precision.
Tips for Users
Test the indicator thoroughly on your chosen market and timeframe to optimize settings (e.g., adjust period lengths for non-daily charts).
Use in conjunction with price action or other indicators (e.g., RSI, MACD) for stronger trade confirmation.
Monitor volatility/volume conditions to ensure the Charger setting aligns with market dynamics.
Ensure your chart timeframe aligns with the selected period lengths for accurate signal generation.
Apply strict risk management to protect against false signals in choppy markets.
Happy trading with the Adaptive HMA Signals indicator! Share your feedback and strategies in the TradingView community!

MAs+Engulfing O caminho das Criptos
This indicator overlays multiple moving averages (EMAs 20/50/100/200 and SMA 200) and highlights bullish/bearish engulfing candles by dynamically coloring the candle body. When a bullish engulfing is detected, the candle appears as a strong dark green; for bearish engulfing, a more vivid red. Normal candles keep classic lime/red colors. Visual alerts and bar coloring make price-action patterns instantly visible.
Includes built-in alert conditions for both patterns, supporting both trading automation and education. The tool upgrades trend-following setups by combining structure with automatic price action insights.
Este indicador combina médias móveis (EMAs de 20/50/100/200 e SMA 200) com detecção de engolfo de alta/baixa, colorindo o candle automaticamente: engolfo de alta com verde escuro, engolfo de baixa com vermelho destacado. Inclui alertas automáticos para ambos os padrões, perfeito para análise visual, estratégia, ou ensino.

EMAs Personalizáveis (até 5)📘 Indicator Explanation – Customizable EMAs (up to 5)
This indicator was developed in Pine Script v6 to make it easier to visualize multiple Exponential Moving Averages (EMAs) on a single chart.
🔑 Main features:
Supports up to 5 different EMAs.
Ability to enable or disable each EMA individually.
Fully customizable period for each EMA.
Flexible color selection for better visual organization.
Adjustable line thickness to highlight the most relevant levels.
📌 How to use:
Open the indicator settings.
Select which EMAs you want to display (from 1 to 5).
Define the period (e.g., 20, 50, 100, 200, etc.).
Choose a color for each EMA.
Observe price behavior relative to the EMAs to identify:
Trends → price above long EMAs indicates bullish strength.
Reversals → EMA crossovers may signal a change in direction.
Dynamic support and resistance → EMAs often act as reaction zones for price.
💡 Practical example:
Short EMA (20) → shows short-term movement.
Mid-term EMA (50 or 100) → confirms trend direction.
Long EMA (200 or 500) → indicates the overall market trend.
👉 This indicator is flexible and can be used for scalping, swing trading, or position trading, depending on the chosen periods.
Custom MACD (Normalized by ATR)This is a modified version of the classic MACD indicator.
Instead of using just the difference between EMA(12) and EMA(26), this version normalizes the MACD line by ATR(26) and scales it by 100:
* 100
This adjustment makes the MACD relative to market volatility, allowing for easier comparison across assets and timeframes.
The idea of normalizing MACD with ATR comes from Alex Spioglou, who suggested this improvement to enhance signal consistency in volatile markets.
Plots include the ATR-normalized MACD line, the signal line, and the histogram, with rising/falling color cues and built-in alert conditions.

Trend Speed Analyzer + alerts//@version=6
indicator('Trend Speed Analyzer + alerts', overlay = false)
//~~}
// ~~ Tooltips {
string t1 = 'Maximum Length: This parameter sets the upper limit for the number of bars considered in the dynamic moving average. A higher value smooths out the trend line, making it less reactive to minor fluctuations but slower to adapt to sudden price movements. Use higher values for long-term trend analysis and lower values for faster-moving markets.'
string t2 = 'Accelerator Multiplier: Adjusts the responsiveness of the dynamic moving average to price changes. A larger value makes the trend more reactive but can introduce noise in choppy markets. Lower values create a smoother trend but may lag behind rapid price movements. This is particularly useful in volatile markets where precise sensitivity is needed.'
string t5 = 'Enable Candles: When enabled, the candlesticks on the chart will be color-coded based on the calculated trend speed. This provides a visual representation of momentum, making it easier to spot shifts in market dynamics. Disable this if you prefer the standard candlestick colors.'
string t6 = 'Collection Period: Defines the number of bars used to normalize trend speed values. A higher value includes a broader historical range, smoothing out the speed calculation. Lower values make the speed analysis more sensitive to recent price changes, ideal for short-term trading.'
string t7 = 'Enable Table: Activates a statistical table that provides an overview of key metrics, such as average wave height, maximum wave height, dominance, and wave ratios. Useful for traders who want numerical insights to complement visual trend analysis.'
string t8 = 'Lookback Period: Determines how many historical bars are used for calculating bullish and bearish wave data. A longer lookback period provides a more comprehensive view of market trends but may dilute sensitivity to recent market conditions. Shorter periods focus on recent data.'
string t9 = 'Start Date: Sets the starting point for all calculations. This allows you to analyze data only from a specific date onward, which is useful for isolating trends within a certain period or avoiding historical noise.'
string t10 = 'Timer Option: Select between using a custom start date or starting from the first available bar on the chart. The \'Custom\' option works with the Start Date setting, while \'From start\' includes all available data.'
// Tooltips for Table Cells
string tt1 = 'Average Wave: Shows the average size of bullish or bearish waves during the lookback period. Use this to assess overall market strength. Larger values indicate stronger trends, and comparing bullish vs bearish averages can reveal market bias. For instance, a higher bullish average suggests a stronger uptrend.'
string tt2 = 'Max Wave: Displays the largest bullish or bearish wave during the lookback period. Use this to identify peak market momentum. A significantly higher bullish or bearish max wave indicates where the market may have shown extreme trend strength in that direction.'
string tt3 = 'Current Wave Ratio (Average): Compares the current wave\'s size to the average wave size for both bullish and bearish trends. A value above 1 indicates the current wave is stronger than the historical average, which may signal increased market momentum. Use this to evaluate if the current move is significant compared to past trends.'
string tt4 = 'Current Wave Ratio (Max): Compares the current wave\'s size to the maximum wave size for both bullish and bearish trends. A value above 1 suggests the current wave is setting new highs in strength, which could indicate a breakout or strong momentum in the trend direction.'
string tt5 = 'Dominance (Average): The net difference between the average bullish and bearish wave sizes. Positive values suggest bullish dominance over time, while negative values indicate bearish dominance. Use this to determine which side (bulls or bears) has had consistent control of the market over the lookback period.'
string tt6 = 'Dominance (Max): The net difference between the largest bullish and bearish wave sizes. Positive values suggest bulls have dominated with stronger individual waves, while negative values indicate bears have produced stronger waves. Use this to gauge the most significant power shifts in the market.'
//~~~~~~~~~~~~~~~~~~~~~~~~~~~~~~~~~~~~~~~~~~~~~~~~~~~~~~~~~~~~~~~~~~~~~~~~~~~~~~~~~~~~~~~~~~~~~~~~~~~~~~~~~~~~~~~~~~~~~}
max_length = input.int(50, minval = 1, title = 'Maximum Length', group = 'Dynamic Moving Average', tooltip = t1)
accel_multiplier = input.float(5.0, minval = 0.0, step = 1.1, title = 'Accelerator Multiplier', group = 'Dynamic Moving Average', tooltip = t2)
tbl_ = input.bool(true, title = 'Enable Table', group = 'Wave Analysis', tooltip = t7)
lookback_period = input.int(100, minval = 1, step = 1, title = 'Lookback Period', group = 'Wave Analysis', tooltip = t8)
candle = input.bool(true, title = 'Enable Candles', group = 'Trend Visualization', tooltip = t5)
collen = input.int(100, step = 10, minval = 5, title = 'Collection Period', group = 'Trend Visualization', tooltip = t6)
up_col = input.color(color.lime, title = 'Dynamic Trend', group = 'Trend Visualization', inline = 'Trend')
dn_col = input.color(color.red, title = '', group = 'Trend Visualization', inline = 'Trend')
up_hist_col = input.color(#82ffc3, title = 'Trend Speed Up', group = 'Trend Visualization', inline = 'up')
up_hist_col_ = input.color(color.lime, title = '', group = 'Trend Visualization', inline = 'up')
dn_hist_col = input.color(color.red, title = 'Trend Speed Dn', group = 'Trend Visualization', inline = 'dn')
dn_hist_col_ = input.color(#f78c8c, title = '', group = 'Trend Visualization', inline = 'dn')
start = input.time(timestamp('1 Jan 2020 00:00 +0000'), title = 'Start Date', group = 'Time Settings', tooltip = t9, inline = 'startdate')
timer = input.string('From start', title = 'Timer Option', options = , group = 'Time Settings', tooltip = t10, inline = 'startdate')
// ~~ Dynamic Average {
counts_diff = close
max_abs_counts_diff = ta.highest(math.abs(counts_diff), 200)
counts_diff_norm = (counts_diff + max_abs_counts_diff) / (2 * max_abs_counts_diff)
dyn_length = 5 + counts_diff_norm * (max_length - 5)
// ~~ Function to compute the accelerator factor with normalization of delta_counts_diff {
calc_accel_factor(float counts_diff, float prev_counts_diff) =>
delta_counts_diff = math.abs(counts_diff - prev_counts_diff)
float max_delta_counts_diff = ta.highest(delta_counts_diff, 200)
max_delta_counts_diff := max_delta_counts_diff == 0 ? 1 : max_delta_counts_diff
float accel_factor = delta_counts_diff / max_delta_counts_diff
accel_factor
//~~~~~~~~~~~~~~~~~~~~~~~~~~~~~~~~~~~~~~~~~~~~~~~~~~~~~~~~~~~~~~~~~~~~~~~~~~~~~~~~~~~~~~~~~~~~~~~~~~~~~~~~~~~~~~~~~~~~~}
// ~~ Function to adjust alpha using the accelerator factor {
adjust_alpha(float dyn_length, float accel_factor, float accel_multiplier) =>
alpha_base = 2 / (dyn_length + 1)
alpha = alpha_base * (1 + accel_factor * accel_multiplier)
alpha := math.min(1, alpha)
alpha
//~~~~~~~~~~~~~~~~~~~~~~~~~~~~~~~~~~~~~~~~~~~~~~~~~~~~~~~~~~~~~~~~~~~~~~~~~~~~~~~~~~~~~~~~~~~~~~~~~~~~~~~~~~~~~~~~~~~~~}
// ~~ Accelerator Factor
accel_factor = calc_accel_factor(counts_diff, nz(counts_diff ))
alpha = adjust_alpha(dyn_length, accel_factor, accel_multiplier)
// ~~ Compute dynamic Ema
var float dyn_ema = na
dyn_ema := na(dyn_ema ) ? close : alpha * close + (1 - alpha) * dyn_ema
//~~~~~~~~~~~~~~~~~~~~~~~~~~~~~~~~~~~~~~~~~~~~~~~~~~~~~~~~~~~~~~~~~~~~~~~~~~~~~~~~~~~~~~~~~~~~~~~~~~~~~~~~~~~~~~~~~~~~~}
// ~~ Trend Speed {
trend = dyn_ema
bullsrc = close
bearsrc = close
type TrendData
array change
array t
StartTime() =>
time > start
var bullish = TrendData.new(array.new(), array.new())
var bearish = TrendData.new(array.new(), array.new())
var x1 = int(na)
var y1 = float(na)
var pos = 0
var speed = 0.0
c = ta.rma(close, 10)
o = ta.rma(open, 10)
// ~~ First value {
if na(x1) and StartTime() or na(x1) and timer == 'From start'
x1 := bar_index
y1 := o
y1
//~~~~~~~~~~~~~~~~~~~~~~~~~~~~~~~~~~~~~~~~~~~~~~~~~~~~~~~~~~~~~~~~~~~~~~~~~~~~~~~~~~~~~~~~~~~~~~~~~~~~~~~~~~~~~~~~~~~~~}
// ~~ Trend direction {
if StartTime() or timer == 'From start'
if bullsrc > trend and bullsrc <= trend
bearish.change.unshift(ta.lowest(speed, bar_index - x1))
bearish.t.unshift(bar_index - x1)
x1 := bar_index
y1 := bullsrc
pos := 1
speed := c - o
speed
if bearsrc < trend and bearsrc >= trend
bullish.change.unshift(ta.highest(speed, bar_index - x1))
bullish.t.unshift(bar_index - x1)
x1 := bar_index
y1 := bearsrc
pos := -1
speed := c - o
speed
speed := speed + c - o
speedGradient = color.from_gradient(speed, ta.min(-speed / 3), ta.max(speed / 3), color.red, color.lime)
trendspeed = ta.hma(speed, 5)
//~~~~~~~~~~~~~~~~~~~~~~~~~~~~~~~~~~~~~~~~~~~~~~~~~~~~~~~~~~~~~~~~~~~~~~~~~~~~~~~~~~~~~~~~~~~~~~~~~~~~~~~~~~~~~~~~~~~~~}
//~~~~~~~~~~~~~~~~~~~~~~~~~~~~~~~~~~~~~~~~~~~~~~~~~~~~~~~~~~~~~~~~~~~~~~~~~~~~~~~~~~~~~~~~~~~~~~~~~~~~~~~~~~~~~~~~~~~~~}
// ~~ Plots {
rma_dyn_ema(x, p) =>
average = ta.rma(dyn_ema , p)
average
colour = ta.wma(close, 2) > dyn_ema ? up_col : dn_col
fillColor = rma_dyn_ema(0, 5) > rma_dyn_ema(1, 5) ? color.new(up_col, 70) : color.new(dn_col, 70)
p1 = plot(dyn_ema, color = colour, linewidth = 2, title = 'Dynamic Trend', force_overlay = true)
p2 = plot(ta.rma(hl2, 50), display = display.none, editable = false, force_overlay = true)
//~~~~~~~~~~~~~~~~~~~~~~~~~~~~~~~~~~~~~~~~~~~~~~~~~~~~~~~~~~~~~~~~~~~~~~~~~~~~~~~~~~~~~~~~~~~~~~~~~~~~~~~~~~~~~~~~~~~~~}
min_speed = ta.lowest(speed, collen)
max_speed = ta.highest(speed, collen)
normalized_speed = (speed - min_speed) / (max_speed - min_speed)
speedGradient1 = speed < 0 ? color.from_gradient(normalized_speed, 0.0, 0.5, dn_hist_col, dn_hist_col_) : color.from_gradient(normalized_speed, 0.5, 1.0, up_hist_col, up_hist_col_)
plot(StartTime() or timer == 'From start' ? trendspeed : na, title = 'Trend Speed', color = speedGradient1, style = plot.style_columns)
plotcandle(open, high, low, close, color = candle ? speedGradient1 : na, wickcolor = candle ? speedGradient1 : na, bordercolor = candle ? speedGradient1 : na, force_overlay = true)
//~~~~~~~~~~~~~~~~~~~~~~~~~~~~~~~~~~~~~~~~~~~~~~~~~~~~~~~~~~~~~~~~~~~~~~~~~~~~~~~~~~~~~~~~~~~~~~~~~~~~~~~~~~~~~~~~~~~~~}
// ~~ Table {
if barstate.islast and tbl_
bullish_recent = bullish.change.slice(0, math.min(lookback_period, bullish.change.size()))
bearish_recent = bearish.change.slice(0, math.min(lookback_period, bearish.change.size()))
bull_max = bullish_recent.max()
bear_max = bearish_recent.min()
bull_avg = bullish_recent.avg()
bear_avg = bearish_recent.avg()
wave_size_ratio_avg = bull_avg / math.abs(bear_avg)
wave_size_text_avg = str.tostring(math.round(wave_size_ratio_avg, 2)) + 'x'
wave_size_color_avg = wave_size_ratio_avg > 0 ? color.lime : color.red
wave_size_ratio_max = bull_max / math.abs(bear_max)
wave_size_text_max = str.tostring(math.round(wave_size_ratio_max, 2)) + 'x'
wave_size_color_max = wave_size_ratio_max > 0 ? color.lime : color.red
dominance_avg_value = bull_avg - math.abs(bear_avg)
dominance_avg_text = dominance_avg_value > 0 ? 'Bullish +' + str.tostring(math.round(wave_size_ratio_avg, 2)) + 'x' : 'Bearish -' + str.tostring(math.round(1 / wave_size_ratio_avg, 2)) + 'x'
dominance_avg_color = dominance_avg_value > 0 ? color.lime : color.red
dominance_max_value = bull_max - math.abs(bear_max)
dominance_max_text = dominance_max_value > 0 ? 'Bullish +' + str.tostring(math.round(wave_size_ratio_max, 2)) + 'x' : 'Bearish -' + str.tostring(math.round(1 / wave_size_ratio_max, 2)) + 'x'
dominance_max_color = dominance_max_value > 0 ? color.lime : color.red
current_wave = speed
current_wave_color = current_wave > 0 ? color.lime : color.red
current_ratio_avg = current_wave > 0 ? current_wave / bull_avg : current_wave / math.abs(bear_avg)
current_ratio_max = current_wave > 0 ? current_wave / bull_max : current_wave / math.abs(bear_max)
current_text_avg = str.tostring(math.round(current_ratio_avg, 2)) + 'x'
current_text_max = str.tostring(math.round(current_ratio_max, 2)) + 'x'
current_color_avg = current_ratio_avg > 0 ? color.lime : color.red
current_color_max = current_ratio_max > 0 ? color.lime : color.red
var tbl = table.new(position.top_right, 3, 3, force_overlay = true)
table.cell(tbl, 0, 0, '', text_color = chart.fg_color, tooltip = '')
table.cell(tbl, 0, 1, 'Average Wave', text_color = chart.fg_color, tooltip = tt1)
table.cell(tbl, 0, 2, 'Max Wave', text_color = chart.fg_color, tooltip = tt2)
table.cell(tbl, 1, 0, 'Current Wave Ratio', text_color = chart.fg_color, tooltip = '')
table.cell(tbl, 1, 1, current_text_avg, text_color = current_color_avg, tooltip = tt3)
table.cell(tbl, 1, 2, current_text_max, text_color = current_color_max, tooltip = tt4)
table.cell(tbl, 2, 0, 'Dominance', text_color = chart.fg_color, tooltip = '')
table.cell(tbl, 2, 1, dominance_avg_text, text_color = dominance_avg_color, tooltip = tt5)
table.cell(tbl, 2, 2, dominance_max_text, text_color = dominance_max_color, tooltip = tt6)
// ─────────────────────────────────────────────────────────────
// MTF BUY/SELL alerts: 10m & 1H agreement (no logic changes)
isGreen = ta.wma(close, 2) > dyn_ema
tf_fast = input.timeframe("10", "Fast TF (Buy/Sell check)", group = "MTF Alerts")
tf_slow = input.timeframe("60", "Slow TF (Buy/Sell check)", group = "MTF Alerts")
confirm_on_close = input.bool(true, "Confirm on bar close", group = "MTF Alerts")
green_fast = request.security(syminfo.tickerid, tf_fast, isGreen, lookahead = barmerge.lookahead_off)
green_slow = request.security(syminfo.tickerid, tf_slow, isGreen, lookahead = barmerge.lookahead_off)
buyCond = green_fast and green_slow
sellCond = not green_fast and not green_slow
triggerOK = confirm_on_close ? barstate.isconfirmed : true
// Single BUY / SELL alerts (messages unchanged)
alertcondition(buyCond and triggerOK, title = "MTF BUY (10m & 1H GREEN)", message = "{{ticker}} | TF={{interval}} | Dynamic line")
alertcondition(sellCond and triggerOK, title = "MTF SELL (10m & 1H RED)", message = "{{ticker}} | TF={{interval}} | Dynamic line")
// ─────────────────────────────────────────────────────────────
// NEW: 10m status repeated EVERY MINUTE (no logic changes)
// ─────────────────────────────────────────────────────────────
// 1-minute pulse: true once per closed 1m bar
m1_pulse = request.security(syminfo.tickerid, "1", barstate.isconfirmed, lookahead = barmerge.lookahead_off)
// Repeat ONLY the 10-minute status every minute
status10_green = green_fast
status10_red = not green_fast
alertcondition(status10_green and m1_pulse, title = "10m Status GREEN — repeat each minute", message = "{{ticker}} | TF=10 | Dynamic line — GREEN")
alertcondition(status10_red and m1_pulse, title = "10m Status RED — repeat each minute", message = "{{ticker}} | TF=10 | Dynamic line — RED")
how do the trend speed anlaysis work

VCP + TTM Squeeze Breakout Detection ToolThis open-source script combines two powerful concepts into a single breakout detection tool:
1. **VCP (Volatility Contraction Pattern)**
Based on Mark Minervini’s principle of structured volatility contraction.
The script identifies low ATR environments combined with a strong trend filter using EMA 50, EMA 100, and EMA 200.
A pivot high is fixed using a rolling high from the last X candles.
2. **TTM Squeeze (inspired by Beardy_Fred's Pro version)**
This module compares Bollinger Bands to Keltner Channels.
When the Bollinger Bands fit inside the Keltner Channels, it signals volatility compression.
The script classifies the squeeze intensity into four stages using colored dots:
- **Green:** No squeeze
- **Black:** Light compression
- **Red:** Medium compression
- **Orange:** Strong compression
A linear momentum oscillator adds directional confirmation by plotting aqua bars above price if momentum is positive.
---
### **Signal Logic**
- **Yellow Dots (Setup Potential)**
Appear when VCP criteria are met **and** either momentum is bearish or the squeeze is still active (non-green).
- **Green Dots (Breakout Active)**
Appear only when:
- Price breaks above pivot high
- EMA filter is valid
- Squeeze has resolved (green)
- Volume is higher than the previous bar
- Momentum is positive
Breakout status is removed once volume AND true range drop below their respective short-term averages.
---
### **Visual Elements**
- 3 EMA Lines: EMA 50 (blue), EMA 100 (orange), EMA 200 (red)
- Pivot line (red), based on recent high
- Colored squeeze state (dots at zero line)
- Yellow dots (pre-breakout tension)
- Green dots (confirmed breakout)
- Aqua bars above price (momentum strength)
---
**Note:**
This script is for educational purposes only and does not constitute financial advice.
No alerts included yet. No external dependencies. No embedded advertising.
---
**License**
Portions of the TTM Squeeze code are derived from “Beardy Squeeze Pro” and are used under the terms of the Mozilla Public License 2.0.
www.mozilla.org
