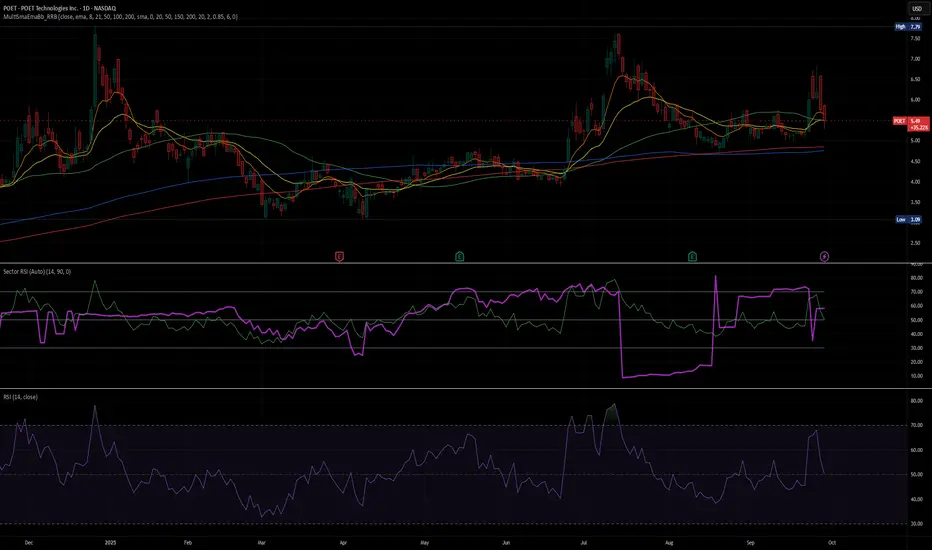
Sector RSI (Auto-Select)This indicator measures the relative strength momentum of any stock against its most closely correlated sector ETF, using the Relative Strength Index (RSI).
Auto sector selection: The script computes correlations between your symbol’s short-term returns and all major SPDR sector ETFs (XLB, XLE, XLF, XLI, XLK, XLP, XLU, XLV, XLY, XTN). The sector with the highest correlation is automatically chosen as the benchmark.
Sector vs Symbol RSI: It calculates RSI (default 14-period) for both the chosen sector and the current chart’s symbol.
Display modes:
Line mode: Plots both RSIs with colored fill (red if the sector RSI is stronger, green if the symbol RSI is stronger).
Histogram mode: Shows the difference between Sector RSI and Symbol RSI as a column chart.
RSI bands: Standard 70/50/30 reference lines are available in line mode.
Status line: The selected sector’s ticker is shown on the TradingView status line so you always know which sector is being used.
Use Cases:
Identify whether a stock’s momentum is driven by its sector or if it’s showing independent relative strength.
Detect sector rotations: when the stock begins to outperform or underperform its sector on momentum basis.
Combine with absolute RSI levels (overbought/oversold) to filter signals.
Notes:
This tool infers sector membership via rolling correlation, not from static classification metadata. This means in some cases (e.g. diversified companies or news shocks) the “best” sector may not be the official one, but the one most correlated in the current market regime.
Use min positive correlation input to filter out weak matches and enforce a fallback (defaults to Technology XLK).
Sentiment
Gold NY Session Key TimesJust showing to us that news come out, open market, close bond for NY Session Time For Indonesia


Fetti Fields Header (Presets)This is for individuals that like to customize their charts and add some style and motivation

Crypto Market Dominance Stacked with LabelsA professional stacked area chart showing the dominance of major crypto market segments: BTC, ETH, Top 100 Altcoins, and #101+ Altcoins. Each layer is color-coded for clarity and includes dynamic labels with the current dominance percentage. Provides a clear visual representation of market share trends for traders, analysts, and crypto enthusiasts.
Features:
Stacked visualization of BTC, ETH, Top 100, and small-cap altcoins (#101+).
Color-coded areas for easy identification.
Dynamic labels showing each category’s current dominance percentage.
Horizontal reference lines for percentage levels.
Approximates top 100 and #101+ altcoins using TOTAL2 and TOTAL3 market cap tickers.
Use Case:
Track how market share shifts between BTC, ETH, large altcoins, and smaller altcoins over time. Ideal for analyzing trends, spotting dominance changes, and visualizing overall crypto market structure.

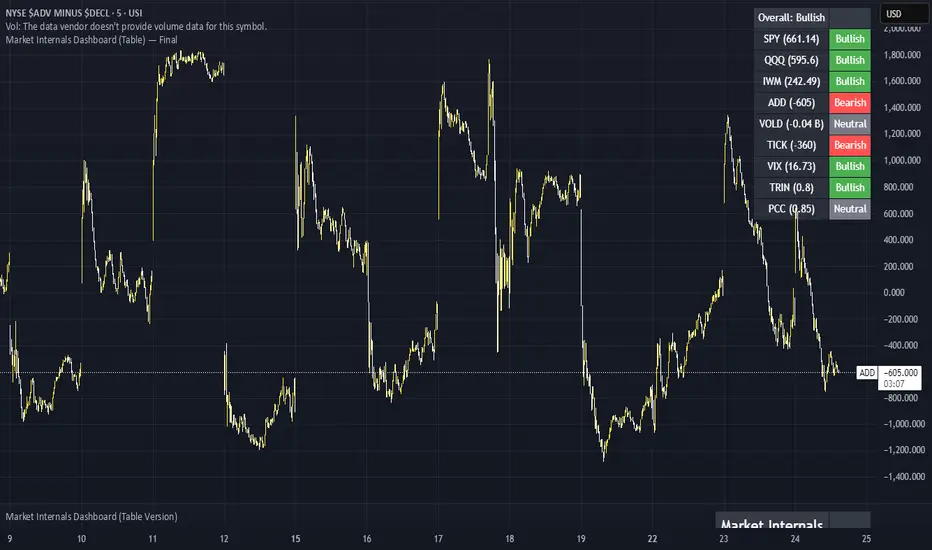
Market Internals Dashboard (Table) v5 - FixedHas a Dashboard for Market Internals and 3 Indices, very helpful
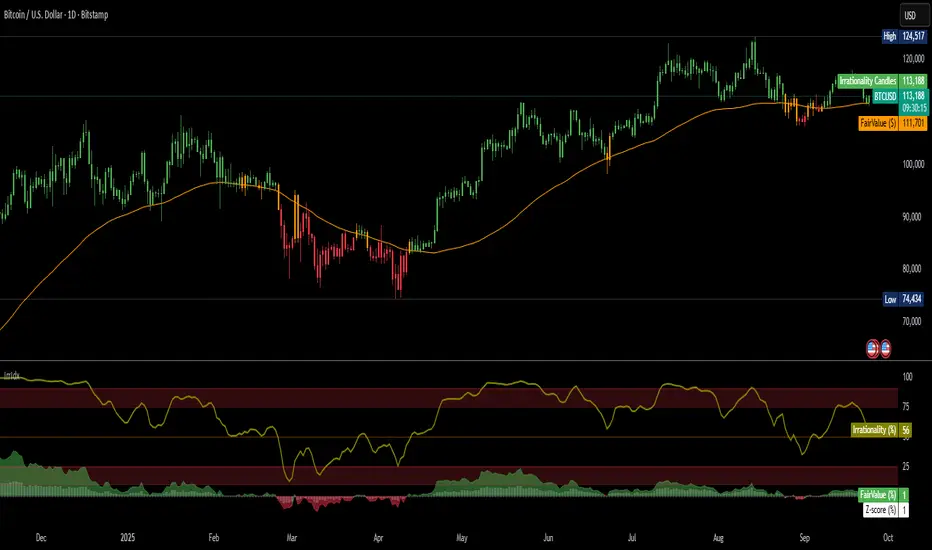
Irrationality Index by CRYPTO_ADA_BTC"The market can be irrational longer than you can stay solvent" ~ John Maynard Keynes
This indicator, the Irrationality Index, measures how far the current market price has deviated from a smoothed estimate of its "fair value," normalized for recent volatility. It provides traders with a visual sense of when the market may be behaving irrationally, without giving direct buy or sell signals.
How it works:
1. Fair Value Calculation
The indicator estimates a "fair value" for the asset using a combination of a long-term EMA (exponential moving average) and a linear regression trend over a configurable period. This fair value serves as a smoothed baseline for price, balancing trend-following and mean-reversion.
2. Volatility-Adjusted Z-Score
The deviation between price and fair value is measured in standard deviations of recent log returns:
Z = (log(price) - log(fairValue)) / volatility
This standardization accounts for different volatility environments, allowing comparison across assets.
3. Irrationality Score (0–100)
The Z-score is transformed using a logistic mapping into a 0–100 scale:
- 50 → price near fair value (rational zone)
- >75 → high irrationality, price stretched above fair value
- >90 → extreme irrationality, unsustainable extremes
- <25 → high irrationality, price stretched below fair value
- <10 → extreme bearish irrationality
4. Price vs Fair Value (% deviation)
The indicator plots the percentage difference between price and fair value:
pctDiff = (price - fairValue) / fairValue * 100
- Positive values → Percentage above fair value (optimistic / overvalued)
- Negative values → Percentage below fair value (pessimistic / undervalued)
Visuals:
- Irrationality (%) Line (0–100) shows irrationality level.
- Background Colors: Yellow= high bullish irrationality, Green= extreme bullish irrationality, Orange= high bearish irrationality, Red= extreme bearish irrationality.
- Price - FairValue (%) plot: price deviation vs fair value (%), Colored green above 0 and red below 0.
- Label: display actual price, estimated fair value, and Z-score for the latest bar.
- Alerts: configurable thresholds for high and extreme irrationality.
How to read it:
- 50 → Market trading near fair value.
- >75 / >90 → Price may be irrationally high; risk of pullback increases.
- <25 / <10 → Price may be irrationally low; potential rebound zones, but trends can continue.
- Price - FairValue (%) plot → visual guide for % price stretch relative to fair value.
Notes / Warnings:
- Measures relative deviation, not fundamental value!
- High irrationality scores do not automatically indicate trades; markets can remain can be irrational longer than you can stay solvent .
- Best used with other tools: momentum, volume, divergence, and multi-timeframe analysis.
Volume ClusteringThis Volume Clustering script is a powerful tool for analyzing intraday trading dynamics by combining two key metrics: volume Z-Score and Cumulative Volume Delta (CVD). By categorizing market activity into distinct clusters, it helps you identify high-conviction trading opportunities and understand underlying market pressure.
How It Works
The script operates on a simple, yet effective, premise: it classifies each trading bar based on its statistical significance (volume Z-Score) and buying/selling pressure (CVD).
Volume Z-Score
The volume Z-Score measures how far the current bar's volume is from its average, helping to identify periods of unusually high or low volume. This metric is a powerful way to spot when institutional or large players might be entering the market. A high Z-Score suggests a significant event is taking place, regardless of direction.
Cumulative Volume Delta (CVD)
CVD tracks the net buying and selling pressure across different timeframes. The script uses a lower timeframe (e.g., 1-minute) and anchors it to a higher timeframe (e.g., 1-day) to capture intraday pressure. A positive CVD indicates more buying pressure, while a negative CVD suggests more selling pressure.
Cluster Categories
The script analyzes the confluence of these two metrics to assign a cluster to each bar, providing actionable insights. The clusters are color-coded and labeled to make them easy to interpret:
🟢 High Conviction Bullish: Unusually high volume (high Z-Score) combined with significant buying pressure (high CVD). This cluster suggests strong bullish momentum.
🔴 High Conviction Bearish: Unusually high volume (high Z-Score) coupled with significant selling pressure (low CVD). This cluster suggests strong bearish momentum.
🟡 Low Conviction/Noise: Low to moderate volume and mixed buying/selling pressure. This represents periods of indecision or consolidation, where market noise is more prevalent.
🟣 Other Clusters: The script also identifies other combinations, such as high volume with moderate CVD, or low volume with high CVD, which can provide additional context for understanding market dynamics.
Key Features & Customization
The script offers several customizable settings to tailor the analysis to your specific trading style:
Z-Score Lookback Length: Adjust the lookback period for calculating the average volume. A shorter period focuses on recent volume trends, while a longer period provides a broader context.
CVD Anchor & Lower Timeframe: Define the timeframes used for CVD calculation. You can anchor the analysis to a daily or weekly timeframe while using a lower timeframe (e.g., 1-minute) to capture granular intraday pressure.
High/Low Volume Mode: Toggle between "High Volume" mode (which uses 90th and 10th percentiles for clustering) and "Low Volume" mode (which uses 75th and 25th percentiles). This allows you to choose whether to focus on extreme events or more subtle shifts in market sentiment.

Relative Sector Index Benchmarking by QuantxQuantX Relative Strength helps traders identify whether a stock is outperforming or underperforming NIFTY. It uses a clean histogram with background highlights and a trend line to spot market leaders, laggards, and strength reversals quickly.

BioSwarm Imprinter™BioSwarm Imprinter™ — Agent-Based Consensus for Traders
What it is
BioSwarm Imprinter™ is a non-repainting, agent-based sentiment oscillator. It fuses many short-to-medium lookback “opinions” into one 0–100 consensus line that is easy to read at a glance (50 = neutral, >55 bullish bias, <45 bearish bias). The engine borrows from swarm intelligence: many simple voters (agents) adapt their influence over time based on how well they’ve been predicting price, so the crowd gets smarter as conditions change.
Use it to:
• Detect emerging trends sooner without overreacting to noise.
• Filter mean-reversion vs continuation opportunities.
• Gate entries with a confidence score that reflects both strength and persistence of the move.
• Combine with your execution tools (VWAP/ORB/levels) as a state filter rather than a trade signal by itself.
⸻
Why it’s different
• Swarm learning: Each agent improves or decays its “fitness” depending on whether its vote matched the next bar’s direction. High-fitness agents matter more; weak agents fade.
• Multi-horizon by design: The crowd is composed of fixed, simple lookbacks spread from lenMin to lenMax. You get a blended, robust view instead of a single fragile parameter.
• Two complementary lenses: Each agent evaluates RSI-style balance (via Wilder’s RMA) and momentum (EMA deviation). You decide the weight of each.
• No repaint, no MTF pitfalls: Everything runs on the chart’s timeframe with bar-close confirmation; no request.security() or forward references.
• Actionable UI: A clean consensus line, optional regime background, confidence heat, and triangle markers when thresholds are crossed.
⸻
What you see on the chart
• Consensus line (0–100): Smoothed to your preference; color/area makes bull/bear zones obvious.
• Regime coloring (optional): Light green in bull zone, light red in bear zone; neutral otherwise.
• Confidence heat: A small gauge/number (0–100) that combines distance from neutral and recent persistence.
• Markers (optional): Triangles when consensus crosses up through your bull threshold (e.g., 55) or down through your bear threshold (e.g., 45).
• Info panel (optional): Consensus value, regime, confidence, number of agents, and basic diagnostics.
⸻
How it works (under the hood)
1. Horizon bins: The range is divided into numBins. Each bin has a fixed, simple integer length (crucial for Pine’s safety rules).
2. Per-bin features (computed every bar):
• RSI-style balance using Wilder’s RMA (not ta.rsi()), then mapped to −1…+1.
• Momentum as (close − EMA(L)) / EMA(L) (dimensionless drift).
3. Agent vote: For its assigned bin, an agent forms a weighted score: score = wRSI*RSI_like + wMOM*Momentum. A small dead-band near zero suppresses chop; votes are +1/−1/0.
4. Fitness update (bar close): If the agent’s previous vote agreed with the next bar’s direction, multiply its fitness by learnGain; otherwise by learnPain. Fitness is clamped so it never explodes or dies.
5. Consensus: Weighted average of all votes using fitness as weights → map to 0–100 and smooth with EMA.
Why it doesn’t repaint:
• No future references, no MTF resampling, fitness updates only on confirmed bars.
• All TA primitives (RMA/EMA/deltas) are computed every bar unconditionally.
⸻
Signals & confidence
• Bullish bias: consensus ≥ bullThr (e.g., 55).
• Bearish bias: consensus ≤ bearThr (e.g., 45).
• Confidence (0–100):
• Distance score: how far consensus is from 50.
• Momentum score: how strong the recent change is versus its recent average.
• Combined into a single gate; start filtering entries at ≥60 for higher quality.
Tip: For range sessions, raise thresholds (60/40) and increase smoothing; for momentum sessions, lower smoothing and keep thresholds at 55/45.
⸻
Inputs you’ll actually tune
• Agents & horizons:
• N_agents (e.g., 64–128)
• lenMin / lenMax (e.g., 6–30 intraday, 10–60 swing)
• numBins (e.g., 12–24)
• Weights & smoothing:
• wRSI vs wMOM (e.g., 0.7/0.3 for FX & indices; 0.6/0.4 for crypto)
• deadBand (0.03–0.08)
• consSmooth (3–8)
• Thresholds & hygiene:
• bullThr/bearThr (55/45 default)
• cooldownBars to avoid signal spam
⸻
Playbooks (ready-to-use)
1) Breakout / Trend continuation
• Timeframe: 15m–1h for day/swing.
• Filter: Take longs only when consensus > 55 and confidence ≥ 60.
• Execution: Use your ORB/VWAP/pullback trigger for entry. Trail with swing lows or 1.5×ATR. Exit on a close back under 50 or when a bearish signal prints.
2) Mean reversion (fade)
• When: Sideways days or low-volatility clusters.
• Setup: Increase deadBand and consSmooth.
• Signal: Bearish fades when consensus rolls over below ≈55 but stays above 50; bullish fades when it rolls up above ≈45 but stays below 50.
• Targets: The neutral zone (~50) as the first take-profit.
3) Multi-TF alignment
• Keep BioSwarm on 1H for bias, execute on 5–15m:
• Only take entries in the direction of the 1H consensus.
• Skip counter-bias scalps unless confidence is very low (explicit mean-reversion plan).
⸻
Integrations that work
• DynamoSent Pro+ (macro bias): Only act when macro bias and swarm consensus agree.
• ORB + Session VWAP Pro: Trade London/NY ORB breakouts that retest while consensus >55 (long) or <45 (short).
• Levels/Orderflow: BioSwarm is your “go / no-go”; execution stays with your usual triggers.
⸻
Quick start
1. Drop the indicator on a 1H chart.
2. Start with: N_agents=64, lenMin=6, lenMax=30, numBins=16, deadBand=0.06, consSmooth=5, thresholds 55/45.
3. Trade only when confidence ≥ 60.
4. Add your favorite execution tool (VWAP/levels/OR) for entries & exits.
⸻
Non-repainting & safety notes
• No request.security(); no hidden lookahead.
• Bar-close confirmation for fitness and signals.
• All TA calls are unconditional (no “sometimes called” warnings).
• No series-length inputs to RSI/EMA — we use RMA/EMA formulas that accept fixed simple ints per bin.
⸻
Known limits & tips
• Too many signals? Raise deadBand, increase consSmooth, widen thresholds to 60/40.
• Too few signals? Lower deadBand, reduce consSmooth, narrow thresholds to 53/47.
• Over-fitting risk: Keep learnGain/learnPain modest (e.g., ×1.04 / ×0.96).
• Compute load: Large N_agents × numBins is heavier; scale to your device.
⸻
Example recipes
EURUSD 1H (swing):
lenMin=8, lenMax=34, numBins=16, wRSI=0.7, wMOM=0.3, deadBand=0.06, consSmooth=6, thr=55/45
Buy breakouts when consensus >55 and confidence ≥60; confirm with 5–15m pullback to VWAP or level.
SPY 15m (US session):
lenMin=6, lenMax=24, numBins=12, consSmooth=4, deadBand=0.05
On trend days, stay with longs as long as consensus >55; add on shallow pullbacks.
BTC 1H (24/7):
Increase momentum weight: wRSI=0.6, wMOM=0.4, extend lenMax to ~50. Use dynamic stops (ATR) and partials on strong verticals.
⸻
Final word
BioSwarm is a state engine: it tells you when the market is primed to continue or mean-revert. Pair it with your entries and risk framework to turn that state into trades. If you’d like, I can supply a companion strategy template that consumes the consensus and back-tests the three playbooks (Breakout/Fade/Flip) with standard risk management.

DynamoSent DynamoSent Pro+ — Professional Listing (Preview)
— Adaptive Macro Sentiment (v6)
— Export, Adaptive Lookback, Confidence, Boxes, Heatmap + Dynamic OB/OS
Preview / Experimental build. I’m actively refining this tool—your feedback is gold.
If you spot edge cases, want new presets, or have market-specific ideas, please comment or DM me on TradingView.
⸻
What it is
DynamoSent Pro+ is an adaptive, non-repainting macro sentiment engine that compresses VIX, DXY and a price-based activity proxy (e.g., SPX/sector ETF/your symbol) into a 0–100 sentiment line. It scales context by volatility (ATR%) and can self-calibrate with rolling quantile OB/OS. On top of that, it adds confidence scoring, a plain-English Context Coach, MTF agreement, exportable sentiment for other indicators, and a clean Light/Dark UI.
Why it’s different
• Adaptive lookback tracks regime changes: when volatility rises, we lengthen context; when it falls, we shorten—less whipsaw, more relevance.
• Dynamic OB/OS (quantiles) self-calibrates to each instrument’s distribution—no arbitrary 30/70 lines.
• MTF agreement + Confidence gate reduce false positives by highlighting alignment across timeframes.
• Exportable output: hidden plot “DynamoSent Export” can be selected as input.source in your other Pine scripts.
• Non-repainting rigor: all request.security() calls use lookahead_off + gaps_on; signals wait for bar close.
Key visuals
• Sentiment line (0–100), OB/OS zones (static or dynamic), optional TF1/TF2 overlays.
• Regime boxes (Overbought / Oversold / Neutral) that update live without repaint.
• Info Panel with confidence heat, regime, trend arrow, MTF readout, and Coach sentence.
• Session heat (Asia/EU/US) to match intraday behavior.
• Light/Dark theme switch in Inputs (auto-contrasted labels & headers).
⸻
How to use (examples & recipes)
1) EURUSD (swing / intraday blend)
• Preset: EURUSD 1H Swing
• Chart: 1H; TF1=1H, TF2=4H (default).
• Proxies: Defaults work (VIX=D, DXY=60, Proxy=D).
• Dynamic OB/OS: ON at 20/80; Confidence ≥ 55–60.
• Playbook:
• When sentiment crosses above 50 + margin with Δ ≥ signalK and MTF agreement ≥ 0.5, treat as trend breakout.
• In Oversold with rising Coach & TF agreement, take fade longs back toward mid-range.
• Alerts: Enable Breakout Long/Short and Fade; keep cooldown 8–12 bars.
2) SPY (daytrading)
• Preset: SPY 15m Daytrade; Chart: 15m.
• VIX (D) matters more; preset weights already favor it.
• Start with static 30/70; later try dynamic 25/75 for adaptive thresholds.
• Use Coach: in US session, when it says “Overbought + MTF agree → sell rallies / chase breakouts”, lean momentum-continuation after pullbacks.
3) BTCUSD (crypto, 24/7)
• Preset: BTCUSD 1H; Chart: 1H.
• DXY and BTC.D inform macro tone; keep Carry-forward ON to bridge sparse ticks.
• Prefer Dynamic OB/OS (15/85) for wider swings.
• Fade signals on weekend chop; Breakout when Confidence > 60 and MTF ≥ 1.0.
4) XAUUSD (gold, macro blend)
• Preset: XAUUSD 4H; Chart: 4H.
• Weights tilt to DXY and US10Y (handled by preset).
• Coach + MTF helps separate trend legs from news pops.
⸻
Best practices
• Theme: Switch Light/Dark in Inputs; the panel adapts contrast automatically.
• Export: In another script → Source → DynamoSent Pro+ → DynamoSent Export. Build your own filters/strategies atop the same sentiment.
• Dynamic vs Static OB/OS:
• Static 30/70: fast, universal baseline.
• Dynamic (quantiles): instrument-aware; use 20/80 (default) or 15/85 for choppy markets.
• Confidence gate: Start at 50–60% to filter noise; raise when you want only A-grade setups.
• Adaptive Lookback: Keep ON. For ultra-liquid indices, you can switch it OFF and set a fixed lookback.
⸻
Non-repainting & safety notes
• All request.security() calls use lookahead=barmerge.lookahead_off and gaps=barmerge.gaps_on.
• No forward references; signals & regime flips are confirmed on bar close.
• History-dependent funcs (ta.change, ta.percentile_linear_interpolation, etc.) are computed each bar (not conditionally).
• Adaptive lookback is clamped ≥ 1 to avoid lowest/highest errors.
• Missing-data warning triggers only when all proxies are NA for a streak; carry-forward can bridge small gaps without repaint.
⸻
Known limits & tips
• If a proxy symbol isn’t available on your plan/exchange, you’ll see the NA warning: choose a different symbol via Symbol Search, or keep Carry-forward ON (it defaults to neutral where needed).
• Intraday VIX is sparse—using Daily is intentional.
• Dynamic OB/OS needs enough history (see dynLenFloor). On short histories it gracefully falls back to static levels.
Thanks for trying the preview. Your comments drive the roadmap—presets, new proxies, extra alerts, and integrations.

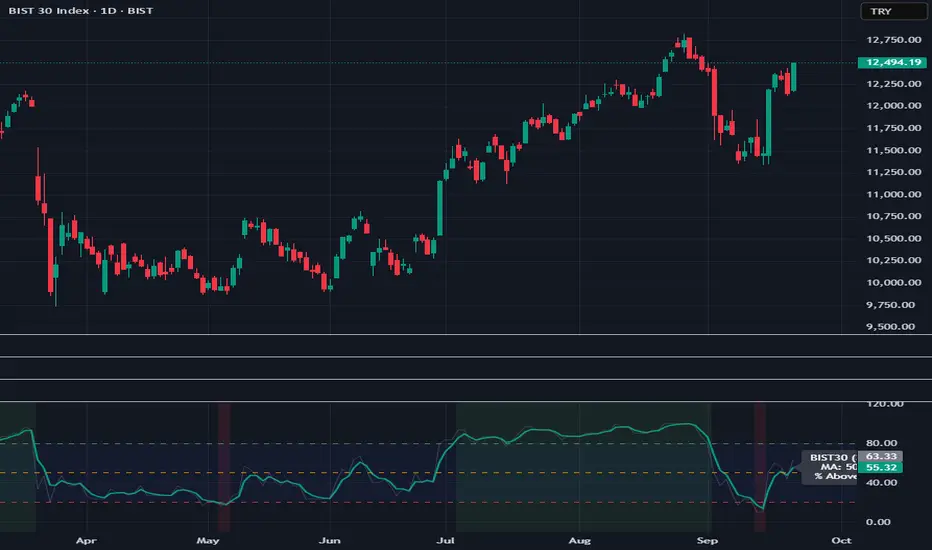
BIST30 % Above Moving Average (Breadth)
BIST30 % Above Moving Average (Breadth)
This indicator shows the percentage of BIST30 stocks trading above a selected moving average.
It is a market breadth tool, designed to measure the overall health and participation of the market.
How it works
By default, it uses the 50-day SMA.
You can switch between SMA/EMA and choose different periods (5 / 20 / 50 / 200).
The script checks each BIST30 stock individually and counts how many are closing above the chosen MA.
Interpretation
Above 80% → Overbought zone (short-term correction likely).
Below 20% → Oversold zone (potential rebound).
Around 50% → Neutral / indecisive market.
If the index (BIST:XU030) rises while this indicator falls → the rally is narrow-based, led by only a few stocks (a warning sign).
Use cases
Short-term traders → Use MA=5 or 20 for momentum signals.
Swing / Medium-term investors → Use MA=50 for market health.
Long-term investors → Use MA=200 to track bull/bear market cycles.
Notes
This script covers only BIST30 stocks by default.
The list can be updated for BIST100 or specific sectors (e.g., banks, industrials).
Breadth indicators should not be used as standalone buy/sell signals — combine them with price action, volume, and other technical tools for confirmation.
Mag 7 Weighted Performance % (Today Only)shows the cumulative weighted performance of mag 7 stocks as a percentage.

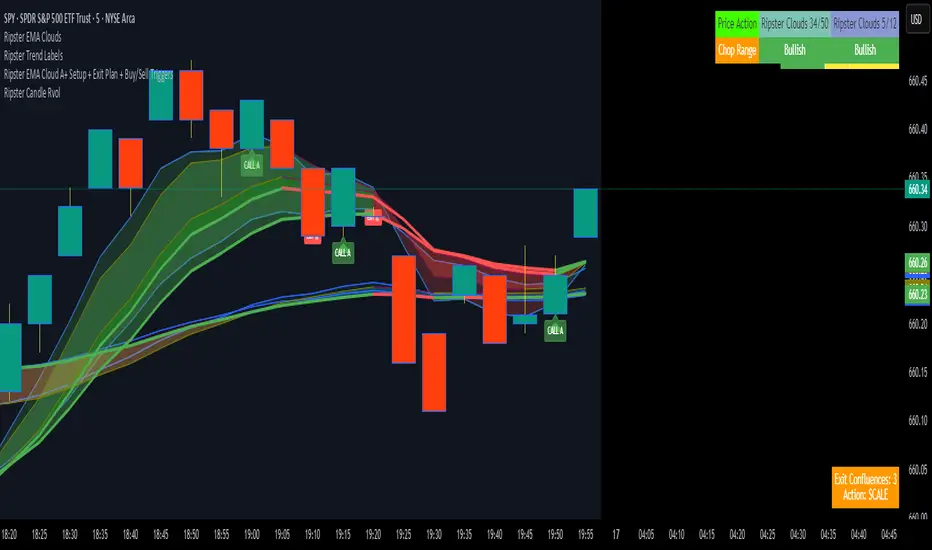
Ripster EMA Cloud A+ Setup + Exit Plan + Buy/Sell TriggersUsing the Ripster Cloud Method, a conditional system that helps with entries and exits
FX % Change TableFX % Change Table
This tool provides currency strength analysis at a glance, allowing traders to instantly identify which currencies are outperforming or underperforming without the need to manually check each pair. It offers decision support for entries and exits by helping traders align their positions with broader strength and weakness trends, such as buying the strongest currency against the weakest. Its versatility makes it suitable for any timeframe, whether used by scalpers or swing traders. Best of all, it delivers these insights in a clean and simple format, presenting complex multi-pair calculations in an easy-to-read visual display.
This tool is especially helpful for traders who incorporate currency strength analysis, correlation checks, or basket trading into their strategy. It reduces time spent flipping through charts and provides a structured overview for smarter trade decisions.
Unlike traditional single-pair indicators, this tool calculates the percentage change between the current and previous higher timeframe closes for a group of forex pairs. You can choose between two curated groups:
• Majors – EURUSD, GBPUSD, USDJPY, USDCHF, AUDUSD, NZDUSD, USDCAD
• Cross Pairs – A wide basket of EUR, GBP, AUD, NZD, CAD, and CHF crosses
For each symbol, the script requests the selected timeframe’s price data, calculates the percentage change from the previous bar’s close, and then displays it in a neatly formatted table. Green highlights strength, red highlights weakness, and gray shows neutrality — making shifts in momentum instantly recognizable.
How to Use
1. Select your timeframe – For example, "60" (1H) to view hourly change, "240" (4H) for broader moves, or "D" for daily strength/weakness.
2. Choose your group – Focus on the Majors for a macro USD view, or switch to Cross Pairs for secondary flows.
3. Position the table – Place it in any corner of your chart (top-left, top-right, bottom-left, bottom-right) to match your workspace.
The table updates dynamically at the close of each bar, ensuring the displayed data always reflects the most recent market movements.

Aggregated OI (Binance + Bybit + OKX)RU
Агрегатор Open Interest для крипты по трём биржам: Binance, Bybit, OKX/OKEX.
Показывает OI-свечи или дельту OI, есть мини-легенда (Open Interest, Rekt Longs/Shorts, Aggressive Longs/Shorts). Можно переключать биржи и единицы отображения (USD / COIN).
Данные зависят от доступности OI-тикеров в TradingView (…USDT.P_OI). Если по паре нет фида на бирже — она игнорируется. Основано на скрипте LeviathanCapital (MPL-2.0), модификация — SaneQ. Не является финсоветом.
EN
Aggregated Open Interest for crypto across Binance, Bybit, OKX/OKEX.
Plots OI candles or OI delta, plus a compact legend (Open Interest, Rekt Longs/Shorts, Aggressive Longs/Shorts). You can toggle exchanges and display units (USD / COIN).
Data depends on TV OI feeds (…USDT.P_OI). If a pair lacks a feed on an exchange, that source is skipped. Based on LeviathanCapital’s script (MPL-2.0), modified by SaneQ. Not financial advice.

Open Interest Aggregated (Lite)The Open Interest Aggregated (Lite) indicator consolidates open interest data across multiple major cryptocurrency exchanges into a single, easy-to-interpret visual. By aggregating open interest from Binance, Bybit, OKX, Bitget, and Coinbase (configurable per user preference), this indicator provides a holistic view of market positioning and trader sentiment in real time. It is designed for overlay-independent analysis, giving traders insight into derivatives market dynamics without cluttering price charts.
Key Features and Technical Details:
Aggregates open interest for USD, USDT, and USDC denominated perpetual contracts where available.
Supports configurable exchange inclusion: Binance, Bybit, OKX, Bitget, and Coinbase.
Normalizes USD-denominated open interest relative to the asset price for cross-exchange comparison.
Generates candlestick plots representing aggregated open interest: open, high, low, and close, allowing traditional technical analysis techniques (trend detection, breakouts, reversals) to be applied to derivatives positioning.
Provides optional hidden plots for each aggregated value (open, high, low, close) to support custom scripting or further analysis in Pine Script.
Color-coded candles: teal indicates an increase in open interest for the period, red indicates a decrease, highlighting shifts in trader sentiment.
Use Cases in Trading:
Trend Confirmation: Rising aggregated open interest in tandem with price increases can confirm bullish market participation, while decreasing open interest may signal weakening conviction.
Divergence Detection: Compare price action against aggregated open interest to detect potential reversals or exhaustion points.
Cross-Exchange Market Insight: By combining multiple exchanges, traders can identify shifts in global derivatives exposure rather than relying on a single market, reducing bias from localized trading anomalies.
Risk Assessment: Monitoring aggregated open interest can help anticipate periods of heightened leverage, which may correspond to increased volatility and potential liquidation events.
Why It’s Useful:
Open interest is a leading indicator of market sentiment and participation in futures markets. However, individual exchange data often provides an incomplete picture. Open Interest Aggregated (Lite) simplifies this by consolidating data across major platforms, enabling traders to make more informed decisions, assess market strength, and identify strategic entry or exit points with a clearer understanding of global positioning.
Application Notes:
Best used in combination with price analysis and volume metrics for robust trading signals.
Timeframe-independent: works on any chart interval, ensuring flexibility across intraday and longer-term strategies.
Lightweight “Lite” version ensures fast calculation while maintaining critical insights from multiple exchanges.

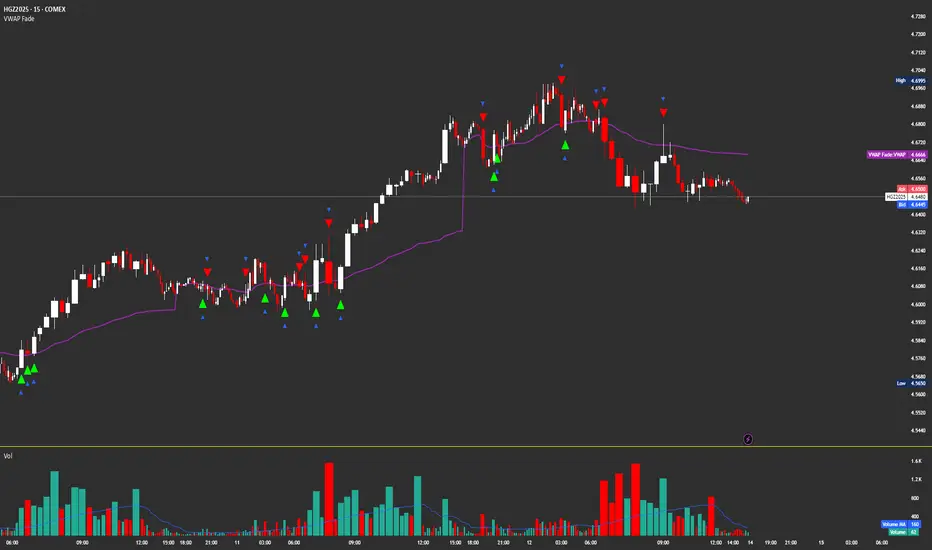
VWAP FadeVWAP fade indicator simple parameters for how it works and the logic behind VWAP fade
You can try other products but recommended for Copper/Silver futures due to how they tend to do the VWAP fade
Identify VWAP retest:
Price moves back into VWAP after trending away.
Fail condition:
Candle touches VWAP but fails to close across it (stays on trend side).
Signal:
Short if price came from below and fails to close above VWAP.
Long if price came from above and fails to close below VWAP.
Confirm with volume spike (optional filter).
Market Bias [Mario]Indicator Description: Market Bias
Core Objective and Philosophy
The Market Bias indicator is designed not as a simple signal generator, but as a comprehensive tool for trend analysis and directional bias assessment. Its primary purpose is to provide traders with a clear, at-a-glance understanding of the market's direction across multiple timeframes. By visualizing the alignment of trends, it helps traders make more informed decisions, ensuring they are trading in harmony with the broader market momentum rather than against it. This is a tool for strategic positioning, not for providing blind buy or sell commands.
How It Works: The Core Mechanic
The indicator's logic is based on the relationship between two configurable moving averages (MAs): a Fast MA (defaulting to a 9-period EMA) and a Slow MA (defaulting to a 21-period SMA). The market bias on any given timeframe is determined as follows:
Bullish Bias: When the Fast MA is trading above the Slow MA, it indicates positive, upward momentum.
Bearish Bias: When the Fast MA is trading below the Slow MA, it indicates negative, downward momentum.
Users have full control to customize the type (SMA, EMA, WMA, etc.) and length of each moving average to fit their specific trading style and the asset being analyzed.
Key Feature: The Higher Timeframe (HTF) Bias Table
This is the most powerful feature of the indicator and its main reason for existence. It displays a simple, color-coded table in the corner of the chart, showing the real-time bias for the Daily (D), 4-Hour (4H), and 1-Hour (1H) timeframes.
Purpose: The HTF table solves a critical problem for traders: losing sight of the bigger picture. A trader on a 15-minute chart might see a setup to go long, but if the 4H and Daily charts are strongly bearish, that trade is fighting a powerful current and has a lower probability of success.
Application: By checking this table, a trader can instantly verify if their intended trade direction is aligned with the higher timeframe trends. The ideal scenario is "confluence," where the bias is the same across all key timeframes (e.g., D, 4H, and 1H are all Bullish), giving the trader a strong conviction to only look for long entries.
On-Chart Visual Aids
To support the analysis on the current chart, the indicator provides several visual aids:
Moving Average Plots: Both the Fast and Slow MAs are drawn directly on the chart, allowing traders to see their interaction with price in real-time.
Color-Coded Bars: To make the current trend immediately obvious, the chart's price bars can be colored. Green bars signify a bullish bias (Fast > Slow), while red bars signify a bearish bias (Fast < Slow).
Crossover Markers (Optional): While the indicator is not a signal provider, it can optionally display "Buy" (up arrow) and "Sell" (down arrow) markers when the MAs cross. These should not be interpreted as direct trade signals. Instead, they serve as alerts that the market momentum may be shifting on the current timeframe. They are best used as points of interest or for confirming a thesis that is already supported by the HTF bias.
Summary
In essence, the Market Bias indicator is a decision-support tool. It encourages a disciplined, top-down approach to trading.
Use the HTF Table first to establish your strategic directional bias for the day or week.
Use the on-chart MAs and colored bars to analyze the trend on your preferred trading timeframe.
Use the optional crossover markers only as a final confirmation or timing tool, ensuring they align with the dominant bias established by the higher timeframes.

Chimera [theUltimator5]In myth, the chimera is an “impossible” hybrid—lion, goat, and serpent fused into one—striking to look at and formidable in presence. The word has come to mean a beautiful, improbable union of parts that shouldn’t work together, yet do.
Chimera is a dual-mode market context tool that blends a multi-input oscillator with classic ADX/DI trend strength, plus optional multi-timeframe “gap-line” tracking. Use it to visualize regime (trend vs. range), momentum swings around an adaptive midline, and higher timeframe (HTF) reference levels that auto-terminate on touch/cross.
Modes
1) Oscillator view
A smoothed composite of five common inputs—RSI, MACD (oscillator), Bollinger position, Stochastic, and an ATR/DI-weighted bias. Each is normalized to a comparable 0–100 style scale, averaged, and plotted as a candle-style oscillator (short vs. long smoothing, wickless for clarity). A dynamic midline with standard-deviation bands frames neutral → bearish/bullish zones. Colors ramp from neutral to your chosen Oversold/Overbought endpoints; consolidation can override to white.
Here is a description of the (5) signals used to calculate the sentiment oscillator:
RSI (14): Measures recent momentum by comparing average gains vs. losses. High = strength after advances; low = weakness after declines. (Z-score normalized to 0–100.)
MACD oscillator (12/26/9): Uses the difference between MACD and its signal (histogram) to gauge momentum shifts. Positive = bullish tilt; negative = bearish. (Z-score normalized.)
Bollinger Bands position (20, 2): Locates price within the bands (0–100 from lower → upper). Near upper suggests strength/expansion; near lower suggests weakness/contraction. (Then normalized.)
Stochastic (14, 3, 3): Shows where the close sits within the recent high-low range, smoothed via %D. Higher values = closes near highs; lower = near lows. (Scaled 0–100.)
ATR/DI composite (14): Volatility-weighted directional bias: (+DI − −DI) amplified by ATR as a % of price and its relative average. Positive = bullish pressure with volatility; negative = bearish. (Rank/scale normalized.)
All five are normalized and averaged into one composite, then smoothed (short/long) and compared to an adaptive midline with bands.
2) ADX view
Shows ADX, +DI, –DI with user-defined High Threshold. Transparency and color shift with regime. When ADX is strong, a directional “fire/ice” gradient fills the area between ADX and the high threshold, biased toward the dominant DI; when ADX is weak, a soft white fade highlights low-trend conditions.
HTF gap-line tracking (optional; both modes)
Detects “gap-like” reference levels after weak-trend consolidation flips into a sudden DI jump.
Anchors a line at the event bar’s open and auto-terminates upon first touch/cross (tick-size tolerance).
Auto-selects up to three higher timeframes suited to your chart resolution and prints non-overlapping lines with labels like 1H / 4H / 1D. Lower-priority duplicates are suppressed to reduce clutter.
Confirmation / repaint notes
Signals and lines finalize on bar close of the relevant timeframe.
HTF elements update only on the HTF bar close. During a forming bar they may appear transiently.
Line removal finalizes after the bar that produced the touch/cross closes.
Visual cues & effects
Oscillator candles: Open/High = long smoothing; Low/Close = short smoothing (no wicks).
Adaptive bands: Midline ± StdDev Multiplier × stdev of the blended series.
Consolidation tint: Optional white backdrop/candles when the consolidation condition is true (balance + low ADX).
Breakout VFX (optional): With strong DI/ADX and Bollinger breaks, renders a subtle “fire” flare above upper-band thrusts or “ice” shelf below lower-band thrusts.
Inputs (high-level)
Visual Style: Oscillator or ADX.
General (Oscillator): Lookback Period, Short/Long Smoothing, Standard Deviation Multiplier.
Color (Oscillator): Oversold/Overbought colors for gradient endpoints.
Plot (Oscillator): Show Candles, Show Slow MA Line, Show Individual Component (RSI/MACD/BB/Stoch/ATR).
Table (Oscillator): Show Information Table & position (compact dashboard of component values + status).
ADX / Gaps / VFX (both modes): ADX High Threshold, Highlight Backgrounds, Show Gap Labels, Visual Overlay Effects, and color choices for current-TF & HTF lines.
HTF selection: Automatic ladder (3 tiers) based on your chart timeframe.
Alerts (built-in)
Buy Signal – Primary: Oscillator exits oversold.
Sell Signal – Primary: Oscillator exits overbought.
Gap Fill Line Created (Any TF)
Gap Fill Line Terminated (Any TF)
ADX Crossed ABOVE/BELOW Low Threshold
ADX Crossed ABOVE/BELOW High Threshold
Consolidation Started
Alerts evaluate on the close of the relevant timeframe.
How to read it (quick guide)
Pick your lens: Oscillator for blended momentum around an adaptive midline; ADX for trend strength and DI skew.
Watch extremes & mean re-entries (Oscillator): Approaches to the top/bottom band show persistent momentum; returns toward the midline show normalization.
Check regime (ADX): Below Low = low-trend; above High = strong trend, with “fire/ice” bias toward +DI/–DI.
Track gap lines: Fresh labels mark new reference levels; lines auto-remove on first interaction. HTF lines add context but finalize only on HTF close.
The uniqueness from this indicator comes from multiple areas:
1. A unique multi-timeframe algorithm detects gap fill zones and plots them on the chart.
2. Visual effects for both visual modes were hand crafted to provide a visually stunning and intuitive interface.
3. The algorithm to determine sentiment uses a unique blend of weight and sensitivity adjustment to create a plot with elastic upper and lower bounds based off historical volatility and price action.

Champs LevelsEasy Bullish & Bearish sentiments to show short term trends.
How it works:
Orange line → 8 EMA
Purple line → Premarket High
Red line → Premarket Low
Background flashes green when above both, red when below both
🚀 marker = bullish breakout, ⚠ marker = bearish breakdown
Alerts for both sides

Funding Rate Aggregated (Lite)Funding Rate Aggregated (Lite) provides traders with a consolidated view of perpetual futures funding rates across multiple major exchanges. Instead of monitoring each market individually, the script aggregates the available data into a single, average funding rate series—streamlining analysis and helping identify market-wide positioning imbalances.
The indicator supports Binance, Bybit, OKX, Bitget, and Coinbase, with user-controlled toggles to enable or disable specific venues. For exchanges offering multiple quote currencies (e.g., USDT, USD, or USDC pairs) inclusion is based on whether their trading activity (volume) is relevant (determined manually, not via code). Each available rate is checked and included in the calculation only if valid, ensuring the average reflects actual market conditions.
From a technical standpoint, the script:
Retrieves real-time funding rate data directly via request.security for the current symbol’s base currency.
Applies standard formatting similar to TradingView's official indicator.
Visualizes the average funding rate with color-coded plotting (green for positive, red for negative), alongside a neutral zero reference line.
Why it is useful:
Funding rates are a direct measure of long/short market bias in perpetual swaps. Persistently high positive rates often indicate overcrowded longs, while negative rates can reveal excessive shorting.
By combining multiple exchanges into one metric, traders gain a more robust signal, reducing noise from isolated exchange-specific anomalies.
This aggregated perspective can assist in timing contrarian trades, spotting funding-driven inefficiencies, and gauging overall market sentiment.
Applications in trading include:
Sentiment analysis: Assess whether perpetual futures traders are leaning heavily long or short.
Cross-exchange confirmation: Ensure that extreme funding isn’t confined to a single venue.
Risk management: Identify periods of elevated funding costs that may erode profitability in longer-term positions.
Strategy filters: Integrate the aggregated rate as a condition for entries/exits, or to adjust position sizing during extremes.
The Lite designation emphasizes simplicity and efficiency: the indicator avoids unnecessary visual and data-driven clutter and focuses on delivering one clear, aggregated signal that can be adapted to a wide range of trading styles.

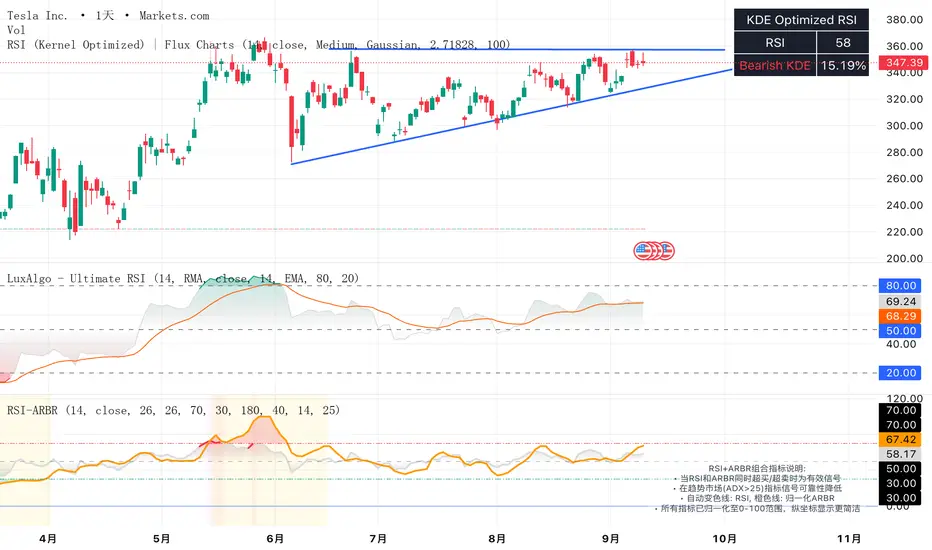
RSI + ARBR 组合指标The RSI + ARBR indicator mainly harmonizes the values of the two indicators, enabling investors to exit at market tops or buy at market bottoms when market sentiment surges or collapses.
### 补充说明:
- **RSI**:全称为Relative Strength Index(相对强弱指数),是常用的技术分析指标,用于衡量市场多空双方力量的对比。
- **ARBR**:由AR(Activity Ratio,人气指标)和BR(Buying Ratio,意愿指标)两个子指标组成,主要反映市场交易的活跃程度和投资者的买卖意愿。
- 句中“逃顶”译为“exit at market tops”,“抄底”译为“buy at market bottoms”,均为金融领域常用表达,准确对应“在高位卖出规避风险”和“在低位买入等待上涨”的操作含义。