One for AllOne for All (OFA) - Complete ICT Analysis Suite
Version 3.3.0 by theCodeman
📊 Overview
One for All (OFA) is a comprehensive TradingView indicator designed for traders who follow Inner Circle Trader (ICT) concepts. This all-in-one tool combines essential ICT analysis features—sessions, kill zones, previous period levels, and higher timeframe candles with Fair Value Gaps (FVGs) and Volume Imbalances (VIs)—into a single, highly customizable indicator. Whether you're a beginner learning ICT concepts or an experienced trader refining your edge, OFA provides the visual structure needed for precise market analysis and execution.
✨ Key Features
- 🏷️ Customizable Watermark**: Display your trading identity with customizable titles, subtitles, symbol info, and full style control
- 🌍 Trading Sessions**: Visualize Asian, London, and New York sessions with high/low lines, range boxes, and open/close markers
- 🎯 Kill Zones**: Highlight 5 critical ICT kill zones with precise timing and visual boxes
- 📈 Previous Period H/L**: Track Daily, Weekly, and Monthly highs/lows with customizable styles and lookback periods
- 🕐 Higher Timeframe Candles**: Display up to 5 HTF timeframes with OHLC trace lines, timers, and interval labels
- 🔍 FVG & VI Detection**: Automatically detect and visualize Fair Value Gaps and Volume Imbalances on HTF candles
- ⚙️ Universal Timezone Support**: Works globally with GMT-12 to GMT+14 timezone selection
- 🎨 Full Customization**: Control colors, styles, visibility, and layout for every feature
🚀 How to Use
Watermark Setup
The watermark overlay helps you identify your charts and maintain focus on your trading principles:
1. Enable/disable watermark via "Show Watermark" toggle
2. Customize the title (default: "Name") to display your trading name or account identifier
3. Set up to 3 subtitles (default: "Patience", "Confidence", "Execution") as trading reminders
4. Choose position (9 locations available), size, color, and transparency
5. Toggle symbol and timeframe display as needed
Use Case: Display your trading principles or account name for multi-monitor setups or content creation.
Trading Sessions Analysis
Sessions define market character and liquidity availability:
1. Enable "Show All Sessions" to visualize all three sessions
2. Adjust timezone to match your local market (default: UTC-5 for EST)
3. Customize session times if needed (defaults cover standard hours)
4. Enable session range boxes to see consolidation zones
5. Use session high/low lines to identify key levels for the current session
6. Enable open/close markers to track session transitions
Use Case: Identify which session you're trading in, track session highs/lows for liquidity, and anticipate session transition volatility.
Kill Zones Trading
Kill zones are ICT's high-probability trading windows:
1. Enable individual kill zones or use "Show All Kill Zones"
2. **Asian Kill Zone** (2000-0000 GMT): Early positioning and smart money accumulation
3. **London Kill Zone** (0300-0500 GMT): European market opening volatility
4. **NY AM Kill Zone** (0930-1100 EST): Post-NYSE open expansion
5. **NY Lunch Kill Zone** (1200-1300 EST): Midday consolidation or manipulation
6. **NY PM Kill Zone** (1330-1600 EST): Afternoon positioning and closes
7. Customize colors and times to match your trading style
8. Set max days display to control historical visibility (default: 30 days)
Use Case: Focus entries during high-probability windows. Watch for liquidity sweeps at kill zone openings and institutional positioning.
Previous Period High/Low Levels
Previous period levels act as magnetic price targets and support/resistance:
1. Enable Daily (PDH/PDL), Weekly (PWH/PWL), or Monthly (PMH/PML) levels individually
2. Set lookback period (how many previous periods to display)
3. Choose line style: Solid (current emphasis), Dashed (standard), or Dotted (subtle)
4. Customize colors per timeframe for visual hierarchy
5. Adjust line width (1-5) for visibility preference
6. Enable gradient effect to fade older periods
7. Position labels left or right based on chart layout
8. Customize label text for your preferred notation
Use Case: Identify key levels where price is likely to react. Daily levels work on intraday timeframes, Weekly on daily charts, Monthly for swing trading.
Higher Timeframe (HTF) Candles
HTF candles reveal the larger market context while trading lower timeframes:
1. Enable up to 5 HTF slots simultaneously (default: 5m, 15m, 1H, 4H, Daily)
2. Choose display mode: "Below Chart" (stacked rows) or "Right Side" (compact column)
3. Customize timeframe, colors (bull/bear), and titles for each slot
4. **OHLC Trace Lines**: Visual lines connecting HTF candle levels to chart bars
5. **HTF Timer**: Countdown showing time remaining until HTF candle close
6. **Interval Labels**: Display day of week (Daily+) or time (intraday) on each candle
7. For Daily candles: Choose open time (Midnight, 8:30, 9:30) to match your market structure preference
Use Case: Trade lower timeframes while respecting higher timeframe structure. Watch for HTF candle closes to confirm directional bias.
FVG & VI Detection
Fair Value Gaps and Volume Imbalances highlight inefficiencies that price often revisits:
1. **Fair Value Gaps (FVGs)**: Detected when HTF candle wicks don't overlap between 3 consecutive candles
- Bullish FVG: Gap between candle 1 high and candle 3 low (green box by default)
- Bearish FVG: Gap between candle 1 low and candle 3 high (red box by default)
2. **Volume Imbalances (VIs)**: Similar detection but focuses on body gaps
- Bullish VI: Gap between candle 1 close and candle 3 open
- Bearish VI: Gap between candle 1 open and candle 3 close
3. Enable FVG/VI detection per HTF slot individually
4. Customize colors and transparency for each imbalance type
5. Boxes appear on chart at formation and remain visible as retracement targets
**Use Case**: Identify high-probability retracement zones. Price often returns to fill FVGs and VIs before continuing the trend. Use as entry zones or profit targets.
🎨 Customization
OFA is built for flexibility. Every feature includes extensive customization options:
Visual Customization
- **Colors**: Independent color control for every element (sessions, kill zones, lines, labels, FVGs, VIs)
- **Transparency**: Adjust box and label transparency (0-100%) for clean charts
- **Line Styles**: Choose Solid, Dashed, or Dotted for previous period lines
- **Sizes**: Control text size, line width, and box borders
- **Positions**: Place watermark in 9 positions, labels left/right
Layout Control
- **HTF Display Mode**: "Below Chart" for detailed analysis, "Right Side" for space efficiency
- **Drawing Limits**: Set max days for sessions/kill zones to manage chart clutter
- **Lookback Periods**: Control how many previous periods to display (1-10)
- **Gradient Effects**: Enable fading for older previous period lines
Timing Adjustments
- **Timezone**: Universal GMT offset selector (-12 to +14) for global markets
- **Session Times**: Customize each session's start/end times
- **Kill Zone Times**: Adjust kill zone windows to match your market's characteristics
- **Daily Open**: Choose Midnight, 8:30, or 9:30 for Daily HTF candle open time
💡 Best Practices
1. Start Simple: Enable one feature at a time to learn how each element affects your analysis
2. Match Your Timeframe: Use Daily levels on intraday charts, Weekly on daily charts, HTF candles one or two levels above your trading timeframe
3. Kill Zone Focus: Concentrate your trading activity during kill zones for higher probability setups
4. HTF Confirmation: Wait for HTF candle closes before committing to directional bias
5. FVG/VI Entries: Look for price to return to unfilled FVGs/VIs for entry opportunities with favorable risk/reward
6. Customize Colors: Use a consistent color scheme that matches your chart theme and reduces visual fatigue
7. Reduce Clutter: Disable features you're not actively using in your current trading plan
8. Session Context: Understand which session controls the market—trade with session direction or anticipate reversals at session transitions
⚙️ Settings Guide
OFA organizes settings into logical groups for easy navigation:
- **═══ WATERMARK ═══**: Title, subtitles, position, style, symbol/timeframe display
- **═══ SESSIONS ═══**: Enable/disable sessions, times, colors, high/low lines, boxes, markers
- **═══ KILL ZONES ═══**: Individual kill zone toggles, times, colors, max days display
- **═══ PREVIOUS H/L - DAILY ═══**: Daily high/low lines, style, color, lookback, labels
- **═══ PREVIOUS H/L - WEEKLY ═══**: Weekly high/low lines, style, color, lookback, labels
- **═══ PREVIOUS H/L - MONTHLY ═══**: Monthly high/low lines, style, color, lookback, labels
- **═══ HTF CANDLES ═══**: Global display mode, layout settings
- **═══ HTF SLOT 1-5 ═══**: Individual HTF configuration (timeframe, colors, title, FVG/VI detection, trace lines, timer, interval labels)
Each setting includes tooltips explaining its function. Hover over any input for detailed guidance.
📝 Final Notes
One for All (OFA) represents a complete ICT analysis toolkit in a single indicator. By combining watermark customization, session visualization, kill zone highlighting, previous period levels, and higher timeframe candles with FVG/VI detection, OFA eliminates the need for multiple indicators cluttering your chart.
**Version**: 3.3.0
**Author**: theCodeman
**Pine Script**: v6
**License**: Mozilla Public License 2.0
Start with default settings to learn the indicator's structure, then customize extensively to match your personal trading style. Remember: tools provide information, but your edge comes from disciplined execution of a proven strategy.
Happy Trading! 📈
Sessions

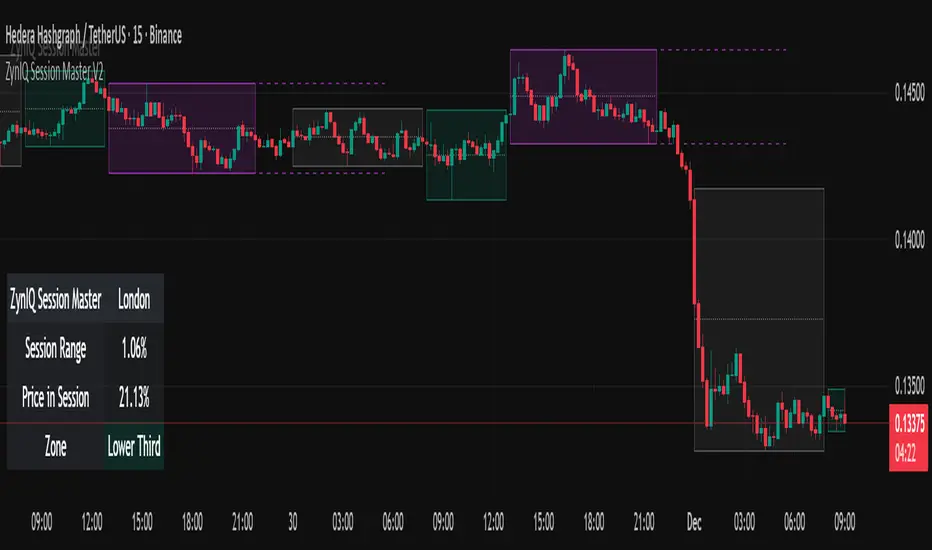
ZynIQ Session Master v2 - (Lite Pack)Overview
ZynIQ Session Master v2 (Lite) highlights key market sessions and their associated ranges, helping traders understand when volatility tends to shift between Asian, London and New York sessions. It provides clean visual context for intraday trading without overwhelming the chart.
Key Features
• Automatic detection and shading of major trading sessions
• Configurable session highlighting
• Optional range markers for Asia, London and New York
• Lightweight visuals suitable for fast intraday charting
• Simple session-based structure for context around volatility shifts
• Optional labels marking session transitions
Use Cases
• Seeing where session volatility typically increases
• Identifying when price is leaving a session range
• Timing trades around session opens
• Combining session structure with breakout, trend or momentum tools
Notes
This script provides session structure and volatility context. It is not a standalone trading system. Use alongside your preferred confirmation and risk management.
All-in-One (PHT)All-in-One (PHT) — Modular Multi-Tool Market Analyzer (Pine Script v6)
All-in-One (PHT) is a complete, modular market-analysis toolkit designed for traders who want clean, reliable, and professional-grade charting - in a single indicator.
Built using Pine Script® v6 and structured with reusable PHT-Libraries (EMA Band, Bollinger Band, Fractal, Session), this indicator delivers clarity, precision, and consistent performance across all markets and timeframes.
Unlike traditional indicators that mix logic and visuals, AIO (PHT) uses a fully modular architecture. All calculations come from dedicated libraries, and this main script focuses purely on visual output and clean plotting.
This ensures:
Stable plot references
Zero repainting in all included modules
High performance even with complex overlays
Easy extensibility for future upgrades
🔥 Included Modules
1. EMA Band (PHT Library)
A triple-EMA band designed for trend clarity and structure.
Provides:
EMA of High
EMA of Close
EMA of Low
Band fill visualization
Ideal for identifying trend strength, momentum pockets, and mean-reversion zones.
2. Bollinger Band Suite
A complete Bollinger framework with:
SMA / EMA / WMA midline options
Dual standard-deviation envelopes
Multi-zone band fills (upper, middle, lower)
User-controlled visibility for each layer
Perfect for volatility detection, squeeze identification, and precision envelope trading.
3. Fractal Engine (High/Low Pivots)
Fast, reliable fractal detection using user-defined left/right periods.
Features:
Pivot Highs & Pivot Lows
Multiple marker sizes (Tiny → Large)
Zero-lag plotting with proper offset handling
Useful for swing structure, breakout confirmation, and automated level marking.
4. Market Session Tracker
A powerful session-mapping module that visually highlights market sessions with:
Dynamic session boxes
High & Low markers
Persistent historical sessions
Auto-managed labels, lines, and live updates
Timezone-aware session boundaries (supports IANA zones)
Designed for identifying daily ranges, session liquidity, volatility pockets, and market timing.
🧠 Why This Indicator Is Different
Most “all-in-one” tools mix plotting, logic, and calculations in a single heavy script, causing lag, reference instability, and repainting issues.
All-in-One (PHT) solves this by using a Pine v6 library architecture:
Each component is computed in its own library
The main script handles only visuals
No hidden code, no repainting tricks
Maximum clarity and maintainability
This design mirrors professional software architecture:
clear separation of logic, visuals, and user interface.
🎯 Ideal For
Trend traders
Scalpers & intraday traders
Swing and positional traders
Volatility analysts
Structure-based price action traders
Anyone who wants multiple high-quality tools in one clean indicator
Whether you analyze markets manually or build algorithmic systems, AIO (PHT) provides a solid foundation.
⚙️ Features at a Glance
Fully modular Pine v6 design
Complete EMA band engine
Advanced Bollinger band system (multi-deviation, multi-fill)
Configurable fractal high/low markers
Smart session boxing with history
Clean visuals and transparent settings
No repainting
Fully customizable colors & visibility
Optimized for performance
💡 How to Use
Choose the modules you want to display (EMA, BB, Fractals, Sessions).
Adjust lengths, deviations, or fractal periods as per your trading style.
Use session boxes to understand volatility timing.
Combine bands + fractals for advanced structure-based decisions.
The indicator is designed to overlay on price for maximum clarity.
🚀 Future Upgrades
The PHT framework supports smooth future expansion. Planned modules include:
ATR/volatility engines
Trend switches
Supertrend/Donchian plugins
Volume profile extensions
Updates will remain backward compatible across all modules.
⭐ Summary
All-in-One (PHT) is not just another overlay — it’s a complete multi-tool trading framework built using professional engineering practices in Pine Script v6.
If you want cleaner charts, smarter signals, and a high-performance modular system, this indicator gives you everything in one reliable package.

RCV Essentials════════════════════════════════════════════
RCV ESSENTIALS - MULTI-TIMEFRAME & SESSION ANALYSIS TOOL
════════════════════════════════════════════
📊 WHAT THIS INDICATOR DOES
This professional-grade indicator combines two powerful analysis modules:
1. TRADING SESSION TRACKER - Visualizes high/low ranges for major global market sessions (NY Open, London Open, Asian Session, etc.)
2. MULTI-TIMEFRAME CANDLE DISPLAY - Shows up to 8 higher timeframes simultaneously on your chart (15m, 30m, 1H, 4H, 1D, 1W, 1M, 3M)
════════════════════════════════════════════
🎯 KEY FEATURES
════════════════════════════════════════════
TRADING SESSIONS MODULE:
✓ Track up to 6 custom trading sessions simultaneously
✓ Real-time high/low range detection during active sessions
✓ Pre-configured for NYO (7-9am), LNO (2-3am), Asian Session (4:30pm-12am)
✓ 60+ global timezone options
✓ Customizable colors, labels, and transparency
✓ Daily divider lines (optional Sunday skip for traditional markets)
✓ Only displays on ≤30m timeframes for optimal clarity
MULTI-TIMEFRAME CANDLES MODULE:
✓ Display 1-8 higher timeframes with up to 10 candles each
✓ Real-time candle updates (non-repainting)
✓ Fully customizable colors (separate bullish/bearish for body/border/wick)
✓ Adjustable candle width, spacing, and positioning
✓ Smart label system (top/bottom/both, aligned or follow candles)
✓ Automatic timeframe validation (only shows TFs higher than chart)
✓ Memory-optimized with automatic cleanup
════════════════════════════════════════════
🔧 HOW IT WORKS
════════════════════════════════════════════
TECHNICAL IMPLEMENTATION:
Session Tracking Algorithm:
• Detects session start/end using time() function with timezone support
• Continuously monitors and updates high/low during active session
• Finalizes range when session ends using var persistence
• Draws boxes using real-time bar_index positioning
• Maintains session ranges across multiple days for reference
Multi-Timeframe System:
• Uses ta.change(time()) detection to identify new MTF candle formation
• Constructs candles using custom Type definitions (Candle, CandleSet, Config)
• Stores OHLC data in arrays with automatic size management
• Renders using box objects (bodies) and line objects (wicks)
• Updates current candle every tick; historical candles remain static
• Calculates dynamic positioning based on user settings (offset, spacing, width)
Object-Oriented Architecture:
• Custom Type "Candle" - Stores OHLC values, timestamps, visual elements
• Custom Type "CandleSet" - Manages arrays of candles + settings per timeframe
• Custom Type "Config" - Centralizes all display configuration
• Efficient memory management via unshift() for new candles, pop() for old
Performance Optimizations:
• var declarations minimize recalculation overhead
• Conditional execution (sessions only on short timeframes)
• Maximum display limits prevent excessive object creation
• Timeframe validation at barstate.isfirst reduces redundant checks
════════════════════════════════════════════
📈 HOW TO USE
════════════════════════════════════════════
SETUP:
1. Add indicator to chart (works best on 1m-30m timeframes)
2. Open Settings → "Trading Sessions" group
- Enable desired sessions (NYO, LNO, AS, or custom)
- Select your timezone from 60+ options
- Adjust colors and transparency
3. Open Settings → "Multi-TF Candles" group
- Enable timeframes (TF1-TF8)
- Configure each timeframe and display count
- Customize colors and layout
READING THE CHART:
• Session boxes show high/low ranges during active sessions
• MTF candles display to the right of current price
• Labels identify each timeframe (15m, 1H, 4H, etc.)
• Real-time updates on the most recent MTF candle
TRADING APPLICATIONS:
Session Breakout Strategy:
→ Identify session high/low (e.g., Asian session 16:30-00:00)
→ Wait for break above/below range
→ Confirm with higher timeframe candle close
→ Enter in breakout direction, stop at opposite side of range
Multi-Timeframe Confirmation:
→ Spot setup on primary chart (e.g., 5m)
→ Verify 15m, 1H, 4H candles align with trade direction
→ Only take trades where higher TFs confirm
→ Exit when higher TF candles show reversal
Combined Session + MTF:
→ Asian session establishes range overnight
→ London Open breaks Asian high
→ Confirm with bullish 15m + 1H candles
→ Enter long with stop below Asian high
════════════════════════════════════════════
🎨 ORIGINALITY & INNOVATION
════════════════════════════════════════════
What makes this indicator original:
1. INTEGRATED DUAL-MODULE DESIGN
Unlike separate session or MTF indicators, this combines both in a single performance-optimized script, enabling powerful correlation analysis between session behavior and timeframe structure.
2. ADVANCED RENDERING SYSTEM
Uses custom Pine Script v5 Types with dynamic box/line object management instead of basic plot functions. This enables:
• Precise visual control over positioning and spacing
• Real-time updates without repainting
• Efficient memory handling via automatic cleanup
• Support for 8 simultaneous timeframes with independent settings
3. INTELLIGENT SESSION TRACKING
The algorithm continuously recalculates ranges bar-by-bar during active sessions, then preserves the final range. This differs from static zone indicators that simply draw fixed boxes at predefined levels.
4. MODULAR ARCHITECTURE
Custom Type definitions (Candle, CandleSet, Config) create extensible, maintainable code structure while supporting complex multi-timeframe operations with minimal performance impact.
5. PROFESSIONAL FLEXIBILITY
Extensive customization: 6 configurable sessions, 8 timeframe slots, 60+ timezones, granular color/sizing/spacing controls, multiple label positioning modes—adaptable to any market or trading style.
6. SMART VISUAL DESIGN
Automatic timeframe validation, dynamic label alignment options, and intelligent spacing calculations ensure clarity even with multiple timeframes displayed simultaneously.
════════════════════════════════════════════
⚙️ CONFIGURATION OPTIONS
════════════════════════════════════════════
TRADING SESSIONS:
• Session 1-6: On/Off toggles
• Time Ranges: Custom start-end times
• Labels: Custom text for each session
• Colors: Individual color per session
• Timezone: 60+ options (Americas, Europe, Asia, Pacific, Africa)
• Range Transparency: 0-100%
• Outline: Optional border
• Label Display: Show/hide session names
• Daily Divider: Dotted lines at day changes
• Skip Sunday: For traditional markets vs 24/7 crypto
MULTI-TF CANDLES:
• Timeframes 1-8: Enable/disable individually
• Timeframe Selection: Any TF (seconds to months)
• Display Count: 1-10 candles per timeframe
• Bullish Colors: Body/Border/Wick (independent)
• Bearish Colors: Body/Border/Wick (independent)
• Candle Width: 1-10+ bars
• Right Margin: 0-200+ bars from edge
• TF Spacing: Gap between timeframe groups
• Label Color: Any color
• Label Size: Tiny/Small/Normal/Large/Huge
• Label Position: Top/Bottom/Both
• Label Alignment: Follow Candles or Align
════════════════════════════════════════════
📋 TECHNICAL SPECIFICATIONS
════════════════════════════════════════════
• Pine Script Version: v5
• Chart Overlay: True
• Max Boxes: 500
• Max Lines: 500
• Max Labels: 500
• Max Bars Back: 5000
• Update Frequency: Real-time (every tick)
• Timeframe Compatibility: Chart TF must be lower than selected MTFs
• Session Display: Activates only on ≤30 minute timeframes
• Memory Management: Automatic cleanup via array operations

Thiru-KillzonesThiru Killzones - Advanced Trading Session Indicator
Overview
Thiru Killzones is a comprehensive trading session indicator designed to help traders identify and analyze key market sessions throughout the trading day. It visualizes five major trading sessions (Asia, London, NY AM, Lunch, NY PM) with customizable opening range analysis, target levels, and statistical tracking.
Key Features
📊 Trading Sessions
5 Major Sessions: Asia, London, NY AM, Lunch, NY PM
Customizable Times: Configure each session's start and end time
Individual Colors: Each session can have its own color
Enable/Disable: Turn sessions on/off individually
Session Extension: Extend sessions beyond normal hours (especially useful for Asia session)
📈 Opening Range Analysis
Configurable Duration: Set opening range period (default: 60 minutes)
Breakout Flags: Visual indicators when price breaks target levels
Target Visualization: Optional boxes and lines at target levels
Performance Tracking: Statistics table showing hit rates for each target level
🎨 Visual Styles
Choose from 4 unique visual styles:
Frame: Full box with borders (default)
Shade: Background fill only (no borders)
Horizon: Horizontal lines marking session boundaries
Rails: Horizontal lines with vertical orientation option
🏷️ Labels & Display
Customizable Labels: Show session name, day, price range, or pips
Flexible Positioning: Top/Bottom/Center, Inside/Outside, Left/Center/Right
Auto-hide on Daily+: Automatically hides labels on daily timeframe and higher
Multiple Sizes: Auto/Tiny/Small/Normal/Large/Huge
📊 Statistics & Analysis
Session Statistics Table: Compare current session range vs average
Value Format: Display as Price or Pips
⚙️ Advanced Settings
Timezone Support: 27 timezone options (GMT-11 to GMT+12)
Timeframe Filtering: Hide indicator on higher timeframes
History Control: Control how many historical sessions to display
Unified Colors: Option to use same color for all sessions
Transparency Control: Separate transparency for boxes and borders
Border Customization: Solid/Dash/Dot styles with adjustable width
How to Use
Basic Setup
1. Add the indicator to your chart
2. Configure your timezone in Settings
3. Enable the sessions you want to track
4. Customize colors and visual style
Opening Range Analysis
1. Enable "Opening Range" for desired sessions
2. Set the duration (default: 60 minutes)
3. Enable target lines/boxes to see R1/R2/S1/S2 levels
4. Enable breakout flags to see when price breaks levels
5. Enable data table to track statistics
Session Extension
1. Enable "Extended Range" for sessions that cross midnight (like Asia)
2. The indicator automatically calculates the session end time
3. Opening range lines will stop exactly at session end time
Customization
- Use "Visual Style" section to change box appearance
- Use "Labels" section to customize label display
- Use "Unified Colors" to apply same color scheme to all sessions
- Adjust transparency for cleaner chart appearance
Default Session Times
- Asia: 18:00-00:00 (crosses midnight)
- London: 02:00-05:00
- NY AM: 08:30-10:00
- Lunch: 12:00-13:00
- NY PM: 13:30-16:00
*Note: Times are in your selected timezone*
Tips
- Use "History Periods" to control how many past sessions are displayed
- Enable "Hide on Daily+" for labels to keep daily charts clean
- Use "Current Only" in opening range to show only active session
- Enable statistics tables to track session performance over time
- Use session extension for Asia session to properly handle midnight crossover
Attribution
This indicator uses the following community libraries:
- boitoki/AwesomeColor/9 (color utilities)
- boitoki/Utilities/11 (utility functions)
All enhancements and features are original implementations.
Support
For questions or issues, please contact me @thirudinesh through TradingView.
---
© 2025 thirudinesh

Sessions & ORB Pro | Bifrost InstituteSessions & ORB Pro | BI
Professional Session Analysis and Opening Range Breakout Tracker
This advanced indicator provides comprehensive session tracking and Opening Range Breakout (ORB) analysis across multiple global trading sessions. Designed for intraday traders, this tool helps identify key support and resistance levels, session volatility patterns, and potential breakout opportunities.
Overview
Session-based trading is crucial for understanding market behavior, as different global sessions (US, European, Asian) exhibit distinct characteristics in terms of volatility, volume, and price action. This indicator allows traders to:
Identify Session Highs and Lows: Track the boundaries of each trading session to spot key support/resistance levels
Monitor Opening Range Breakouts: Capture the first 5, 15, or 30 minutes of major exchange openings to identify early directional bias
Analyze Multi-Session Patterns: View up to 4 concurrent or sequential sessions with full historical data
Customize Visual Analysis: Tailor colors, styles, and overlays for each session independently
Key Features
Multi-Session Support
Configure up to 4 independent trading sessions (US, Europe, Asia, Custom)
Fully customizable session times with timezone support (UTC offset, Chart timezone, or Exchange timezone)
Daylight Savings Time adjustment for accurate session timing
Session range boxes with adjustable transparency and outline styles
Historical session tracking (1-20 previous sessions)
Opening Range Breakout (ORB)
Track Opening Range for major exchanges: NYSE, LSE, TSE, TSX, ASX, HKEX, SSE
Configurable ORB periods: 5-minute, 15-minute, or 30-minute ranges
Visual ORB boxes with customizable colors and outline styles
ORB High/Low lines with optional extension beyond session close
Individual color control for each session's ORB
Session Analytics
Session High/Low: Horizontal lines marking the session's price extremes
Trendline: Linear regression trendline showing session directional bias
Mean: Session average price for mean reversion analysis
VWAP: Volume-weighted average price for institutional level analysis
Range Boxes: Visual representation of each session's price range
Advanced Customization
Individual Color Pickers: Set unique colors for each overlay type per session
Line Styles: Choose between Solid, Dashed, or Dotted for all line types
Label Options: Customize labels to show Date (d/M), Day of Week (ddd), and/or Price
Extend Options: Extend Session H/L and ORB lines beyond current bar
Outline Styles: Independent control of Range and ORB outline appearance
Information Dashboard
Optional real-time dashboard displaying:
Session Status: Open/Closed indicator for each session
Trend: R² correlation coefficient showing directional strength
Volume: Cumulative session volume
σ (Sigma): Session standard deviation for volatility analysis
Range: Session High, Low, and Range in points
ORB: Opening Range High, Low, and Range in points
Dashboard is fully customizable with toggleable columns and adjustable size/position.
Flexible Configuration
Time Zone Management: Three modes for precise session timing
Historical Display: Show/hide previous sessions for cleaner charts
Label Customization: Independent label size and content options for Session H/L vs ORB
Range Settings: Adjustable transparency, outlines, and label positioning
Use Cases
Session Traders: Identify when specific markets are most active and volatile
ORB Traders: Capture early session momentum and breakout opportunities
Support/Resistance: Use session highs/lows as key price levels
VWAP Strategies: Track institutional activity through session VWAP
Multi-Market Analysis: Monitor overlap between global trading sessions
Default Configuration
The indicator comes pre-configured with US (NYSE), Europe (LSE), and Asia (TSE) sessions, making it immediately useful for forex, indices, and global equity traders. Session D is available for custom session requirements.
Perfect for day traders, scalpers, and swing traders who rely on session-based analysis and institutional order flow.

GT3_Trades Sessions Highs & LowsThis indicator automatically identifies and displays the session highs and lows for the three major global market sessions: Asia, London, and New York. It is designed for intraday traders who rely on session-based structure, liquidity levels, and volatility windows. The script dynamically tracks and plots the highest and lowest price reached during each session and extends these levels forward on the chart for strong visual clarity.
Key Features
Session-Based Highs & Lows
Calculates and updates the high and low for each session (Asia, London, New York) in real time as price develops within the session window.
Fully Customizable Display Options
Traders can individually toggle the visibility of each session’s high and low levels.
Line colors, styles (Solid, Dashed, Dotted), and thickness are also user-configurable.
Accurate Timezone Handling
Session times are defined using user-selected timezone settings (default UTC+3), ensuring session boundaries match the trader’s desired market timing.
Automatic Daily Reset
At the start of each new trading day, the indicator clears the previous levels and begins tracking fresh highs and lows for the new day.
Dynamic Line Drawing
Each level is plotted using real Pine Script line objects, which update automatically as new highs or lows form. Once created, each line extends forward to the right—providing clear, persistent references for potential liquidity zones, breakouts, and reversions.
Efficient Tracking Logic
The script keeps track of the bar index where each high/low occurs and updates the line endpoints in real time. Historical levels are not reused, ensuring clean, uncluttered visuals.
How It Helps Traders
Identifies liquidity pools and sweep areas based on session extremes.
Highlights intraday structure shifts when price breaks or respects session highs/lows.
Provides a clear overview of volatility cycles across the global trading day.
Helps detect potential reversal or continuation setups when interacting with session boundaries.
Ideal For
Intraday and scalping strategies
ICT-based session analysis
Liquidity, sweep, and FVG traders
Forex, indices, crypto, and commodities

Manipulation Model [FB]GENERAL OVERVIEW:
The Manipulation Model indicator is a complete rule-based system that identifies and confirms setups from the Funded Brothers Manipulation Model. It detects large impulsive candles, called Manipulation Candles and Almost Manipulation Candles, that form around key market levels such as session highs/lows, daily, weekly, and monthly levels, or higher timeframe Fair Value Gaps (FVGs). Using this structure, the indicator automatically marks long, short, bulltrap, and beartrap setups with predefined entry, stop loss, and take profit areas.
This indicator was developed by Flux Charts in collaboration with the Funded Brothers.
ATTRIBUTION NOTICE:
This indicator incorporates concepts and source code from the indicator “MCs with Alerts” authored by @hamza_xau on TradingView. We have received full written permission from the original author to use and commercialize this code within this invite-only script.
Original script: MCs with Alerts:
What is the purpose of the indicator?:
The indicator automates detection of the Manipulation Model trading strategy setups by combining candle structure, key levels, session timing, and higher timeframe Fair Value Gaps. It removes discretion by enforcing fixed conditions for valid signals and automatically managing entry, stop-loss, and take-profit logic.
What is the theory behind the indicator?:
The indicator is built on how price interacts with major reference points such as session highs and lows, or daily and weekly levels. These levels are commonly referenced in technical analysis as areas where price previously reversed or consolidated. Manipulation Candles identify moments when price breaks past these reference points on both sides of the prior candle before closing firmly in one direction. When these candles form near higher timeframe Fair Value Gaps, it reflects price reacting inside an area that previously showed directional imbalance. The higher timeframe EMA filter aligns all detected setups with the broader market trend, allowing only signals that match the dominant direction.
MANIPULATION MODEL FEATURES:
Manipulation Candlesticks
Almost Manipulation Candlesticks
Higher Timeframe Fair Value Gaps
Sessions
Key Levels
Signals
Dashboard
Alerts
MANIPULATION CANDLESTICKS:
Manipulation Candlesticks (MCs) are candles that sweep both sides of the previous candle’s range and close outside of it. In the Manipulation Model indicator, these candles form the foundation for the long/short setups. Once one forms, the indicator checks its position relative to sessions, key levels, and higher timeframe Fair Value Gaps to determine if a valid setup exists.
🔹What is a Manipulation Candlestick?
A Manipulation Candlestick (MC) is defined by structure rather than size. It forms when price takes out both the high and low of the previous candle, then closes outside that range.
A bullish Manipulation Candle occurs when price sweeps below the previous candle’s low and then closes above the previous candle’s high.
A bearish Manipulation Candle occurs when price sweeps above the previous candle’s high and then closes below the previous candle’s low.
🔹How to interpret and use Manipulation Candlesticks:
Manipulation Candlesticks show where price made a strong one-sided move after taking both sides of the previous candle’s range. When one forms, it marks an area where buyers or sellers were likely trapped as price moved aggressively in one direction.
A bullish MC shows strong buying after a false move lower. Price sweeps below the prior low, takes out the prior high, and closes above the previous range, confirming buyers are in control.
A bearish MC shows strong selling after a false move higher than the previous candle’s high. Price sweeps above the prior high, drops below the prior low, and closes beneath the previous range, confirming sellers are dominant.
🔹How Manipulation Candlesticks are identified:
The indicator confirms Manipulation Candles using three filters once a candle closes:
Sweep Condition:
Price must take both sides of the previous candle’s range, moving above its high and below its low, before closing outside that range.
Directional Close:
A bullish MC must close above the previous high, and a bearish MC must close below the previous low.
Wick Confirmation:
A bullish MC must have a smaller upper wick (high - close) than lower wick (open - low), and a bearish MC must have a smaller lower wick (close - low) than upper wick (high - open).
Once these conditions are met at candle close, it is confirmed as a bullish or bearish Manipulation Candle.
🔹Bullish Manipulation Candle
A bullish Manipulation Candle forms when price sweeps below the previous candle’s low, then breaks above its high, and closes above it. The lower wick must be larger than the upper wick, showing little pullback as price pushed upward and confirming strong buying pressure.
🔹Bearish Manipulation Candle
A bearish Manipulation Candle forms when price sweeps above the previous candle’s high, then drops below its low, and closes beneath it. The upper wick must be larger than the lower wick, showing little pullback as price moved downward and confirming strong selling pressure.
🔹Manipulation Candle Visuals
When the indicator detects a Manipulation Candle, it automatically changes the candle’s color on the chart. Both bullish and bearish Manipulation Candles use the same color. Users can change this color in the settings by adjusting the “Manipulation Candlestick” option found under the “Style Customization” section.
The candle coloring feature can also be turned off entirely, which only removes the visual highlight from the chart and does not affect the signals or any of the indicator’s underlying logic that uses Manipulation Candlesticks.
ALMOST MANIPULATION CANDLESTICKS:
Almost Manipulation Candlesticks (AMCs) are similar to Manipulation Candles, except they close inside the previous candle’s range instead of outside it. In the Manipulation Model indicator, these candles help identify when price is showing the same sweeping behavior but hasn’t yet confirmed full displacement. They act as early warnings that a manipulation event may be developing. Just like Manipulation Candles, the indicator checks an AMC’s position relative to sessions, key levels, and higher timeframe Fair Value Gaps to determine if a valid setup exists.
🔹What is an Almost Manipulation Candlestick?
An Almost Manipulation Candlestick (AMC) forms when price sweeps both the high and low of the previous candle and closes inside that candle’s range.
A bullish AMC occurs when price sweeps below the previous low, moves above the previous high, and closes within the previous candle’s body instead of above it.
A bearish AMC occurs when price sweeps above the previous high, drops below the previous low, and closes within the previous candle’s body instead of beneath it.
🔹How to Interpret and Use Almost Manipulation Candlesticks:
Almost Manipulation Candles highlight hesitation or early signs of manipulation.
A bullish AMC indicates buyers pushed price up after sweeping lower, but price did not close decisively above the prior high.
A bearish AMC indicates sellers pushed price down after sweeping higher, but price did not close decisively below the prior low.
🔹How Almost Manipulation Candlesticks are identified:
The indicator confirms Almost Manipulation Candles using the same sweep and wick logic as Manipulation Candles, except the candle’s close must remain inside the previous candle’s range:
Sweep Condition:
Price must take both sides of the previous candle’s range, moving above its high and below its low.
Candle Close Location:
The candle’s close must stay within the prior candle’s range.
Wick Confirmation:
For a bullish AMC, the lower wick must be larger than the upper wick. For a bearish AMC, the upper wick must be larger than the lower wick.
Once these conditions are met at candle close, it is confirmed as a bullish or bearish Almost Manipulation Candle.
🔹Bullish Almost Manipulation Candle
A bullish AMC forms when price sweeps below the previous candle’s low, moves above the prior candle’s high, and closes back inside the previous candle’s range. The lower wick must be larger than the upper wick, showing that buyers defended lower prices but the move did not close decisively upward.
🔹Bearish Almost Manipulation Candle
A bearish AMC forms when price sweeps above the previous candle’s high, drops below the previous candle’s low, and closes back inside the previous candle’s range. The upper wick must be larger than the lower wick, showing that sellers rejected higher prices but the candle did not close decisively lower.
🔹Almost Manipulation Candle Visuals
When the indicator detects an Almost Manipulation Candle, it automatically changes the candle’s color on the chart. Both bullish and bearish Almost Manipulation Candles use the same color. Users can change this color in the settings by adjusting the “Almost Manipulation Candlestick” option found under the “Style Customization” section.
The candle coloring feature can also be turned off entirely, which only removes the visual highlight from the chart and does not affect the signals or any of the indicator’s underlying logic that uses Almost Manipulation Candlesticks.
HIGHER TIMEFRAME FAIR VALUE GAPS:
The Manipulation Model indicator automatically plots Fair Value Gaps from two user-selected higher timeframes.
🔹What is a Fair Value Gap?:
A Fair Value Gap (FVG) is an area where the market’s perception of fair value suddenly changes. On your chart, it appears as a three-candle pattern: a large candle in the middle, with smaller candles on each side that don’t fully overlap it. A bullish FVG forms when a bullish candle is between two smaller bullish/bearish candles, where the first and third candles’ wicks don’t overlap each other at all. A bearish FVG forms when a bearish candle is between two smaller bullish/bearish candles, where the first and third candles’ wicks don’t overlap each other at all.
Bullish & Bearish FVGs:
🔹Why are Fair Value Gaps important?:
Fair Value Gaps (FVGs) show where price moved so quickly that one side of the market never got a chance to trade. They represent sudden shifts in what traders believe something is worth, where “fair value” changed. When a large candle drives straight through an area without overlap from the candles before and after it, it means buyers or sellers were so aggressive that the market skipped that price zone entirely.
These gaps matter because they mark the moment when confidence in price changes. If price rallies and never pulls back, it signals that traders accept the new higher prices as fair and are willing to keep buying there. The same logic applies in reverse for bearish gaps. They tell you where the market re-priced aggressively and where value was last accepted.
🔹How are Fair Value Gaps used?:
Higher Timeframe FVGs are used as a confluence for all setups within the Manipulation Model indicator. The indicator automatically detects and plots these imbalances from the chosen higher timeframe onto the current chart. When a Manipulation or Almost Manipulation Candle forms near or inside a higher timeframe Fair Value Gap, it adds context to the setup. They are not trade signals by themselves but act as a supporting element that contextualizes setups.
🔹When are Higher Timeframe Fair Value Gaps mitigated?
A Higher Timeframe Fair Value Gap is considered mitigated when the selected higher timeframe closes above the gap for a bearish FVG or below the gap for a bullish FVG.
🔹Higher Timeframe FVG Settings:
Timeframe 1 / Timeframe 2:
Select up to two higher timeframes to use for Fair Value Gaps. Disabling either one removes it visually from the chart but does not affect signal generation. However, the timeframes you select will be used for signal generation logic.
For example, if you select the 1-hour and 4-hour timeframes, then the 1-hour and 4-hour FVGs will be used for signal generation logic, which is explained in the signals section below.
Combine Zones:
When enabled, overlapping FVGs on the same higher timeframe are merged into a single zone. This keeps the chart clean and prevents duplicate zones from displaying.
Midline:
Adds a center line through each higher timeframe FVG.
Labels:
Displays a “ FVG” label beside each zone. This helps users see which timeframe the FVG is detected from.
Color Customization:
Each timeframe has separate color settings for bullish and bearish FVGs. Users can adjust these colors independently for both timeframes to fit their chart layout.
FVG Display Limit:
Controls how many higher timeframe FVGs are shown at once. Only the nearest X active gaps to current price will appear, helping maintain a clear view of relevant imbalances.
SESSIONS:
The Manipulation Model indicator includes six customizable trading sessions: Asia, London, NY AM, NYSE, London Close, and NY PM. All session times and visuals are fully user-configurable. Each session has adjustable start and end times that can be set to match your preferred schedule. Users can also customize visuals for each session, including the color, opacity, and visibility of session zones.
Session highs and lows are automatically tracked and used within the indicator’s signal logic. When a Manipulation or Almost Manipulation Candle forms near a session high or low, it is recognized within the indicator’s signal detection.
Default times used for each session (in EST):
Asia: 20:00 - 00:00
London: 02:00 - 05:00
NY AM: 08:00 - 09:30
NYSE: 09:30 - 10:00
London Close: 10:00 - 11:00
NY PM: 11:00 - 14:00
🔹Session Settings:
Session Boxes:
Each session has a box that outlines its active time window. These boxes can be toggled on or off independently. When active, they visually separate each part of the trading day. Users can adjust the color and opacity of each session box.
Session Highs/Lows:
Every session can display its own high and low as horizontal lines. Users can customize the line style for session highs/lows, choosing between solid, dashed, or dotted. The color of the lines will match the same color used for the session box.
Labels and Price Display:
Labels can be toggled on for all session highs and lows. Users can adjust label color, text size, and choose whether to show the price next to the label. Users can adjust the text size, choosing between tiny, small, normal, large, and huge.
Extend Levels:
When enabled, each session’s high and low levels can be extended forward by a set number of bars.
Session Titles:
Titles for each enabled session (e.g., “Asia,” “London,” “NY AM”) can be displayed directly on the chart.
Show Last:
The “Show Last” setting allows you to choose how many recent sessions of each type appear on the chart. For example, if you only have the Asia session enabled and have this setting set to 2, the recent two Asia sessions will be displayed.
🔹Sessions Used
Under the “Sessions Used” section in the settings, users can choose which sessions are active for signal generation. Only sessions enabled here will produce signals. For example, if you want setups to form only during the London session, turn off all other sessions in this section.
Disabling a session under the main Sessions section only hides its visuals (boxes, lines, or labels). It does not impact signal detection or logic. However, changing a session’s start and end time in either section will affect signals, since signals are tied to the exact session windows defined by the user. This distinction ensures you have full control over what’s displayed visually versus what contributes to active trade signal logic.
Please Note: Signals are only detected and plotted on your chart during sessions. Signals can not be detected outside of session time windows.
KEY LEVELS:
The Manipulation Model indicator includes 10 key market levels that outline important structural price areas across daily, weekly, and monthly timeframes. These levels include the Daily Open, Previous Day High/Low, Weekly Open, Previous Week High/Low, Monthly Open, Previous Month High/Low, and Midnight Open. The levels can be enabled or disabled and customized in color and line style. These levels are used for the indicator’s signal logic.
🔹Daily Open
The Daily Open marks where the current trading day began.
🔹Previous Day High/Low
The Previous Day High (PDH) marks the highest price reached during the previous regular trading session. It shows where buyers pushed price to its highest point before the market closed. This value is automatically pulled from the daily chart and projected forward onto intraday timeframes.
The Previous Day Low (PDL) marks the lowest price reached during the previous regular trading session. It shows where selling pressure reached its lowest point before buyers stepped in. Like the PDH, this level is retrieved from the prior day’s data and extended into the current session.
🔹Weekly Open
The Weekly Open marks the first price of the current trading week.
🔹Previous Week High/Low
The Previous Week High (PWH) marks the highest price reached during the previous trading week. It shows where buying pressure reached its peak before the weekly close. This value is automatically pulled from the weekly chart and extended forward into the current week for easy reference on intraday timeframes.
The Previous Week Low (PWL) marks the lowest price reached during the previous trading week. It shows where sellers pushed price to its lowest point before buyers regained control. Like the PWH, this level is sourced from the prior week’s data and projected onto the current week’s chart.
🔹Monthly Open
The Monthly Open marks the opening price of the current month.
🔹Previous Month High/Low
The Previous Month High (PMH) marks the highest price reached during the previous calendar month. It represents the point at which buyers achieved the strongest push before the monthly close. This level is automatically retrieved from the monthly chart and extended into the new month on all lower timeframes.
The Previous Month Low (PML) marks the lowest price reached during the previous calendar month. It shows where selling pressure was strongest before buyers stepped back in. Like the PMH, this value is pulled from the prior month’s data and extended into the new month on all lower timeframes.
🔹Midnight Open
The Midnight Open marks the first price of the trading day at 00:00 EST.
🔹Customization Options:
Users can fully customize the appearance of all key levels, including the following:
Daily Levels: Daily Open, PDH, and PDL
Weekly Levels: Weekly Open, PWH, and PWL
Monthly Levels: Monthly Open, PMH, and PML
Midnight Open
Color Settings:
Each group of levels (Daily, Weekly, Monthly) shares a single color for the Open, High, and Low lines. For example, the Daily Open, PDH, and PDL all use the same color. Colors can be changed for each group, but not for individual levels within the same group.
Line Style:
Users can select a global line style, choosing between solid, dashed, or dotted, for all Daily, Weekly, and Monthly levels. This style applies to all levels within those groups. For example, the Weekly Open, PWH, and PWL must all share the same line style.
The Midnight Open has its own independent line style setting and can use a different style from the other key levels.
Show Labels:
When enabled, text labels appear to the right of each key level. Users can adjust label color, but only one label color is applied to all levels for consistency.
🔹Key Levels Used:
Under the “Key Levels Used” section, users can choose which Key Levels and Session Levels (Session Highs/Lows) are factored into signal generation. Only levels enabled here are considered within the logic that confirms setups.
Users can choose between the following levels:
Daily Open
Previous Day High/Low
Weekly Open
Previous Week High/Low
Monthly Open
Previous Month High/Low
Asia Session High/Low
London Session High/Low
NY AM Session High/Low
NY Lunch Session High/Low
NY PM Session High/Low
London Close Session High/Low
Midnight Open
For example, if you only want to see setups that form using the Daily and Weekly levels, you should only enable the Daily Open, Previous Day High/Low, Weekly Open, and Previous Week High/Low.
Disabling a level in the main “Key Levels” section only hides its visuals, while disabling it in “Key Levels Used” removes it entirely from the signal logic. Adjusting or removing any level in this section directly affects how setups are detected since the indicator references these levels when confirming Long, Short, Bulltrap, and Beartrap setups.
SIGNALS:
The Manipulation Model indicator automatically identifies Long, Short, Bulltrap, and Beartrap setups based on the interaction between Manipulation Candles (MCs), Almost Manipulation Candles (AMCs), and two main entry conditions: Key Levels and Fair Value Gaps (FVGs).
Each signal type uses the structure of a Manipulation or Almost Manipulation Candle as its foundation. When one of these candles forms and aligns with the entry conditions, the indicator automatically plots labels for an entry, stop loss (SL), and take profit (TP). Every signal follows a mechanical set of rules and is marked in real time. Once confirmed on a candle close, the signal remains fixed on the chart and does not repaint.
🔹Higher Timeframe Bias Filter
Before a signal is generated, the indicator automatically determines directional bias using the 50-period Exponential Moving Average (EMA) on the 1-hour timeframe.
If price is above the 50 EMA, only bullish setups are allowed.
If price is below the 50 EMA, only bearish setups are allowed.
🔹Stop Loss and Take Profit Logic:
For every setup, the stop loss is placed at the low of the Manipulation or Almost Manipulation Candle for bullish setups, and at the high for bearish setups. The take profit is automatically calculated at a 1:1 risk-to-reward ratio relative to that distance.
Users can adjust both the SL Multiplier and TP Multiplier in the settings, under the “General Configuration” section, to extend or contract these levels. For example, increasing the TP Multiplier to 1.5 sets the take profit at 1.5x the distance between the entry and stop loss.
🔹Signal Input Settings:
Candle Type:
Choose which candle type is used to generate signals. Options include:
Manipulation Candle (MC) only
Almost Manipulation Candle (AMC) only
Both (signals are generated from either candle type)
Entry Method:
Determines whether signals are generated based on:
Key Levels only
Fair Value Gaps only
Both (signals are generated from Key Levels AND Fair Value Gaps)
Setup Types:
You can enable or disable specific setup types. Only the selected setup types will appear on your chart:
Long Setups
Short Setups
Bulltrap Setups
Beartrap Setups
🔹Long Setup – Manipulation Candle + Key Level:
A long setup forms when a bullish Manipulation Candle touches a toggled-on key level under the “Key Levels Used” section and closes above it during a toggled-on session from the “Sessions Used” section. After the candle closes and price is above the 1-hour 50 EMA, the indicator marks:
Entry: At the close of the bullish Manipulation Candle
Stop Loss: At the low of the same candle
Take Profit: Equal distance above the entry, based on TP multiplier
In this example, a bullish MC touches the PDH during the London Session and closes above the level:
🔹Short Setup – Manipulation Candle + Key Level
A short setup forms when a bearish Manipulation Candle touches a toggled-on key level under the “Key Levels Used” section and closes below it during a toggled-on session from the “Sessions Used” section. After the candle closes and price is below the 1-hour 50 EMA, the indicator marks:
Entry: At the close of the bearish Manipulation Candle
Stop Loss: At the high of the same candle
Take Profit: Equal distance below the entry, based on the TP Multiplier
In this example, a bearish MC touches the Daily Open during the NY AM Session and closes below the level:
🔹Trap Confirmation Settings
Two settings control how bulltrap and beartrap setups are confirmed once a Manipulation or Almost Manipulation Candle forms.
Candles Between Confirmation:
This setting defines the maximum number of candles allowed between the initial Manipulation Candle and the confirmation candle that closes back in the opposite direction.
For example, if this value is set to 2, the confirmation candle must appear within two bars of the Manipulation Candle for the setup to remain valid. If too many candles form in between, the bull/bear trap setup is ignored.
Trap Wick-to-Body Ratio:
This input measures the ratio of the confirmation candle’s wick size to its body size for bulltrap and beartrap setups. Lower values require a larger body compared to the wick, meaning the confirmation candle must close more decisively. If the ratio is above the threshold set by the user, the confirmation candle for a bulltrap/beartrap setup is considered valid.
For example, if the wick is 10 points and the body is 10 points, the ratio is 1.0 (10 / 10). If the wick is 10 points and the body is 20 points, the ratio is 0.5 (10 / 20).
🔹Beartrap Setup – Manipulation Candle + Key Level
A beartrap setup forms when a bearish Manipulation Candle touches a toggled-on key level under the “Key Levels Used” section. The candle does not need to close above or below the level, it only needs to touch it. After this bearish MC forms, a confirmation candle must close back above the MC’s high during an enabled session under the “Sessions Used” section. The sweep or initial touch can occur before or outside the session, but the confirmation candle must close within an active session window.
To confirm the setup, the following conditions must be met:
The confirmation candle must close within the limit set by the Candles Between Confirmation input.
Its wick-to-body ratio must be less than or equal to the Trap Wick-to-Body Ratio input
Once these conditions are met and price is above the 1-hour 50 EMA, the indicator marks:
Entry: At the close of the confirmation candle
Stop Loss: At the low of the confirmation candle
Take Profit: Equal distance above the entry, measured 1:1 from the candle’s body and scaled by the TP Multiplier
In this example, a bearish Manipulation Candle touches the Daily Open level before price reverses and a confirmation candle closes above it. The confirmation candle occurs during the Asia Session, has a strong body with minimal wicks, meeting the Trap Wick-to-Body Ratio requirement, and it forms just two candles after the bearish MC which is within the limit set by the Candles Between Confirmation input.
🔹Bulltrap Setup – Manipulation Candle + Key Level
A bulltrap setup forms when a bullish Manipulation Candle touches a toggled-on key level under the “Key Levels Used” section. The MC does not need to close above or below the level, it only needs to touch it. After this bullish MC forms, a confirmation candle must close back below the MC’s low during an enabled session under the “Sessions Used” section. The initial key level touch from the MC can occur before or outside the session, but the confirmation candle must close within an active session window.
To confirm the setup, the following conditions must be met:
The confirmation candle must close within the limit set by the Candles Between Confirmation input.
Its wick-to-body ratio must be less than or equal to the Trap Wick-to-Body Ratio input.
Once these conditions are met and price is below the 1-hour 50 EMA, the indicator marks:
Entry: At the close of the confirmation candle
Stop Loss: At the high of the confirmation candle
Take Profit: Equal distance below the entry, measured 1:1 from the candle’s body and scaled by the TP Multiplier
In this example, a bullish Manipulation Candle touches the Daily Open level before price reverses and a confirmation candle closes below it. The confirmation candle forms during the NY AM Session, has a strong body with minimal wicks that meet the Trap Wick-to-Body Ratio requirement, and it appears two candles after the bullish MC which is within the limit defined by the Candles Between Confirmation input.
🔹Long Setup – Almost Manipulation Candle + Key Level
A long setup forms when a bullish Almost Manipulation Candle (AMC) touches a toggled-on key level under the “Key Levels Used” section and closes above it during a toggled-on session from the “Sessions Used” section. After the candle closes and price is above the 1-hour 50 EMA, the indicator marks:
Entry: At the close of the bullish Almost Manipulation Candle
Stop Loss: At the low of the same candle
Take Profit: Equal distance above the entry, based on the TP Multiplier
In this example, a bullish AMC touches the Daily Open during the NYSE Session and closes above the level.
🔹Short Setup – Almost Manipulation Candle + Key Level
A short setup forms when a bearish Almost Manipulation Candle (AMC) touches a toggled-on key level under the “Key Levels Used” section and closes below it during a toggled-on session from the “Sessions Used” section. After the candle closes and price is below the 1-hour 50 EMA, the indicator marks:
Entry: At the close of the bearish Almost Manipulation Candle
Stop Loss: At the high of the same candle
Take Profit: Equal distance below the entry, based on the TP Multiplier
In this example, a bearish AMC touches the Midnight Open during the NY AM Session and closes below the level.
🔹Beartrap Setup – Almost Manipulation Candle + Key Level
A beartrap setup forms when a bearish Almost Manipulation Candle (AMC) touches a toggled-on key level under the “Key Levels Used” section. The candle does not need to close above or below the level, it only needs to touch it. After this bearish AMC forms, a confirmation candle must close back above the AMC’s high during an enabled session under the “Sessions Used” section. The initial touch can occur before or outside the session, but the confirmation candle must close within an active session window.
To confirm the setup, the following conditions must be met:
The confirmation candle must close within the limit set by the Candles Between Confirmation input.
Its wick-to-body ratio must be less than or equal to the Trap Wick-to-Body Ratio input.
Once these conditions are met and price is above the 1-hour 50 EMA, the indicator marks:
Entry: At the close of the confirmation candle
Stop Loss: At the low of the confirmation candle
Take Profit: Equal distance above the entry, measured 1:1 from the candle’s body and scaled by the TP Multiplier
In this example, a bearish AMC touches the Midnight Open before price reverses and a confirmation candle closes above it. The confirmation candle forms during the London Session, has a large body with minimal wicks that meet the Trap Wick-to-Body Ratio requirement, and appears seven candles after the bearish AMC which is within the Candles Between Confirmation limit (10 by default).
🔹Bulltrap Setup – Almost Manipulation Candle + Key Level
A bulltrap setup forms when a bullish AMC touches a toggled-on key level under the “Key Levels Used” section. The candle does not need to close above or below the level; it only needs to touch it. After this bullish AMC forms, a confirmation candle must close back below the AMC’s low during an enabled session under the “Sessions Used” section. The initial touch can occur before or outside the session, but the confirmation candle must close within an active session window.
To confirm the setup, the following conditions must be met:
The confirmation candle must close within the limit set by the Candles Between Confirmation input.
Its wick-to-body ratio must be less than or equal to the Trap Wick-to-Body Ratio input.
Once these conditions are met and price is below the 1-hour 50 EMA, the indicator marks:
Entry: At the close of the confirmation candle
Stop Loss: At the high of the confirmation candle
Take Profit: Equal distance below the entry, measured 1:1 from the candle’s body and scaled by the TP Multiplier
In this example, a bullish AMC touches the NY Lunch Session Low before price reverses and a confirmation candle closes below it. The confirmation candle forms during the Asia Session, has a strong body with minimal wicks that meet the Trap Wick-to-Body Ratio requirement, and appears six candles after the bullish AMC which is within the Candles Between Confirmation limit.
🔹Long Setup – Manipulation Candle + Fair Value Gap
A long setup forms when a bullish Manipulation Candle touches a bullish higher timeframe Fair Value Gap (FVG) from one of the two higher timeframe inputs under the “Fair Value Gaps” section. The candle must close during an enabled session under the “Sessions Used” section. After the candle closes and price is above the 1-hour 50 EMA, the indicator marks:
Entry: At the close of the bullish Manipulation Candle
Stop Loss: At the low of the same candle
Take Profit: Equal distance above the entry, scaled by the TP Multiplier
In this example, a bullish MC taps into a bullish 1-hour FVG during the Asia Session.
🔹Short Setup – Manipulation Candle + Fair Value Gap
A short setup forms when a bearish Manipulation Candle touches a bearish higher timeframe FVG from one of the two selected higher timeframe inputs under the “Fair Value Gaps” section. The candle must also close during an enabled session under the “Sessions Used” section. After the candle closes and price is below the 1-hour 50 EMA, the indicator marks:
Entry: At the close of the bearish Manipulation Candle
Stop Loss: At the high of the same candle
Take Profit: Equal distance below the entry, scaled by the TP Multiplier
In this example, a bearish MC taps a bearish 1-hour FVG during the Asia Session.
🔹Beartrap Setup – Manipulation Candle + Fair Value Gap
A beartrap setup forms when a bearish Manipulation Candle touches a bullish or bearish higher timeframe FVG from one of the two higher timeframe inputs under the “Higher Timeframe FVG Settings” section. After the bearish MC forms, price must reverse and a confirmation candle must close above the bearish MC’s high during an enabled session under the “Sessions Used” section. The initial touch of the FVG can occur before or outside the session, but the confirmation candle must close within an active session window.
To confirm the setup, the following conditions must be met:
The confirmation candle must close within the limit set by the Candles Between Confirmation input.
Its wick-to-body ratio must be less than or equal to the Trap Wick-to-Body Ratio input.
Once these conditions are met and price is above the 1-hour 50 EMA, the indicator marks:
Entry: At the close of the confirmation candle
Stop Loss: At the low of the confirmation candle
Take Profit: Equal distance above the entry, measured 1:1 from the candle’s body and scaled by the TP Multiplier
In this example, a bearish MC taps a 1-hour bearish FVG, price reverses, and a confirmation candle closes above the bearish MC’s high. The confirmation candle forms during the London Session, has a strong body with minimal wicks that meet the Trap Wick-to-Body Ratio requirement, and appears two candles after the bearish MC which is within the Candles Between Confirmation limit.
🔹Bulltrap Setup – Manipulation Candle + Fair Value Gap
A bulltrap setup forms when a bullish MC touches a bearish or bullish higher timeframeFVG from one of the two higher timeframe inputs under the “Higher Timeframe FVG Settings” section. After the bullish MC forms, price must reverse and a confirmation candle must close below the MC’s low during an enabled session under the “Sessions Used” section. The initial touch of the FVG can occur before or outside the session, but the confirmation candle must close within an active session window.
To confirm the setup, the following conditions must be met:
The confirmation candle must close within the limit set by the Candles Between Confirmation input.
Its wick-to-body ratio must be less than or equal to the Trap Wick-to-Body Ratio input.
Once these conditions are met and price is below the 1-hour 50 EMA, the indicator marks:
Entry: At the close of the confirmation candle
Stop Loss: At the high of the confirmation candle
Take Profit: Equal distance below the entry, measured 1:1 from the candle’s body and scaled by the TP Multiplier
In this example, a bullish MC taps a 4-hour bearish FVG, price reverses, and a confirmation candle closes below the bullish MC’s low. The confirmation candle forms during the NY PM Session, has a strong body with minimal wicks that meet the Trap Wick-to-Body Ratio requirement, and appears six candles after the bullish MC which is within the Candles Between Confirmation limit.
🔹Long Setup – Almost Manipulation Candle + Fair Value Gap
A long setup forms when a bullish AMC touches a bullish higher timeframe FVG from one of the two higher timeframe inputs under the “Fair Value Gaps” section. The candle must close during an enabled session under the “Sessions Used” section. After the candle closes and price is above the 1-hour 50 EMA, the indicator marks:
Entry: At the close of the bullish AMC
Stop Loss: At the low of the same candle
Take Profit: Equal distance above the entry, scaled by the TP Multiplier
In this example, a bullish AMC taps into a bullish 1-hour FVG during the London Session.
🔹Short Setup – Almost Manipulation Candle + Fair Value Gap
A short setup forms when a bearish AMC touches a bearish higher timeframe FVG from one of the two selected higher timeframe inputs under the “Fair Value Gaps” section. The candle must also close during an enabled session under the “Sessions Used” section. After the candle closes and price is below the 1-hour 50 EMA, the indicator marks:
Entry: At the close of the bearish AMC
Stop Loss: At the high of the same candle
Take Profit: Equal distance below the entry, scaled by the TP Multiplier
In this example, a bearish AMC taps a bearish 1-hour FVG during the NY PM Session.
🔹Beartrap Setup – Almost Manipulation Candle + Fair Value Gap
A beartrap setup forms when a bearish AMC touches a bullish or bearish higher timeframe FVG from one of the two higher timeframe inputs under the “Higher Timeframe FVG Settings” section. After the bearish AMC forms, price must reverse and a confirmation candle must close above the bearish AMC’s high during an enabled session under the “Sessions Used” section. The initial touch of the FVG can occur before or outside the session, but the confirmation candle must close within an active session window.
To confirm the setup, the following conditions must be met:
The confirmation candle must close within the limit set by the Candles Between Confirmation input.
Its wick-to-body ratio must be less than or equal to the Trap Wick-to-Body Ratio input.
Once these conditions are met and price is above the 1-hour 50 EMA, the indicator marks:
Entry: At the close of the confirmation candle
Stop Loss: At the low of the confirmation candle
Take Profit: Equal distance above the entry, measured 1:1 from the candle’s body and scaled by the TP Multiplier
In this example, a bearish AMC taps a 4-hour bearish FVG, price reverses, and a confirmation candle closes above the bearish AMC’s high. The confirmation candle forms during the NY PM Session, has a strong body with minimal wicks that meet the Trap Wick-to-Body Ratio requirement, and appears seven candles after the bearish AMC, which is within the Candles Between Confirmation limit.
🔹Bulltrap Setup – Almost Manipulation Candle + Fair Value Gap
A bulltrap setup forms when a bullish AMC touches a bearish or bullish higher timeframe FVG from one of the two higher timeframe inputs under the “Higher Timeframe FVG Settings” section. After the bullish AMC forms, price must reverse and a confirmation candle must close below the AMC’s low during an enabled session under the “Sessions Used” section. The initial touch of the FVG can occur before or outside the session, but the confirmation candle must close within an active session window.
To confirm the setup, the following conditions must be met:
The confirmation candle must close within the limit set by the Candles Between Confirmation input.
Its wick-to-body ratio must be less than or equal to the Trap Wick-to-Body Ratio input.
Once these conditions are met and price is below the 1-hour 50 EMA, the indicator marks:
Entry: At the close of the confirmation candle
Stop Loss: At the high of the confirmation candle
Take Profit: Equal distance below the entry, measured 1:1 from the candle’s body and scaled by the TP Multiplier
In this example, a bullish AMC taps a 1-hour bullish FVG, price reverses, and a confirmation candle closes below the bullish AMC’s low. The confirmation candle forms during the Asia Session, has a strong body with minimal wicks that meet the Trap Wick-to-Body Ratio requirement, and appears six candles after the bullish AMC, which is within the Candles Between Confirmation limit.
🔹Signal Style Customization
The Manipulation Model indicator provides full visual customization for all signal elements, allowing users to easily adjust the appearance of entry, stop loss, and take profit labels.
Label Colors:
Users can customize the label color for Long Setups (Long and Beartrap) and Short Setups (Short and Bulltrap).
Long and Beartrap setups share the same label color.
Short and Bulltrap setups share the same label color.
Label text color can also be customized and applied globally to all signal labels.
Stop Loss (SL) and Take Profit (TP) Labels:
The SL and TP label colors can be customized independently.
Users can toggle SL Labels and TP Labels on or off. When turned off, the corresponding labels are hidden, but their levels remain active on the chart.
Entry, Stop Loss, and Take Profit Lines:
Each of these lines can be individually toggled on or off.
Entry Line: Marks the entry price level.
Stop Loss Line: Displays the SL level derived from each setup’s logic.
Take Profit Line: Displays the TP level calculated using the Take Profit Multiplier setting.
Users can also toggle the labels for each line on or off and adjust the color for each line type independently.
WIN RATE DASHBOARD:
The Win Rate Dashboard gives traders a quick way to see the recent performance of their enabled setups. It automatically calculates and displays win rates for each signal type turned on under the “General Configuration” section, based on the sessions and key levels currently active in the settings.
The dashboard updates in real time, showing both the win rate percentage and total trade count for all enabled signal types combined. It looks back at a set number of bars to calculate results, providing a simple performance snapshot directly on your chart.
How It Works:
When a signal triggers, the indicator tracks whether price first reaches the Take Profit (TP) or Stop Loss (SL) level.
A winning trade is recorded when the take profit is hit before the stop loss.
A losing trade is recorded when the stop loss is hit before the take profit.
The win rate = (Winning Trades / Total Trades) x 100
🔹Dashboard Customization:
Users can adjust the dashboard’s appearance with the following settings:
Background Color
Frame Color
Border Color
Text Color
You can also toggle the dashboard on or off from the settings menu. It appears in the top-right corner of the chart by default and its position cannot be changed.
🔹Disclaimer:
The Win Rate Dashboard provides historical performance data based on the signals and conditions you’ve enabled. These results are calculated from past bars and are not indicative of future performance or profitability.
ALERTS:
The Manipulation Model indicator includes full alert functionality powered by AnyAlert(), allowing users to receive notifications for all major setups and level breaks in real time.
Users can choose exactly which alerts they want to receive under the “Alerts” section of the settings. Once your preferred alerts are toggled on, you can create a TradingView alert using the AnyAlert() condition. This will automatically trigger alerts for all selected events as they occur on your chart.
Available Alerts:
Long Setup
Short Setup
Bulltrap Setup
Beartrap Setup
Manipulation Candle
Almost Manipulation Candle
Previous Day High/Low Break
Current Day Open Break
Previous Week High/Low Break
Current Week Open Break
Previous Month High/Low Break
Current Month Open Break
Asia Session High/Low Break
London Session High/Low Break
NY AM Session High/Low Break
NYSE Session High/Low Break
London Close Session High/Low Break
NY PM Session High/Low Break
Midnight Open Break
To receive alerts:
Open the alert creation window in TradingView
Select “Manipulation Model ” as the condition
Choose AnyAlert() from the dropdown
Create the alert
IMPORTANT NOTES:
TradingView has limitations when running features on multiple timeframes, which can result in the following restriction:
Computation Error:
The computation of using MTF features is very intensive on TradingView. This can sometimes cause calculation timeouts. When this occurs, simply force the recalculation by modifying one indicator’s settings or by removing the indicator and adding it to your chart again.
UNIQUENESS:
The Manipulation Model is unique because every setup type is fully rule-based and tied to strict structural logic. Traders can control exactly how signals form by selecting which candle types are used, which key levels and sessions are active, and whether entries trigger from Key Levels, Fair Value Gaps, or both. All setups use objective rules for confirmation, wick-to-body ratio, and higher timeframe bias. The indicator also provides full customization for visuals, alerts, and trade parameters like TP and SL multipliers. A built-in Win Rate Dashboard tracks real-time performance for all enabled setup types based on the user’s active sessions and signal filters. Together, these features make it a complete, mechanical implementation of the Funded Brothers Manipulation Model and it works across all asset classes including stocks, crypto, forex, and futures.

Relative Performance Areas [LuxAlgo]The Relative Performance Areas tool enables traders to analyze the relative performance of any asset against a user-selected benchmark directly on the chart, session by session.
The tool features three display modes for rescaled benchmark prices, as well as a statistics panel providing relevant information about overperforming and underperforming streaks.
🔶 USAGE
Usage is straightforward. Each session is highlighted with an area displaying the asset price range. By default, a green background is displayed when the asset outperforms the benchmark for the session. A red background is displayed if the asset underperforms the benchmark.
The benchmark is displayed as a green or red line. An extended price area is displayed when the benchmark exceeds the asset price and is set to SPX by default, but traders can choose any ticker from the settings panel.
Using benchmarks to compare performance is a common practice in trading and investing. Using indexes such as the S&P 500 (SPX) or the NASDAQ 100 (NDX) to measure our portfolio's performance provides a clear indication of whether our returns are above or below the broad market.
As the previous chart shows, if we have a long position in the NASDAQ 100 and buy an ETF like QQQ, we can clearly see how this position performs against BTSUSD and GOLD in each session.
Over the last 15 sessions, the NASDAQ 100 outperformed the BTSUSD in eight sessions and the GOLD in six sessions. Conversely, it underperformed the BTCUSD in seven sessions and the GOLD in nine sessions.
🔹 Display Mode
The display mode options in the Settings panel determine how benchmark performance is calculated. There are three display modes for the benchmark:
Net Returns: Uses the raw net returns of the benchmark from the start of the session.
Rescaled Returns: Uses the benchmark net returns multiplied by the ratio of the benchmark net returns standard deviation to the asset net returns standard deviation.
Standardized Returns: Uses the z-score of the benchmark returns multiplied by the standard deviation of the asset returns.
Comparing net returns between an asset and a benchmark provides traders with a broad view of relative performance and is straightforward.
When traders want a better comparison, they can use rescaled returns. This option scales the benchmark performance using the asset's volatility, providing a fairer comparison.
Standardized returns are the most sophisticated approach. They calculate the z-score of the benchmark returns to determine how many standard deviations they are from the mean. Then, they scale that number using the asset volatility, which is measured by the asset returns standard deviation.
As the chart above shows, different display modes produce different results. All of these methods are useful for making comparisons and accounting for different factors.
🔹 Dashboard
The statistics dashboard is a great addition that allows traders to gain a deep understanding of the relationship between assets and benchmarks.
First, we have raw data on overperforming and underperforming sessions. This shows how many sessions the asset performance at the end of the session was above or below the benchmark.
Next, we have the streaks statistics. We define a streak as two or more consecutive sessions where the asset overperformed or underperformed the benchmark.
Here, we have the number of winning and losing streaks (winning means overperforming and losing means underperforming), the median duration of each streak in sessions, the mode (the number of sessions that occurs most frequently), and the percentages of streaks with durations equal to or greater than three, four, five, and six sessions.
As the image shows, these statistics are useful for traders to better understand the relative behavior of different assets.
🔶 SETTINGS
Benchmark: Benchmark for comparison
Display Mode: Choose how to display the benchmark; Net Returns: Uses the raw net returns of the benchmark. Rescaled Returns: Uses the benchmark net returns multiplied by the ratio of the benchmark and asset standard deviations. Standardized Returns: Uses the benchmark z-score multiplied by the asset standard deviation.
🔹 Dashboard
Dashboard: Enable or disable the dashboard.
Position: Select the location of the dashboard.
Size: Select the dashboard size.
🔹 Style
Overperforming: Enable or disable displaying overperforming sessions and choose a color.
Underperforming: Enable or disable displaying underperforming sessions and choose a color.
Benchmark: Enable or disable displaying the benchmark and choose colors.

Trading Sessions [QuantAlgo]🟢 Overview
The Trading Sessions indicator tracks and displays the four major global trading sessions: Sydney, Tokyo, London, and New York. It provides session-based background highlighting, real-time price change tracking from session open, and a data table with session status. The script works across all markets (forex, equities, commodities, crypto) and helps traders identify when specific geographic markets are active, which directly correlates with changes in liquidity and volatility patterns. Default session times are set to major financial center hours in UTC but are fully adjustable to match your trading methodology.
🟢 Key Features
→ Session Background Color Coding
Each trading session gets a distinct background color on your chart:
1. Sydney Session - Default orange, 22:00-07:00 UTC
2. Tokyo Session - Default red, 00:00-09:00 UTC
3. London Session - Default green, 08:00-16:00 UTC
4. New York Session - Default blue, 13:00-22:00 UTC
When sessions overlap, the color priority is New York > London > Tokyo > Sydney. This means if London and New York are both active, the background shows New York's color. The priority matches typical liquidity and volatility patterns where later sessions generally show higher volume.
→ Color Customization
All session colors are configurable in the Color Settings panel:
1. Click any session color input to open the color picker
2. Select your preferred color for that session
3. Use the "Background Transparency" slider (0-100) to adjust opacity. Lower values = more visible, higher values = more subtle
4. Enable "Color Price Bars" to color candlesticks themselves according to the active session instead of just the background
The Color column in the info table shows a block (█) in each session's assigned color, matching what you see on the chart background.
→ Information Table Breakdown
→ Timeframe Warning
If you're viewing a timeframe of 12 hours or higher, a red warning label appears center-screen. Session boundaries don't render accurately on high timeframes because the time() function in Pine Script can't detect intra-bar session changes when each bar spans multiple sessions. The warning tells you to switch to sub-12H timeframes (e.g., 4H, 1H, 30m, 15m, etc.) for proper session detection. You can disable this warning in Color Settings if needed, but session highlighting can be unreliable on 12H+ charts regardless.
→ Time Range Configuration
Every session's time range is editable in Session Settings:
1. Click the time input field next to each session
2. Enter time as HHMM-HHMM in 24-hour format
3. All times are interpreted as UTC
4. Modify these to account for daylight saving shifts or to define custom session periods based on your backtested optimal trading windows
For example, if your strategy performs best during London/NY overlap specifically, you could set London to 08:00-17:00 and New York to 13:00-22:00 to ensure you see the full overlap highlighted.
→ Weekdays Filter
The "Weekdays Only (Mon-Fri)" toggle controls whether sessions display on weekends:
Enabled: Sessions only show Monday-Friday and hide on Saturday-Sunday. Use this for markets that close on weekends (most equities, forex).
Disabled: Sessions display 24/7 including weekends. Use this for markets that trade continuously (crypto).
→ Table Display Options
The info table has several configuration options in Table Settings:
Visibility: Toggle "Show Info Table" on/off to display or hide the entire table.
Position: Nine position options (Top/Middle/Bottom + Left/Center/Right) let you place the table wherever it doesn't block your price action or other indicators.
Text Size: Four size options (Tiny, Small, Normal, Large) to match your screen resolution and visual preferences.
→ Color Schemes:
Mono: Black background, gray header, white text
Light: White background, light gray header, black text
Blue: Dark blue background, medium blue header, white text
Custom: Manual selection of all five color components (table background, header background, header text, data text, borders)
→ Alert Functionality
The indicator includes ten alert conditions you can access via TradingView's alert system:
Session Opens:
1. Sydney Session Started
2. Tokyo Session Started
3. London Session Started
4. New York Session Started
5. Any Session Started
Session Closes:
6. Sydney Session Ended
7. Tokyo Session Ended
8. London Session Ended
9. New York Session Ended
10. Any Session Ended
These alerts fire when sessions transition based on your configured time ranges, letting you automate monitoring of session changes without watching the chart continuously. Useful for strategies that trade specific session opens/closes or need to adjust position sizing when volatility regime shifts between sessions.

Forex Session TrackerForex Session Tracker - Professional Trading Session Indicator
The Forex Session Tracker is a comprehensive and visually intuitive indicator designed specifically for forex traders who need precise tracking of major global trading sessions. This powerful tool helps traders identify active market sessions, monitor session-specific price ranges, and capitalize on volatility patterns unique to each trading period.
Understanding when major financial centers are active is crucial for forex trading success. This indicator provides real-time visualization of the Tokyo, London, New York, and Sydney trading sessions, allowing traders to align their strategies with peak liquidity periods and avoid low-volatility trading windows.
---
Key Features
📊 Four Major Global Trading Sessions
The indicator tracks all four primary forex trading sessions with precision:
- Tokyo Session (Asian Market) - Captures the Asian trading hours, ideal for JPY, AUD, and NZD pairs
- London Session (European Market) - Monitors the most liquid trading period, perfect for EUR, GBP pairs
- New York Session (American Market) - Tracks US market hours, essential for USD-based currency pairs
- Sydney Session (Pacific Market) - Identifies the opening of the trading week and AUD/NZD activity
Each session is fully customizable with individual color schemes, making it easy to distinguish between different market periods at a glance.
🎯 Session Range Visualization
For each active trading session, the indicator automatically:
- Draws rectangular boxes that highlight the session's time period
- Tracks and displays session HIGH and LOW price levels in real-time
- Creates horizontal lines at session extremes for easy reference
- Positions session labels at the center of each trading period
- Updates dynamically as new highs or lows are formed within the session
This visual approach helps traders quickly identify:
- Session breakout opportunities
- Support and resistance zones formed during specific sessions
- Range-bound vs. trending session behavior
- Key price levels that institutional traders are watching
📱 Live Information Dashboard
A sleek, professional information panel displays:
- Real-time session status - Instantly see which sessions are currently active
- Color-coded indicators - Green dots for active sessions, gray for closed sessions
- Timezone information - Confirms your current timezone settings
- Customizable positioning - Place the dashboard anywhere on your chart (Top Left, Top Right, Bottom Left, Bottom Right)
- Adjustable size - Choose from Tiny, Small, Normal, or Large text sizes for optimal visibility
The dashboard provides at-a-glance awareness of market conditions without cluttering your chart analysis.
⚙️ Extensive Customization Options
Every aspect of the indicator can be tailored to your trading preferences:
Session-Specific Controls:
- Enable/disable individual sessions
- Customize colors for each trading period
- Adjust session times to match your broker's server time
- Toggle background highlighting on/off
- Show/hide session high/low lines independently
General Settings:
- UTC Offset Control - Adjust timezone from UTC-12 to UTC+14
- Exchange Timezone Option - Automatically use your chart's exchange timezone
- Background Transparency - Fine-tune the opacity of session highlighting (0-100%)
- Session Labels - Show or hide session name labels
- Information Panel - Toggle the live status dashboard on/off
Style Settings:
- Turn session backgrounds ON/OFF directly from the Style tab
- Maintain clean charts while keeping all analytical features active
🔔 Built-in Alert System
Stay informed about session openings with customizable alerts:
- Tokyo Session Started
- London Session Started
- New York Session Started
- Sydney Session Started
Set up notifications to never miss important market opening periods, even when you're away from your charts.
---
How to Use This Indicator
For Day Traders:
1. Identify High-Volatility Periods - Focus your trading during London and New York session overlaps for maximum liquidity
2. Monitor Session Breakouts - Watch for price breaks above/below session highs and lows
3. Avoid Low-Volume Periods - Recognize when major sessions are closed to avoid false signals
For Swing Traders:
1. Mark Key Levels - Use session highs and lows as support/resistance zones
2. Track Multi-Session Patterns - Observe how price behaves across different trading sessions
3. Plan Entry/Exit Points - Time your trades around session openings for better execution
For Currency-Specific Traders:
1. JPY Pairs - Focus on Tokyo session movements
2. EUR/GBP Pairs - Monitor London session activity
3. USD Pairs - Track New York session volatility
4. AUD/NZD Pairs - Watch Sydney and Tokyo sessions
---
Technical Specifications
- Pine Script Version: 5
- Overlay Indicator: Yes (displays directly on price chart)
- Maximum Bars Back: 500
- Drawing Objects: Up to 500 lines, boxes, and labels
- Performance: Optimized for real-time data processing
- Compatibility: Works on all timeframes (recommended: 5m to 1H for session tracking)
---
Installation & Setup
1. Add to Chart - Click "Add to Chart" after copying the script to Pine Editor
2. Configure Timezone - Set your UTC offset or enable "Use Exchange Timezone"
3. Customize Colors - Choose your preferred color scheme for each session
4. Adjust Display - Enable/disable features based on your trading style
5. Set Alerts - Create alert notifications for session starts
---
Best Practices
✅ Combine with Price Action - Use session ranges alongside candlestick patterns for confirmation
✅ Watch Session Overlaps - The London-New York overlap (1300-1600 UTC) typically shows highest volatility
✅ Respect Session Highs/Lows - These levels often act as intraday support and resistance
✅ Adjust for Your Broker - Verify session times match your broker's server clock
✅ Use Multiple Timeframes - View sessions on both lower (15m) and higher (1H) timeframes for context
---
Why Choose Forex Session Tracker Pro?
✨ Professional Grade Tool - Built with clean, efficient code following TradingView best practices
✨ Beginner Friendly - Intuitive design with clear visual cues
✨ Highly Customizable - Adapt every feature to match your trading style
✨ Performance Optimized - Lightweight code that won't slow down your charts
✨ Actively Maintained - Regular updates and improvements
✨ No Repainting - All visual elements are fixed once the session completes
---
Support & Updates
This indicator is designed to provide reliable, accurate session tracking for forex traders of all experience levels. Whether you're a scalper looking for high-volatility windows or a position trader marking key institutional levels, the Forex Session Tracker Pro delivers the insights you need to make informed trading decisions.
Happy Trading! 📈
---
Disclaimer
This indicator is a tool for technical analysis and should be used as part of a comprehensive trading strategy. Past performance does not guarantee future results. Always practice proper risk management and never risk more than you can afford to lose. Trading forex carries a high level of risk and may not be suitable for all investors.

ADR Daily Range + Volatility + KZs — SMC/ICT (@PueblaATH)ADR Daily Range + Volatility + KZs — SMC/ICT (@PueblaATH) is a complete intraday context and volatility HUD that plots market opens, killzones, previous period highs/lows, and a dynamic ADR/volatility dashboard. It is built to give SMC/ICT traders an at-a-glance view of when and where price is moving: sessions, overlaps, ranges, and distance to key levels, all on a single clean overlay.
What the Indicator Does
Market Opens (Tokyo, London, New York)
Professional-grade session open lines with:
Individually configurable open times per session and timezone.
Infinite vertical lines or height-limited extensions (custom tick offsets).
Fully styled labels: size, alignment, auto-background, manual background, and vertical offset.
Killzones & Session Overlaps
Precision-timed shaded boxes for:
Tokyo Killzone
London Killzone
New York Killzone
London–New York Overlap
Previous Period Levels (PDH/PWH/PMH & PDL/PWL/PML)
Robust daily/weekly/monthly high/low engine:
Accurate Previous Day / Week / Month Highs & Lows (Europe/Madrid reference).
Line length modes: infinite, N bars, or end-of-day projection.
Per-level colors + labeled markers placed to the right of price with custom horizontal/vertical spacing.
Timeframe & Weekend Filters
Keep charts clean by hiding components based on:
Custom timeframe ranges (hide opens or killzones on HTFs).
Weekend filters for opens, killzones, and ADR/table.
Optional override to display the HUD table across all timeframes.
Session Comparison Table (Top-Right HUD)
A compact, institutional-style session dashboard comparing:
Tokyo, London, New York — current open vs previous session and previous day.
Bullish/Bearish state with color-coded logic (+ optional ▲/▼ arrows).
Optional Δ% change column relative to previous day’s open.
ADR / Volatility Panel (24h Rolling Window)
A powerful real-time volatility module providing:
True 24-hour rolling high–low range.
SMA-based ADR calculation with automatic bar-count safety limits.
ADR% expansion metric with two thresholds + blinking color logic for volatility extremes.
Directional bias vs price 24 hours ago (Bullish/Bearish).
Optional metrics: distance to PDH/PDL (in price units) and absolute H–L / ADR values.
How to Use It
Set each session’s open time and killzone window according to your broker or desired timezone alignment.
Enable or disable session opens and killzones to frame the trading windows you prioritize (e.g., LDN Killzone or NY session expansion).
Activate key previous period levels (PDH/PDL, PWH/PWL, PMH/PML) and tune the line-length mode and label spacing to match your workflow.
Use timeframe & weekend filters to keep higher-timeframe charts clean while maintaining precise intraday visibility on lower timeframes.
Monitor the session comparison table to understand directional behavior relative to previous sessions and previous day opens.
Watch the ADR panel to classify the day as compressed, normal, or expanded—and anticipate potential reversion or continuation.
Originality & Credits Disclaimer
This indicator is an original work by @PueblaATH , created specifically for the tool ADR Daily Range + Volatility + KZs — SMC/ICT (@PueblaATH) and distributed under the MPL 2.0 license.
While the concepts implemented—session opens, killzones, ADR, and previous highs/lows—are public and widely known in the trading community, this script introduces a uniquely integrated framework that combines:
Multi-timezone session scheduling with dynamic TF/weekend filtering.
A modular PDH/PWH/PMH + PDL/PWL/PML engine with versatile projection and labeling controls.
A precise 24-hour volatility model tied to an ADR panel with extension thresholds, blinking alerts, and distance-to-PD metrics.
A multi-session comparative table that unifies Tokyo, London, and New York open data in real time.
This work does not reuse or repackage code from other authors. Any future adaptations from public sources will always include full, transparent credit and documentation.

Sessions High & Low LevelsAutomatically plots high & low levels for multiple sessions. Clear session structure for intraday traders using price action, liquidity concepts, or session-based strategies.
Automatically plots the High & Low, for sessions such as London, New York, and Asia, with full customization for any custom session or timezone. These levels extend forward and adapt in real time, giving you a clear view of session-based structure and liquidity behavior.
Perfect for traders using ICT concepts, session narratives, or intraday market structure. Session ranges often act as key liquidity pools, breakout zones, and directional guides, this tool makes them easy to see at a glance.
Features:
Auto-plots High & Low for NY, London, and Asia sessions (customizable)
Fully customizable session times, colors, labels, and visibility options
Works across any assets


MCM By Inner Racers# MCM By Inner Racers - Multi-Timeframe Key Levels & Session Indicator
## 📊 Overview
**MCM (Multi-Timeframe Chart Mapping)** is a comprehensive trading indicator designed for professional traders who need clear visual representation of critical price levels, session ranges, and time-based market structure. This all-in-one tool eliminates chart clutter while providing essential information for ICT, SMC, and institutional trading methodologies.
---
## ✨ Key Features
### 📅 **Previous Daily Levels**
- **Previous Day High (PDH)** - Acts as key resistance/liquidity zone
- **Previous Day Low (PDL)** - Acts as key support/liquidity zone
- **Previous Day Mid (PDM)** - 50% equilibrium level for mean reversion trades
- **Daily Separators** - Vertical lines marking new trading days
### 📆 **Previous Weekly Levels**
- **Previous Week High (PWH)** - Major weekly resistance for swing trading
- **Previous Week Low (PWL)** - Major weekly support for swing trading
- **Previous Week Mid (PWM)** - Weekly equilibrium for higher timeframe bias
- **Weekly Separators** - Vertical lines marking new trading weeks
### 🌅 **True Day Opens (TDO)**
- Displays opening prices at **midnight NY time** for the past 1-10 days
- Each level labeled as "TDO D-0", "TDO D-1", "TDO D-2", etc.
- Critical for tracking institutional reference points and gap trading
- Respects true midnight opens (not session opens)
### 📍 **Weekly Opens**
- **Monday 00:00 Open** - True weekly open at Monday midnight NY time
- **Sunday 17:00 Open** - Forex market open (Sunday 5 PM NY time)
- Essential for understanding weekly bias and manipulation zones
### 🌏 **Trading Session Ranges**
Dynamic session boxes that track real-time high/low ranges:
- **Asian Session** (Default: 20:00-00:00 NY) -
- **London Session** (Default: 02:00-05:00 NY) -
- **New York Session** (Default: 07:00-16:00 NY) -
All session times are **fully customizable** in 15-minute increments.
---
## 🎯 Who Is This For?
✅ **ICT/SMC Traders** - Key levels for market structure, liquidity, and order flow
✅ **Session Traders** - Identifying killzones and optimal entry zones
✅ **Swing Traders** - Previous day/week levels as support/resistance
✅ **Multi-Timeframe Analysts** - Understanding price relationships across timeframes
✅ **Forex & Indices Traders** - NY time-based analysis for institutional moves
---
## 🎨 Full Customization
Every element is fully customizable:
- ✏️ **Colors** - Match your chart theme perfectly
- 📏 **Line Widths** - 1-5 pixels for visibility
- 🎭 **Line Styles** - Solid, Dashed, or Dotted
- 🏷️ **Labels** - Custom text and 5 size options (Tiny to Huge)
- ⏱️ **Session Times** - Adjust to your timezone or broker
- 📐 **Line Extension** - 20-500 bars forward projection
- 👁️ **Toggle Visibility** - Show/hide any feature independently
---
## 🔧 Technical Highlights
- Uses **request.security()** for accurate higher timeframe data
- Implements **lookahead=barmerge.lookahead_on** for non-repainting levels
- All times calculated in **America/New_York timezone** for consistency
- Efficient line management with proper deletion/recreation
- Maximum 500 lines supported for clean chart performance
- Session detection respects broker time differences
---
## 📖 How To Use
### **For Day Traders:**
1. Enable Daily Levels + True Day Opens for intraday structure
2. Use Session Ranges to identify high-probability trading windows
3. Watch for price reactions at PDH/PDL and TDO levels
### **For Swing Traders:**
1. Enable Weekly Levels for higher timeframe bias
2. Use PWH/PWL as major support/resistance zones
3. Monitor Weekly Opens for institutional reference points
### **For Multi-Timeframe Analysis:**
1. Combine Daily + Weekly levels for confluence zones
2. Use Mid levels (50%) for mean reversion opportunities
3. Align session ranges with higher timeframe structure
---
## ⚙️ Setup Tips
- **Timeframe:** Works on all timeframes (recommended: 1m to 1H for intraday)
- **Chart Type:** Overlay indicator - displays directly on price chart
- **Clean Charts:** Toggle off features you don't need for specific strategies
- **Labels:** Turn off labels for cleaner charts, turn on for reference
- **Line Extension:** Adjust based on your screen size and bar count
---
## 🚀 What Makes This Different?
Unlike basic support/resistance indicators, MCM provides:
- ✅ **True NY midnight opens** (not session opens)
- ✅ **Multiple day opens** tracking (not just previous day)
- ✅ **Dynamic session ranges** (not static boxes)
- ✅ **Both true weekly opens** (Monday 00:00 AND Sunday 17:00)
- ✅ **Fully customizable everything** (colors, styles, labels, times)
- ✅ **Non-repainting levels** using proper lookahead settings
- ✅ **All-in-one solution** (no need for multiple indicators)
---
## 📝 Notes
- All times are in **America/New_York timezone** for consistency with institutional trading
- Previous levels update at the start of each new day/week
- Session ranges are calculated dynamically during active sessions
- Lines extend forward for clear visual reference
- Works with any symbol: Forex, Indices, Crypto, Stocks
---
## 🏷️ Tags
`Multi-Timeframe` `Key Levels` `ICT` `Smart Money Concepts` `Sessions` `Previous Day High/Low` `Previous Week High/Low` `Support Resistance` `Institutional Trading` `Order Flow` `Liquidity` `Market Structure`
---
© Inner_Racers
For questions, suggestions, or feedback, please leave a comment below!
**⭐ If you find this indicator helpful, please give it a boost and share with fellow traders!**

1st 4H Candle [ApexFX]Overview
This indicator identifies the very first 4-hour candle of the trading day and plots its high and low as horizontal lines. These levels are designed to act as key support and resistance for the rest of the 24-hour session.
The lines are calculated using 4-hour data but display on any timeframe, allowing you to see these key daily levels while trading on lower timeframes like the 15-minute or 5-minute chart. The lines extend for the first six 4-hour candles (24 hours) before stopping.
Features
Flexible Timezone: A simple dropdown menu to select your local timezone (e.g., "America/New_York", "Europe/London", "UTC") to ensure the candle is always correctly identified.
Asset Presets: Instantly set the correct start time for major asset classes:
Forex (23:00)
Indices (00:00)
Crypto (21:00)
Fully Custom: A "Custom" option lets you define any hour and minute for the start of your session, giving you full control for other assets like Gold or Oil.
Custom Colors: Change the color of the high and low lines from the settings menu.
How to Use
Add the indicator to your chart.
Open the indicator's "Settings".
In the "Your Timezone" dropdown, select the same timezone you use for your chart (e.g., "America/New_York").
In the "Asset Type Preset" dropdown, choose the asset you are trading (e.g., "Indices").
The indicator will wait for the first 4-hour candle (e.g., the 00:00 candle for Indices) to close, and then it will automatically draw the high and low lines.

Apex FX - 1st 4H CandleApex FX - 1st 4H Candle
Overview
This indicator identifies the very first 4-hour candle of the trading day and plots its high and low as horizontal lines. These levels are designed to act as key support and resistance for the rest of the 24-hour session.
The lines are calculated using 4-hour data but display on any timeframe, allowing you to see these key daily levels while trading on lower timeframes like the 15-minute or 5-minute chart. The lines extend for the first six 4-hour candles (24 hours) before stopping.
Features
Flexible Timezone: A simple dropdown menu to select your local timezone (e.g., "America/New_York", "Europe/London", "UTC") to ensure the candle is always correctly identified.
Asset Presets: Instantly set the correct start time for major asset classes:
Forex (23:00)
Indices (00:00)
Crypto (21:00)
Fully Custom: A "Custom" option lets you define any hour and minute for the start of your session, giving you full control for other assets like Gold or Oil.
Custom Colors: Change the color of the high and low lines from the settings menu.
How to Use
Add the indicator to your chart.
Open the indicator's "Settings".
In the "Your Timezone" dropdown, select the same timezone you use for your chart (e.g., "America/New_York").
In the "Asset Type Preset" dropdown, choose the asset you are trading (e.g., "Indices").
The indicator will wait for the first 4-hour candle (e.g., the 00:00 candle for Indices) to close, and then it will automatically draw the high and low lines.

Enterprise Digital Clock Pro# Enterprise Digital Clock Pro - User Documentation
## Overview
Enterprise Digital Clock Pro is a professional-grade trading indicator designed to provide real-time global market session monitoring directly on your chart. This comprehensive tool helps traders stay synchronized with international market hours, track multiple trading sessions simultaneously, and receive timely alerts for market transitions.
## Purpose & Benefits
### Why Use This Indicator?
- **Global Market Awareness**: Monitor up to 8 major financial markets simultaneously
- **Real-Time Updates**: Live clock with second-by-second precision
- **Session Management**: Know exactly when markets open, close, or enter pre/post-market sessions
- **Time Zone Flexibility**: Automatically handles time zone conversions
- **Professional Visualization**: Enterprise-grade display with multiple theme options
- **Trading Efficiency**: Never miss important market openings or closings with alert notifications
### Who Should Use This Indicator?
- International traders managing positions across multiple markets
- Day traders focusing on specific session overlaps
- Institutional traders requiring professional market monitoring
- Anyone trading across different time zones
- Traders seeking better timing for entry and exit points
## Features
### Core Functionality
1. **Real-Time Digital Clock**: Displays current time in your selected timezone with live updates
2. **Multi-Market Dashboard**: Track 8 major global markets simultaneously
3. **Market Status Indicators**: Visual indicators showing:
- LIVE (Market Open)
- CLOSED (Market Closed)
- PRE (Pre-Market)
- POST (After-Hours)
- WKND (Weekend)
4. **Time Until Change**: Shows remaining time until market opens or closes
5. **Alert System**: 5-minute warnings before market transitions
6. **Professional Themes**: Multiple pre-configured color schemes
## Configuration Guide
### 🎨 Theme Settings
#### Theme Preset
Choose from professionally designed themes:
- **Dark Professional**: Modern dark theme with high contrast (Default)
- **Light Corporate**: Clean, bright theme for well-lit environments
- **Bloomberg Terminal**: Classic financial terminal appearance
- **Trading Floor**: Professional trading desk aesthetic
- **Custom**: Create your own color scheme
### ⏰ Clock Settings
#### Local Timezone
Select your preferred timezone from extensive global options. The indicator supports all major financial centers including:
- Americas (New York, Chicago, Los Angeles, Toronto, São Paulo, etc.)
- Europe (London, Frankfurt, Paris, Madrid, Bucharest, etc.)
- Asia-Pacific (Tokyo, Shanghai, Hong Kong, Singapore, Sydney, etc.)
**Default**: Europe/Bucharest
#### Dashboard Position
Choose where the clock appears on your chart:
- Top Right (Default)
- Top Left
- Bottom Right
- Bottom Left
- Top Center
- Bottom Center
#### Clock Text Size
Adjust the main clock display size:
- Small
- Normal
- Large (Default)
#### Market Text Size
Control the size of market information text:
- Small
- Normal (Default)
- Large
### ✨ Visual Enhancements
#### Enable Gradient Effects
Adds subtle gradient transitions to enhance visual appeal
- **Default**: Enabled
#### Enable Shadow Effects
Creates depth with shadow effects for better readability
- **Default**: Enabled
#### Enable Animated Status Indicators
Provides dynamic visual feedback for market status changes
- **Default**: Enabled
#### Corner Radius
Adjust the roundness of dashboard corners (0-5)
- **Default**: 2
#### Border Style
Select the dashboard border appearance:
- None
- Subtle (Default)
- Professional
- Bold
### 🎨 Custom Colors
*Only active when "Custom" theme is selected*
- **Header Background**: Background color for the clock header
- **Header Text**: Text color for the clock display
- **Body Background**: Background color for market information
- **Body Text**: Text color for market listings
- **Accent Color**: Highlight color for important elements
- **Market Open**: Color indicating open markets
- **Market Closed**: Color indicating closed markets
- **Warning/Pre-Market**: Color for warnings and pre-market sessions
### 🌏 Market Display
Toggle visibility for each market:
- **Show Tokyo Market** (Default: On)
- **Show Shanghai Market** (Default: On)
- **Show Hong Kong Market** (Default: On)
- **Show Sydney Market** (Default: On)
- **Show London Market** (Default: On)
- **Show Frankfurt Market** (Default: On)
- **Show Bucharest Market** (Default: On)
- **Show NY Market** (Default: On)
- **Show Time Until Open/Close** (Default: On)
### Market Session Settings
Configure trading hours for each market in 24-hour format (HHMM-HHMM):
#### 🇯🇵 Tokyo Session
- **Trading Hours**: Set Tokyo Stock Exchange hours
- **Default (Winter)**: 0200-0800 (Bucharest time)
#### 🇨🇳 Shanghai Session
- **Trading Hours**: Set Shanghai Stock Exchange hours
- **Default (Winter)**: 0330-0900 (Bucharest time)
#### 🇭🇰 Hong Kong Session
- **Trading Hours**: Set Hong Kong Stock Exchange hours
- **Default (Winter)**: 0330-1000 (Bucharest time)
#### 🇦🇺 Sydney Session
- **Trading Hours**: Set Australian Securities Exchange hours
- **Default (Winter)**: 0100-0700 (Bucharest time)
#### 🇩🇪 Frankfurt Session
- **Trading Hours**: Set Frankfurt Stock Exchange hours
- **Default**: 0900-1830 (Bucharest time)
#### 🇷🇴 Bucharest Session
- **Trading Hours**: Set Bucharest Stock Exchange hours
- **Default**: 0930-1600 (Bucharest time)
#### 🇬🇧 London Session
- **Trading Hours**: Set London Stock Exchange hours
- **Default**: 1000-1830 (Bucharest time)
#### 🇺🇸 New York Session
- **Trading Hours**: Set NYSE/NASDAQ hours
- **Default**: 1630-2300 (Bucharest time)
## Usage Instructions
### Initial Setup
1. Add the indicator to your chart
2. Select your local timezone in Clock Settings
3. Choose your preferred theme or customize colors
4. Select which markets you want to monitor
5. Adjust display position and text sizes to your preference
6. Configure session times if different from defaults
### Reading the Display
The dashboard shows:
- **Top Row**: Current time in your selected timezone
- **Date Row**: Current date and timezone information
- **Market Rows**: Each selected market displays:
- Country flag
- Market name
- Status indicator (LIVE/CLOSED/PRE/POST/WKND)
- Current local time in that market
- Time until next status change (optional)
- **Footer**: Summary of active markets
### Status Indicators Explained
- **● LIVE**: Market is currently open for trading
- **○ CLOSED**: Market is closed
- **◐ PRE**: Pre-market session (1 hour before open)
- **◑ POST**: After-hours session (1 hour after close)
- **◉ WKND**: Weekend (market closed)
### Alert System
The indicator automatically generates alerts:
- 5-minute warning before market opening
- 5-minute warning before market closing
- Alerts appear once per bar to avoid spam
## Best Practices
### For Day Traders
- Focus on markets relevant to your trading pairs
- Use the "Time Until Change" feature to prepare for volatility
- Set alerts for session overlaps (highest liquidity periods)
### For Swing Traders
- Monitor major market opens for gap opportunities
- Track after-hours activity in relevant markets
- Use weekend status to plan Monday strategies
### For International Traders
- Keep all markets visible for complete global overview
- Adjust session times for daylight saving changes
- Use Custom theme to match your trading platform
## Troubleshooting
### Common Issues & Solutions
**Clock not updating:**
- Ensure your chart is on a live/real-time data feed
- Refresh your chart or switch timeframes
**Incorrect market status:**
- Verify session times are correctly configured
- Check if daylight saving time affects your settings
- Ensure weekend detection is working properly
**Display issues:**
- Try different position settings if overlapping with price action
- Adjust text sizes for better visibility
- Switch themes for better contrast
**Time zone confusion:**
- All session times should be entered in your local timezone
- The indicator automatically handles conversions
- Verify your selected timezone matches your actual location
## Tips for Optimal Use
1. **Session Overlap Trading**: The most volatile and liquid periods occur when major sessions overlap
2. **Pre-Market Preparation**: Use PRE status to prepare for market opens
3. **Weekend Planning**: Review weekly performance when all markets show WKND
4. **Mobile Trading**: Choose larger text sizes for mobile device visibility
5. **Multi-Monitor Setup**: Position dashboard on secondary monitors using corner options
## Performance Notes
- The indicator updates in real-time without requiring chart refreshes
- Minimal resource usage ensures smooth chart performance
- Compatible with all timeframes and chart types
- Works seamlessly with other indicators
## Conclusion
Enterprise Digital Clock Pro transforms your trading chart into a professional command center for global market monitoring. Whether you're trading forex during London-New York overlap, catching the Asian session, or monitoring international equities, this indicator ensures you're always synchronized with global markets.
Stay informed, trade professionally, and never miss important market transitions with Enterprise Digital Clock Pro.

Session Engine — Market Opens, Killzones & Levels — SMC/ICTSession Engine — Market Opens, Killzones & Institutional Levels (Tokyo • London • New York) — SMC/ICT — TradingATH (PueblaATH)
Precision. Sessions. Structure.
Session Engine maps the institutional heartbeat of the day across Tokyo , London , and New York . It draws timezone-accurate Market Open Lines , clean Killzones (incl. London–NY overlap), and a rock-solid, timeframe-safe suite of Previous High/Low Levels (PDH/PDL/PWH/PWL/PMH/PML). On top, a compact Session Comparison Table with an integrated ADR panel shows extension, momentum context, and distance to key levels — at a glance.
Designed for SMC/ICT Traders who demand clarity and reliability, this tool stays stable when you change timeframe, reload, or zoom.
Map the day like a Pro : timezone-true Opens, configurable Killzones, TF-safe PDH/PDL/PWH/PWL/PMH/PML , and a sleek ADR panel beneath a Session Comparison Table . Built for precision SMC/ICT Execution . Zero flicker, full control.
Why Traders Love It
Timezone-Accurate Session Engine — Tokyo, London, New York opens and the London–NY overlap, all resolved to bar-time for precise plotting on any symbol.
Killzones you can trust — choose full-column height or price-bounded height with custom top/bottom tick offsets and label placement.
Bulletproof Previous Levels — PDH, PDL, PWH, PWL, PMH, PML are cached and only refresh on true D/W/M boundaries, eliminating the classic “levels disappear on TF change” problem.
Actionable Context — a compact Session Comparison Table (vs previous session & vs previous day) plus an ADR panel with extension thresholds, distance to PDH/PDL, and current H-L range.
Serious Customization — dotted/solid lines, widths, label size & alignment, auto label backgrounds, block transparency, weekend & timeframe filters, and more.
Performance-Minded — persistent objects are updated in place (not spam-created) to keep your chart crisp and responsive.
What You’ll See
Market Opens — Vertical opens for TOK/LDN/NY with dotted/solid styling, width control, infinite or bounded height, and optional labels.
Killzones + Overlap — Transparent time boxes for session windows (and London–NY overlap). Optional labels, adjustable transparency, and height mode.
Institutional Levels — PDH / PDL / PWH / PWL / PMH / PML with length modes: Infinite, N bars, or End of day. Optional labels with typographic control.
Session Comparison Table — For each session: bias vs previous session and previous day, with optional Δ% column.
ADR Panel — 24h rolling ADR% consumption with two attention thresholds, distance to PDH/PDL (price units), and current H-L range.
How It Works
Session Timing uses explicit IANA timezones (Asia/Tokyo, Europe/London, America/New_York) then anchors to bar_time for pixel-perfect placement.
Killzones are persistent boxes that reset only on daily change, preventing redundant object creation.
Previous Levels are requested once per true period roll (D/W/M) and stored locally; this cache keeps lines stable when switching TFs or reloading charts.
Level Line Length is enforced per-object (Infinite, N bars, End of day) with dynamic x2 handling — no redraw flicker.
ADR uses a timeframe-agnostic 24h rolling window for H/L/range; ADR length is defined in “days” and mapped to bars for any timeframe.
How to Use
Set Session Times (defaults are standard). Adjust the London–NY overlap if your venue differs.
Style your Opens & Killzones — line width, dotted/solid, infinite or bounded height, label font size/align/background.
Choose Level Behavior — Infinite, N bars, or End of day for PD/ PW / PM lines; toggle labels as needed.
Read the Table and ADR — quick bias vs previous session/day, Δ% if you enable it; ADR panel highlights extension with blink thresholds and shows live distance to PDH/PDL.
Inputs
Schedules — Open times + killzone windows for TOK/LDN/NY, and London–NY overlap.
Style — Line width, dotted/solid, label sizes & alignment, auto backgrounds.
Heights — Infinite or tick-bounded line height; full-column or tick-bounded killzones.
Levels — Show/hide PDH/PDL/PWH/PWL/PMH/PML; length mode; label options.
Table & ADR — Font size, arrows, Δ% column, ADR length (days), blink thresholds, show/hide rows.
Filters — Hide visuals on specified timeframe ranges; optional weekend suppression.
Best Practices
Use “End of day” for tidy level lines that still convey right-hand context.
Set ADR thresholds to your instrument’s personality (e.g., 80/120 for FX, 100/150 for crypto).
On exotic trading sessions, verify the IANA timezone alignment and tweak inputs accordingly.
If you stack many tools, consider disabling unused sessions/rows to stay within object limits.
What Makes It Original
A cohesive Session Engine architecture that unifies timezone-true Opens, configurable Killzones/Overlap, and TF-safe previous levels — tailored for SMC/ICT execution.
Robust caching that eliminates TF-switch flicker and preserves dependent calculations (distance to PDH/PDL, ADR%) without gaps.
A unified ADR panel directly under the session table with real-time extension signaling and distance-to-PDH/PDL — pragmatic, trade-ready context you won’t find in generic session scripts.
Deep length & typography controls so visuals are informative and elegant.
Notes & Disclaimer (Originality & Rights)
Original Work Notice — Please read — This script/indicator is an original work created exclusively by TradingATH ( PueblaATH ). It is not derived from, copied from, or authored by any other person or entity. Any resemblance to other scripts is coincidental and limited to the use of public and widely known trading concepts.
Usage & Publication — Redistribution, cloning, or republishing this script (in whole or in part) without the explicit written permission of TradingATH ( PueblaATH ) is prohibited. By using this tool, you acknowledge the author’s exclusive authorship and associated rights.
No Financial Advice — This tool is for educational/informational purposes only and does not constitute financial advice. Markets carry risk; manage your risk and make your own decisions.
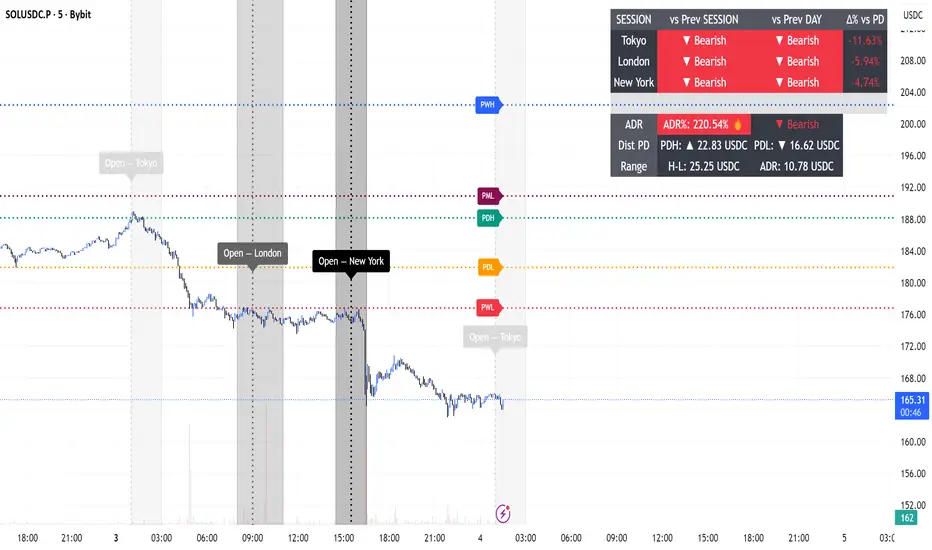
LucciThis indicator identifies trade setups based on session liquidity levels and price structure analysis during New York trading sessions.
Unlike basic support/resistance indicators, this system tracks untested session extremes and monitors their interaction with price. It combines break-and-retest mechanics with bounce detection at key liquidity zones, providing multiple entry methodologies within a single framework.
METHODOLOGY:
The system maps high/low points from each trading session (Asia: 6PM-3AM, London: 3AM-8AM, NY: 8AM-5PM EST) and monitors price behavior around these levels. It identifies two primary setup types: momentum continuation after level breaks and reversal bounces at untested extremes. Visual differentiation shows which levels remain untested (darker) versus swept levels (lighter).
SETUP IDENTIFICATION:
Break & Retest Signals:
- Detects breaks of NY Open range (15-minute candle at 8:00 AM EST)
- Waits minimum bars after break before validating retest
- Triggers when price returns to level within tolerance zone
Bounce Signals:
- Identifies approaches to untested session highs/lows
- Optional wick confirmation for reversal validation
- Signals when price rejects from liquidity zone
CONFIGURATION OPTIONS:
Entry Parameters:
- Min Bars After Break: 1-10 (delay before retest valid)
- Retest Tolerance: 0.1-10 points (precision of level test)
- Bounce Zone: 0.5-5 points (distance from level)
- Wick Confirmation: On/off reversal filter
Risk Management:
- Risk Reward Options: 1:3, 1:5, or Custom (1:1 to 1:10)
- Stop Loss: Configurable in points
- Max Daily Signals: 1-5 trade limiter
- Trading Hours: Customizable active window
Visual Elements:
- Session Levels: Orange (Asian), Yellow (London), Blue (NY)
- Signal Markers: Triangles (B&R), Diamonds (Bounce)
- TP/SL Lines: Automatic calculation and display
- Info Table: Shows bias, untested levels, daily signals
OPTIMAL USAGE:
Trading Windows:
- 9:30-11:00 AM EST: Primary trading window
- First touch of untested levels: Highest probability
- 15-minute timeframe: Recommended for futures
- Volume filter: Optional quality enhancement
Signal Prioritization:
- Untested levels provide stronger reactions
- Multiple confirmations increase probability
- Respect market structure and session context
- Combine with volume for filtering
TECHNICAL SPECIFICATIONS:
- Multi-timeframe: Uses 15-minute data for NY Open
- Session-based: Resets levels at session transitions
- Alert system: Detailed messages with levels
- Position tracking: Manages active trades visually
IMPORTANT NOTES:
This tool maps liquidity zones based on session extremes and price structure. No trading system guarantees profits. Combine with market context and proper risk management. Designed for active intraday trading on liquid instruments.
The indicator provides objective level identification while requiring trader discretion for optimal results.

Killzone Session High/Low Levels [SmartFoxy]Killzone Session High/Low Levels
The Killzone Session High/Low Levels indicator by SmartFoxy provides a complete intraday framework for understanding session-based liquidity, market structure rotation, and breakout behavior across global trading sessions.
It automatically plots the High/Low ranges for each selected session, highlights session killzones, and tracks breakout events with optional alerts.
This tool is designed for traders who rely on session dynamics (Asia, Frankfurt, London, New York) to identify liquidity targets, sweep zones, key ranges, and continuation/reversal opportunities.
________________________________________
How It Works
The indicator detects the active trading sessions for each day and builds structural High/Low ranges for them:
• Asia Session Range (High/Low);
• Frankfurt Session Range;
• London Session Range;
• New York Session Range;
• Optional custom session (NY Open, or any killzone).
For each session, the script can display:
• Session box or column;
• High/Low levels;
• Labels for every range (H/L);
• True session boundaries using user-defined timezone;
• Auto-extended levels up to the latest candle;
• Break levels after a breakout;
• Conditional removal or recoloring after a level is breached.
This gives traders a clean visual map of session liquidity and how price interacts with it throughout the day.
________________________________________
Key Features
1. Multiple Global Sessions •➤ Asia, Frankfurt, London, New York, plus one custom session for advanced killzone mapping.
2. Session High/Low Liquidity Levels •➤ Automatic plotting of every session’s High and Low, with optional labels and price markers.
3. Session Boxes or Columns •➤ Two display modes allow traders to visualize the session either as a filled box or a clear vertical column.
4. Breakout Logic & Temporary Levels .
When price breaks a session High/Low:
• Levels can be extended for a selected number of bars
• Or removed instantly after a breakout
• Or recolored to highlight the sweep event
This enables clean identification of liquidity grabs, breakouts, and continuation setups.
5. Alerts for Session Breakouts .
Set alerts when price breaks:
• Any session level
• Only levels formed on the current day
Perfect for traders who want real-time notifications of sweeps or key structure breaks.
6. Full Customization
You can configure:
• Session times;
• Timezone;
• Colors;
• Labels;
• Line styles and widths;
• Breakout behavior;
• Killzone range handling.
Everything is adjustable to match any trading style.
________________________________________
How to Use
1. Enable the sessions you want to track •➤ Asia, Frankfurt, London, New York, or custom.
2. Choose display mode
Box mode for visual range blocks;
Column mode for clean vertical alignment.
3. Enable High/Low Levels .
These act as liquidity magnets and key rejection zones.
4. Turn on Breakout Levels (optional)
Useful for spotting sweeps and continuation setups.
5. Turn on Alerts if you want notifications when price breaks levels.
6. Use session levels as liquidity reference points .
They work exceptionally well with smart money concepts (SMC), ICT, and intraday structure analysis.
________________________________________
Why This Indicator Is Useful
Shows exactly where liquidity is placed each session;
Highlights market structure transitions as sessions hand over control;
Helps identify stop hunts, sweeps, reversals, and continuation patterns;
Provides real-time alerts for structural breaks;
Organizes the chart and reduces noise;
Works with any intraday timeframe and any market.
This makes it valuable for scalpers, day traders, and SMC/ICT-style analysts.
________________________________________
Summary
Killzone Session High/Low Levels delivers a complete, highly customizable intraday mapping system based on global trading sessions.
It clarifies the session structure, reveals liquidity targets, and empowers traders to make confident trading decisions using clean, objective market data.
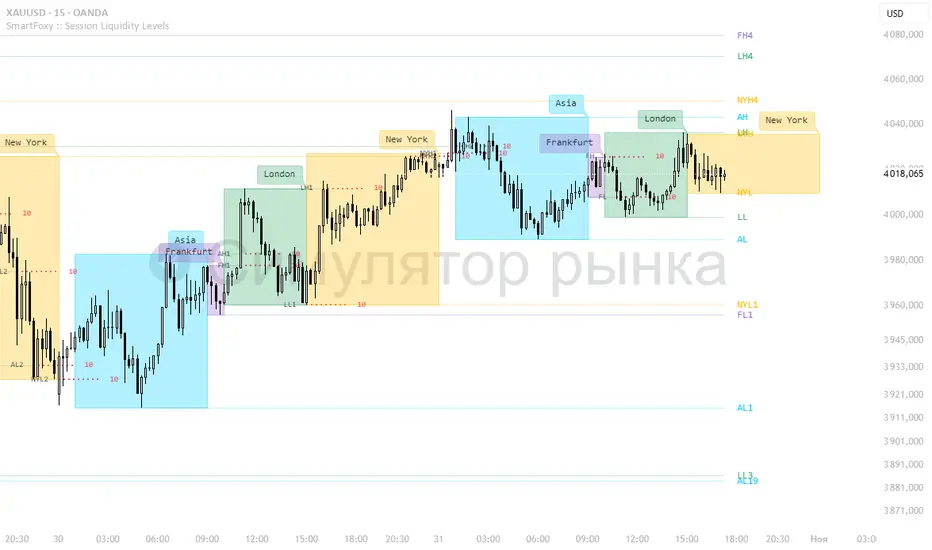
Market SessionsMarket Sessions (Asian, London, NY, Pacific)
Summary
This indicator plots the main global market sessions (Asian, European, American, Pacific) as boxes on your chart, complete with dynamic high/low tracking.
It's an essential tool for intraday traders to track session-based volatility patterns and visualize key support/resistance levels (like the Asian Range) that often define price action for the rest of the day.
Who it’s for
Intraday traders, scalpers, and day traders who need to visualize market hours and session-based ranges. If your strategy depends on the London open, the New York close, or the Asian range, this script will map it out for you.
What it shows
Customizable Session Boxes: Four fully configurable boxes for the Asian, European (London), American (New York), and Pacific (Sydney) sessions.
Session High & Low: The script tracks and boxes the highest high and lowest low of each session, dynamically updating as the session progresses.
Session Labels: Clear labels (e.g., "AS", "EU") mark each session, anchored to the start time.
Key Features
Powerful Timezone Control: This is the core feature.
Use Exchange Timezone (Default): Simply enter session times (e.g., 8:00 for London) relative to the exchange's timezone (e.g., "NASDAQ" or "BINANCE").
Use UTC Offset: Uncheck the box and enter a UTC offset (e.g., +3 or -5). Now, all session times you enter are relative to that specific UTC offset. This gives you full control regardless of the chart you're on.
Fully Customizable: Toggle any session on/off.
Style Control: Change the fill color, border color, transparency, border width, and line style (Solid, Dashed, Dotted) for each session individually.
Smart Labels: Labels stay anchored to the start of the session (no "sliding") and float just above the session high.
Why this helps
Track Volatility & Market Behavior: Visually identify the "personality" of each session. Some sessions might consistently produce powerful pumps or dumps, while others are prone to sideways "chop" or accumulation. This indicator helps you see these repeating patterns.
Find Key Support/Resistance Levels: The High and Low of a session (e.g., the Asian Range) often become critical support and resistance levels for the next session (e.g., London). This script makes it easy to spot these "session-to-session" S/R flips and reactions.
Aid Statistical Analysis: The script provides the core visual data for your statistical research. You can easily track how often the London session breaks the Asian high, or which session is most likely to reverse the trend, helping you build a robust trading plan.
Context is King: Instantly see which market is active, which are overlapping (like the high-volume London-NY overlap), and which have closed.
Quick setup
Go to Timezone Settings.
Decide how you want to enter times:
Easy (Default): Leave Use Exchange Timezone checked. Enter session times based on the chart's native exchange (e.g., for BTC/USDT on Binance, use UTC+0 times).
Manual (Pro): Uncheck Use Exchange Timezone. Enter your UTC Offset (e.g., +2 for Berlin). Now, enter all session times as they appear on the clock in Berlin.
Go to each session tab (Asian, European...) to enable/disable it and set the correct start/end hours and minutes.
Style the colors to match your chart theme.
Disclaimer
For educational/informational purposes only; not financial advice. Trading involves risk—manage it responsibly.

Session Streaks [LuxAlgo]The Session Streaks tool allows traders to identify whether a session is bullish or bearish on the chart. It also shows the current session streak, or the number of consecutive bullish or bearish sessions.
The tool features a dashboard with information about the session streaks of the underlying product on the chart.
🔶 USAGE
Analyzing session streaks is commonly used for market timing by studying the number of consecutive sessions over time and how long they last before the market changes direction.
We identify a bullish session as one in which the closing price is equal to or greater than the opening price, and a bearish session as one in which the closing price is below the opening price.
Each session is labeled according to its bias (bullish or bearish) and the number of consecutive sessions of the same type that conform the current streak.
🔹 Dashboard
The dashboard at the top shows information about the current session.
Under the "Streaks" header, historical information about session streaks is displayed, divided into bullish and bearish categories.
Number: Total number of streaks.
Median: The average duration of those streaks. We chose the median over the mean to avoid misrepresentation due to outliers.
Mode: The most common streak duration.
As the image shows, for this particular market, there are more bullish streaks than bearish ones. Bullish streaks have an average duration that is longer than that of bearish streaks, and both have the same most common streak duration.
If the current session is bullish and the median streak duration for bullish sessions is three, then we could consider scenarios in which the next two sessions are bullish.
🔶 DETAILS
🔹 Streaks On Larger Timeframes
On timeframes lower than or equal to Daily, the tool identifies each consecutive session, but this behavior changes on larger timeframes.
On timeframes larger than daily, the tool identifies the last session of each bar. Let's use the chart in the image as a reference.
At the top of the image, there is a daily chart where each session corresponds to each candle. One candle equals one day.
In the middle, we have a weekly chart where each session is the last session of each week, which is usually Friday for the Nasdaq 100 futures contract. The levels and labels displayed correspond to the last session within each candle, which is the last day of each week.
The levels and labels on the monthly chart correspond to the last session of each month, which is the last day of each month.
🔹 Gradient Style
Traders can choose between two different color gradients for the session background. Each gradient provides different information about price behavior within each session.
Horizontal: Green indicates prices at the top of the session range and red indicates prices at the bottom.
Vertical: Green indicates prices that are equal to or greater than the open price and red indicates prices that are below the open price of the session.
🔶 SETTINGS
🔹 Dashboard
Dashboard: Enable or disable the dashboard.
Position: Select the location of the dashboard.
Size: Select the dashboard size.
🔹 Style
Bullish: Select a color for bullish sessions.
Bearish: Select a color for bearish sessions.
Transparency: Select a transparency level from 100 to 0.
Gradient: Select a horizontal or vertical gradient.
