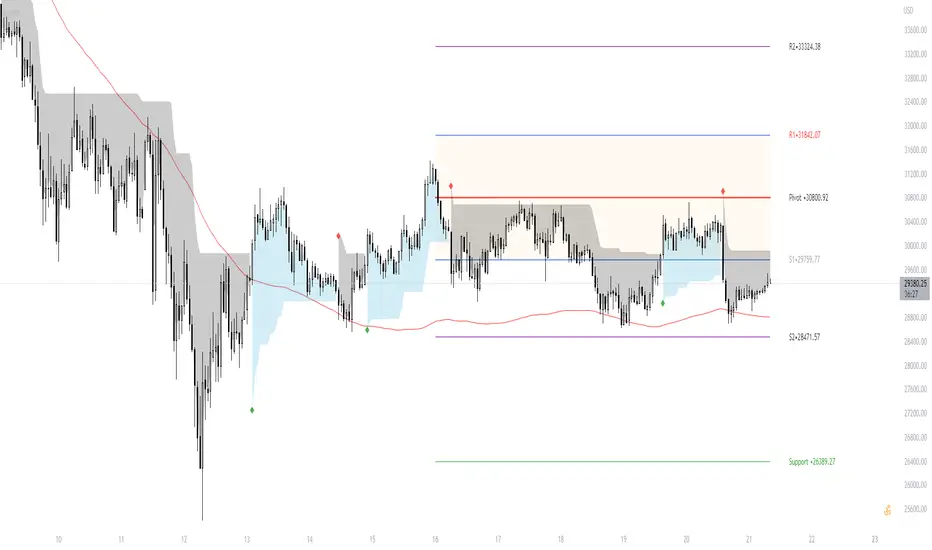
[TT] Daily Levels
These pivots are based on calculations that i have been using for quite some time. I'm sure There is no need to explain on how to use pivots.
Labels are given to understand and you can Msg me here or comment if u need any explanation.
I have given few examples below.. check i t out
XAUUSD
BTCUSD
Nifty
Banknifty
Setup
SAR+RSI+EMAs SignalsNOTE:
Indicator based strategies may expire and begin to work again. There are various ways to check the expiration of these strategies but I suggest equity curve trading (EC trading) as the best one.
Please check every single indicator based strategy to see if it’s still profitable or it has been expired to avoid losses.
Principles:
I personally believe every profitable indicator-based setup need 3 factors. Actually I analyze indicator-based set up in this way!
1- Trend detector: a tool that detect the “trend”.
2- Oscillators (Discount finder): a tool that detects “discounts” in the direction of the trend.
3- Stimulus: A tool that indicates the Initiation of a movement.
There may be profitable strategies that do not use all three, because other factors are strong enough to lead us to profit, but they are rare and sometimes they hide the other forgotten factor in the main two ones.
Elements:
(Since most of traders here, are familiar with these famous indicators I will not take your time to write about their uses and formula)
SAR: As a Trend detector, regarding position of close and SAR
EMA 7 and EMA 21: As trend detectors, regarding position of EMA 7 as fast “moving average” and EMA 21 as slow one. Also we need another confirmation for trend regarding EMA 7 and closing price of the signal candle.
RSI: In this strategy RSI is used both as a discount finder and a stimulus.
For RSI being over/under 50, regarding the trend, a possible discount may have been occurred. Imagine these conditions: close>EMA7, EMA7>EMA21, close>SAR and simultaneously RSI being under 50 is really a sign of powerful uptrend which it’s RSI decreasing might be a sign of corrective move, which will be following a bullish impulsive move.
The other use of RSI is to stimulate a buy signal by “crossing” over 50 or 30 (50 as balanced point of momentum and 30 as a sign of ending an oversold) or stimulate a sell signal by “crossing” under 50 or 70 (50 as balanced point of momentum and 70 as a sign of ending an overbought).
Entry point: you can use one of the followings.
1- Open of the next candle
2- EMA 7
3- Open of the signal candle
(Totally optional but “open of the next candle” is suggested by me.)
SL: Use one of the followings.
1- SAR or some pips (regarding ATR Or your experience of this trading instrument’s fluctuations in this time frame) below the SAR
2- Fixed amount (regarding ATR Or your experience of this trading instrument’s fluctuations in this time frame)
3- Use EMA21 as dynamic SL (if a candle far enough from the initiative candle close over (for sell) below ( for buy)
Again number 1 is suggested by me.
TP: Use one of the followings.
1- Use static levels or zones of support and resistance as TP.
2- Use dynamic levels for instance band of BB or moving averages (Moving the SL is possible).
3- Use fixed R to R
And I believe static zones of support and resistance work better.
Examples:
I indicate a buy signal on the chart!
Using local level as TP worked just good.
Using EMA was better in this case.
And using a riskier level or a fixed R to R is obvious in the chart!
Since in the range markets, this strategy may not work well and at the same time, TP to SL might be too small to be worth the risk, I prefer to use levels to filter range market conditions!
I convert all those circumstances to a simple buy and sell signs on the chart!
EMA21 and SAR are still visible because it is possible that traders use them for their TP and SL.
This is how it look without EMA21 and SAR!
Another screenshot of this strategy!
I also add a check box to filter signals by another trend detector. MATD created by me to help traders detect trend!
As it’s visible, some profitable signals filtered too, but using a longer-term trend detector as an additional one, alongside the double EMAs is very useful for this strategy.
The other box “use high&low instead of close for fast EMA” makes the “EMA7 and close” trend detector an easygoing one!
Almost everything is editable here!
*** I did not invent this strategy, you can find it for free on net ***
I'll change it to a "strategy" instead of an indicator if reader like to!

Holy Pro ScalperWhat is Holy Pro Scalper
This is an advanced Indicator comprising of 21 Fuzzy and Quantitative logics running at once, which takes care of a lot of things for a trader, such as:
1> The current Dominant Trend
2> A Good Entry Point
3> A Way to Recover
4> A point to Stop
5> A Method to Book and Trail Profits
The Logics Includes Likes of :
> DonchainChannels, Supertrend, Bollinger Bands, ATR, Volume, RSI, Stoch etc....
The main Aim of this Indicator is to help traders trade with Rules, and make money if they follow it correctly.
Because One of the most important learnings which I have learnt in my professional trading career is creating a solid trading rule, which takes care of you even if the market is against you!
Another Problem the indicator tries to Solve Is What Securities to Trade for Tomorrow, Traders can plan before day trading and make the strategy towards the instrument in an effective way by just following a few rules, which are Easy to learn!
So Getting into how to Use this Indicator, (U can read the text and see the Video, shared below )
The indicator Comprises of 3 Basic UI Parts
1> Trading Signal
2> Recovery Signal
3> Dominant Trend
Trading Signal
This is represented by a triangle (both buy and sell) in (blue and Orange Colors)
There are two types of trading signals
a> Normal Trading Signal
b> Requiring Confirmation Trading Signal (“c” on top/ below of the Candle where signal Came)
The way to trade them is, one can straight away trade a normal Trading Signal, on the High of the Candle,
A “Requiring Confirmation Trading Signal” must be traded on the high of the Closing candle above the respective Signal candle, that is a trader must wait for the confirmation candle closing above the high of the Requiring Confirmation Trading Signal Candle.
Recovery Signal
A Recovery signal is a sign of recovery the system presents to a trader, when he/she have taken position/ trade as per the trading signal,
A recovery Signal helps to identify the time when its good to look for a recovery at breakeven cost or profit, if the recovery is broken,
There are two types of Recovery in the System,
1> Green Recovery
Which should be considered as a recovery when a Short Trade is active, it shows the intent of the market to change direction, so a trader while in short trade if he sees a green recovery anytime after his order is filled, he may plan to recover, if the recovery candle is broken, so he can wait to recover at breakeven cost or plan for a stop or book profit if market permits
2> Red Recovery
Which should be considered as a recovery when a Long Trade is active, it shows the intent of the market to change direction, so a trader while in long trade if he sees a red recovery anytime after his order is filled, he may plan to recover, if the recovery candle is broken, so he can wait to recover at breakeven cost or plan for a stop or book profit if market permits
Stopping Point and Dominant Trend
So Dominant Trend of the market is represented by a trend Following Line and Area
So if Area on Trend Following Line is Red, market’s dominant trend is Bear
And if Area on Trend Following Line is Green, market’s dominant trend is Bull
If a trader is in Trade the dominant trend line is considered as a stopping point, if market closes below it, in Long position, one can straight away take a Stop and May reverse trade according to thought process
Provision For Alerts
All Trading Signals
Bull Trading Signals
Bear Trading Signals
Green Recovery Signals
Red Recovery Signals
Video Examples
What Instruments and Time Frames It Works
Works on Every Liquid Instrument and Standard Timeframe (1m to 1month)
How Can u Get Access
Only do Private Message to me, use Comment Box for Constructive Comments
What If you Want To learn the Trading Setups of Profitability
Only do Private Message to me, use Comment Box for Constructive Comments

BSKL Short-Term Momentum TradingIndicator to identify the beginning of a Momentum, designed to use for the Malaysian market(I haven't tried it on other markets).
Best to use on 30 minute timeframe. When all criteria is fulfilled, there will be a "^" logo appearing below the candlestick .
Not to be commercialised, feel free to PM me for any improvement or suggestion.
Happy trading.

Stormer Setup [xdecow]This is the setup used by Alexandre Wolwacz (Stormer).
4 Exponential Moving Averages:
* 4 red
* 17 blue
* 34 black
* 80 green
Candle Colors:
* Red: possible top
* Blue: possible bottom
* Yellow: inside bar
Option to use Slow Stochastic as filter for top/bottom.

Rivanews Setup - Riva-Keltner, Média Rock [xdecow]This setup was created by Rivadavila S. Malheiros
There are 2 Keltner Channels with exponential moving averages of 21 (riva) and 89 (rock) and ATR multiplier of 0.618.
When the price is between the bands, it is a sign of consolidation (yellow).
When the price is above the bands, it is an upward trend (green).
When the price is below the bands, it is a downward trend (red).
When the price crosses rock 89 and closes up / down, it may be a sign of a reversal. But it has a high probability of testing rock 89 again.
------------------------------------------------------------------------------------------
PT-BR
Este setup foi criado por Rivadavila S. Malheiros
São 2 Keltner Channels com médias móveis exponenciais de 21 (riva) e 89 (rock) e multiplicador do ATR de 0.618.
Quando o preço está entre as bandas, é sinal de consolidação (amarelo).
Quando o preço está acima das bandas, é uma tendencia de alta (verde).
Quando o preço está abaixo das bandas, é uma tendencia de baixa (vermelho).
Quando o preço cruza a rock 89 e fecha acima/abaixo, pode ser sinal de reversão. Mas tem uma alta probabilidade de testar a rock 89 novamente.
Setup 9.1 by Larry Williams Setup 9.1 by Larry Williams.
The indicator will give text signal and change the color of the signal candle, being based exclusively on the setup 9.1
----------//---------------
PT-BR
Setup 9.1 do Larry Williams.
O indicador irá dar sinal de texto e alterar a cor do candle de sinal, se baseando exclusivamente no setup 9.1

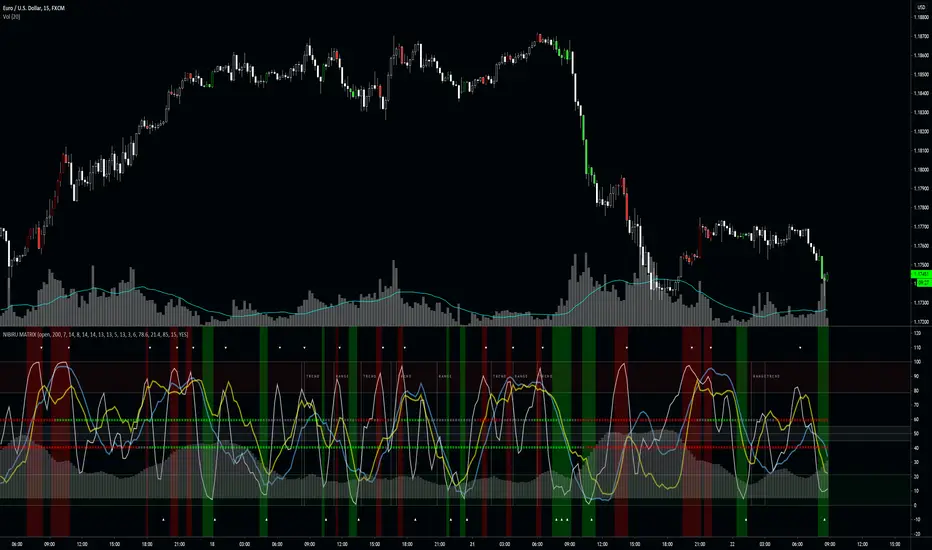
NIBIRU MATRIXThe Nibiru Matrix is an entry timing tool based on oscillators and trends. It's to provide an intuitive way of timing trades when price is at the resistance or on the support.
The Nibiru Matrix provides trade entry hints and information about the current market behavior (trending or ranging). If the market is trending, it also shows the trend strength and direction. It is a secondary indicator meaning it trade should be made on the support or resistance using Nibiru Matrix as a confluence indicator.
What it plots?
Slow, fast and stochastic oscillators
Bar coloring to warn about possible setups
Trending/ranging market indication
Current volatility
2 methods of trend confirmation based on 2 different algorithms
Indicator components:
Trend/range setup - provides information about current possible trade strategy. Following a RANGE indicator, Voodoo Matrix suggests that the safest way to trade will be between the local support and resistance shown by Voodoo Support and Resistance, and following a TREND indicator, it is likely that a trending strategy or taking profit on larger ranges is more profitable.
Fast trend indicator - providing color based information on direction of the short-term trend. This is the most reactive trend indication shown by Voodoo Matrix. This can even be used for counter-main-trend scalping.
Green - uptrend
Red - downtrend
Gray - indecision
Slow trend indicator - providing color based information on direction of the long-term trend. It is based on the behavior of a longer period EMAs.
Green - uptrend
Red - downtrend
Gray - indecision
Volatility histogram - information on current price strength. Best used in confluence with the short term trend indicator.
Fast oscillator - oscillator based on stochastic RSI, modified to provide better information on timing and price movement. It's fast moving which helps time the shorter-term moves.
Slow oscillator - oscillator based on stochastic RSI, modified to provide better information on timing and price movement. It's slow moving and provides useful information about the price direction and strength of the move.
Stochastic oscillator - simple stochastic oscillator. Best used with both Fast and Slow Oscillators to get best timing and price movement strength and direction.
Overbought zone - area of the chart where the modified stochastic oscillator suggests the market is currently overbought.
Oversold zone - area of the chart where the modified stochastic oscillator suggests the market is currently oversold.
Neutral zone - area of the chart where the modified stochastic oscillator suggests the market is currently neutral.
Timing confirmation hints - signaling confirmation of fast oscillator forming a buy/sell setup.
Fast oscillator buy/sell color hint s – bar coloring to bring a focus and attention to possible buy/sell signal forming on the fast oscillator.
Use the link below or PM me to gain access to the indicator.
ROC 21 coins by BiO-618Hey!
I will share with u the Rate Of Change indicator for 21 coins, it's special to use with my last published script, the Correlation formula.
You can find volatility, with a directional sense if it's a positive change, or negative change.
Hope you enjoy it!

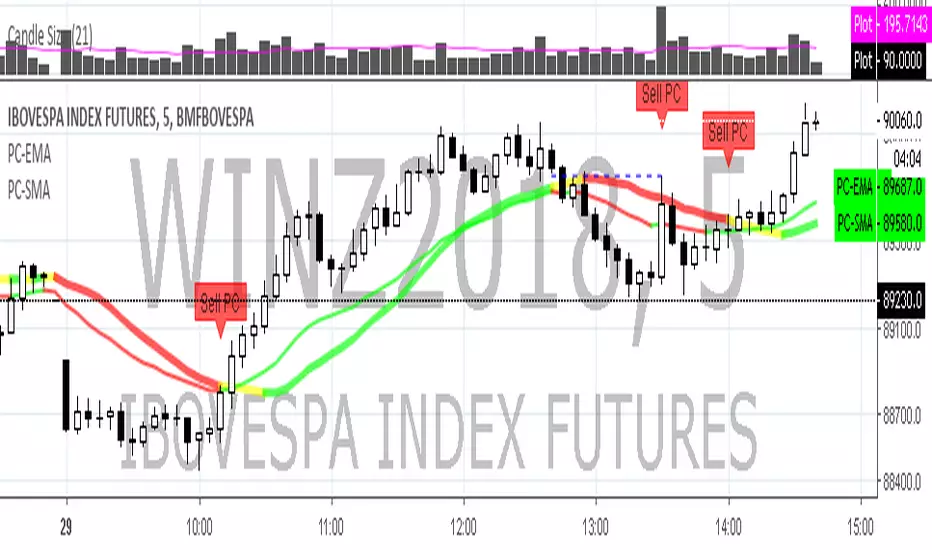
Setup PC - EMA - Alexandre Wolwacz ---US---
Hi trader, it script were based on called Setup PC (Ponto Continuo) 21 period Exponential Moving Average from Professional Trader Alexandre Wolwacz .
Setup PC is ready when the candle touch 21 period EMA, and it EMA dont change the direction. Mark the high or low of the candle, activations starts when the price cross the high to Buy or the low to Sell.
1) Find a stock in uptrend correcting the price to EMA21.
2) Wait the candle touch the EMA.
3) Mark the high of the candle that touch.
4) Buy when the price cross the mark.
5) Stop-loss at the low of the candle that touch EMA.
Remember Volume confirm price/trend.
Enjoy ;)
---PT-BR---
Olá traders, setup universal, criado pelo Alexandre Wolwacz e divulgado pelo Trader Palex.
Bem resumidamente, o Setup do Ponto Contínuo consiste em seguir os ricocheteios numa certa média móvel (a mais clássica é a MME21). Serve em vários tempos gráficos, porém é mais usado no gráfico semanal.
1) Achar ativo em tendência de alta corrigindo para MME21;
2) Aguardar o candle tocar a média;
3) Marcar a máxima e a mínima do candle que tocar;
4) Compra no rompimento da máxima marcada (qualquer negócio acima dessa máxima);
5) Stop na mínima do candle anterior ao que gerou a entrada;
Bons trades.

Setup PC SMA - Alexandre Wolwacz---US---
Hi trader, it script were based on called Setup PC (Ponto Continuo) 21 period Simple Moving Average from Professional Trader Alexandre Wolwacz .
Setup PC is ready when the candle touch 21 period SMA, and it SMA dont change the direction. Mark the high or low of the candle, activations starts when the price cross the high to Buy or the low to Sell.
1) Find a stock in uptrend correcting the price to SMA21.
2) Wait the candle touch the SMA.
3) Mark the high of the candle that touch.
4) Buy when the price cross the mark.
5) Stop-loss at the low of the candle that touch SMa.
Remember Volume confirm price/trend.
Enjoy ;)
---PT-BR---
Olá traders, setup universal, criado pelo Alexandre Wolwacz e divulgado pelo Trader Palex.
Bem resumidamente, o Setup do Ponto Contínuo consiste em seguir os ricocheteios numa certa média móvel (a mais clássica é a MMA21). Serve em vários tempos gráficos, porém é mais usado no gráfico semanal.
1) Achar ativo em tendência de alta corrigindo para MMA21;
2) Aguardar o candle tocar a média;
3) Marcar a máxima e a mínima do candle que tocar;
4) Compra no rompimento da máxima marcada (qualquer negócio acima dessa máxima);
5) Stop na mínima do candle anterior ao que gerou a entrada;
Bons trades.
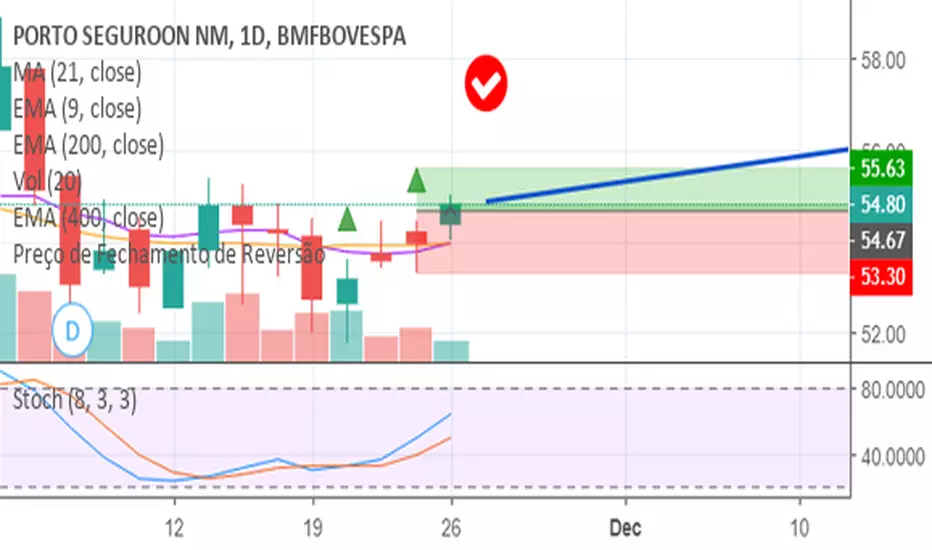
Indicator "Preço de Fechamento de Reversão"
IMPORTANT: Filter entries with Stochastic. Oversold for long and Overbought for short
Marks candles following setup created by Analyst "Stormer" from Brazil.
This setup was not created or modified in any way by me.
Input configuration toggles marking by triangles above or below candles or change of candle color as following:
For Long Entry - Gray Candle or Green Triangle Above Candle:
Lower low than previous low and higher close than previous close
For Short Entry - Black Candle or Red Triangle Below Candle:
Higher high than previous high and lower close than previous close
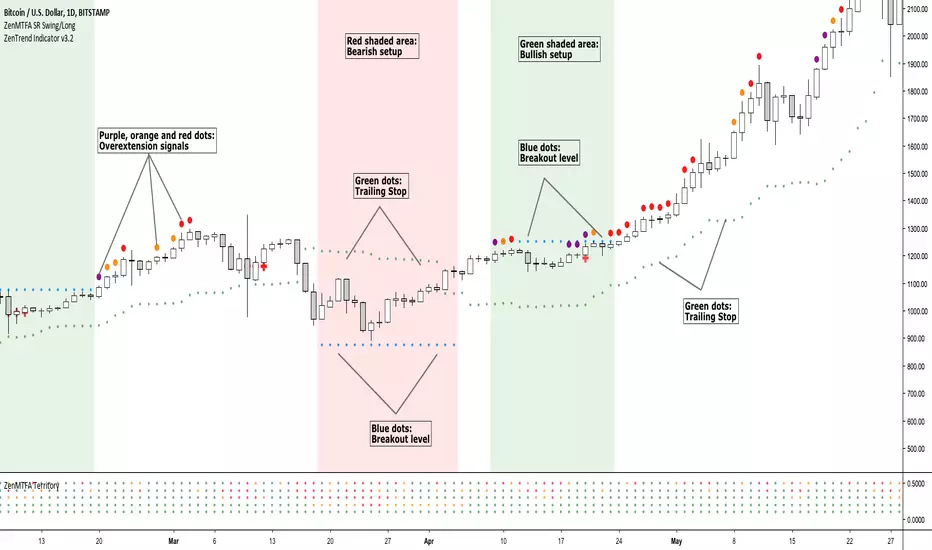
Zentrading Trend Follower_v1.1For more information on how to use and how to subscribe please visit
www.zentrading.co
Our ZenTrend Follower is designed to get you into trends in a safe an risk averse manner. It does not only provide you with buy and sell signals forcing you to either react quickly or miss the trade. Rather, our algorithm detects when a trend setup is active and plots a breakout level where you can enter the trade. This also makes it easy for you to scan many assets quickly: All you need to do is see if the indicator has detected a setup, if not, move on!
To ensure that you capture the trend, the indicator indicator shows you where to place your stop loss as the trend progresses. We will also show you a few other simple ways to exit the trades at higher profit levels in the detailed manual you receive after purchasing the indicator.
The shaded areas on the chart indicate that a trade setup has been detected by the algorithm: Green for bullish setups, red for bearish setups. The blue dots are the breakout level, if the price breaks this level the trade is entered. (as you can see on the chart, they can sometimes move towards the price!) Red crosses are plotted as your trailing stop loss, if price breaks the stop loss the trade is closed.
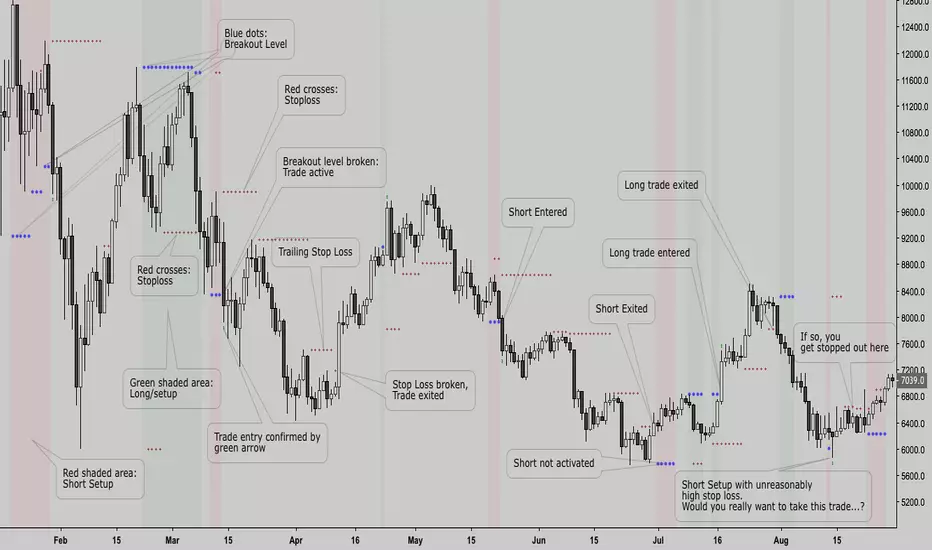
Zentrading Trend FollowerOur Trend following indicator is designed to get you in every trend safely, but perhaps most importantly, keeps you out of bad trades.
It performs well on all assets as it captures trending moves.
It does not only provide you with buy or sell signals you have to react on quickly, rather, it shows you when a trade setup is active. In this way you can anticipate the break of the breakout level to enter the trade. A trailing stop loss is used to exit.
It will work on all timeframes, but as lower timeframes add more noise to the market there will naturally be more losing trades than on higher timeframes. We recommend using it on anywhere from the weekly down to 1 or 2 HR -0.44% timeframes.
It is very simple to use:
The shaded areas on the chart indicate that a trade setup has been detected: Green for bullish setups, red for bearish setups.
The blue dots are plotted as the breakout level, if the price breaks this level the trade is entered. (as you can see on the chart, they can sometimes move towards the price!)
Red crosses are plotted as your trailing stop loss, if price breaks the stop loss the trade is closed.
This is a subscription indicator, please pm for information on how to access.
Happy trading!
Reversal Closing Pricelong = (low < low and close > close )
short = (high > high and close < close )

08-18 EMA Watson [ALERT SETUP][INDICATOR]Hello here is the Alert Setup of my Strategy EMA Watson, I published a backtest version on my profile two days ago.
The big triangles correspond to the buy/sell alerts.
I give access for free, just leave a comment.
More info about the script, such as inputs description, how to configure the script, strategy explanation, alert configuration can be found here : blockchainfiesta.com
--------------------------------------------------------------------------------------------------------------
Commission Work: TradingView development, Reverse Engineering, Pine Script. contact@blockchainfiesta.com.. You can also send me a message in TradingView or Discord
If you have too much crypto and want to help me out:
BTC -2.19% address: 19sVQvCDmVfEACq7BiMnWSMqFPZ8qfSQ2K
ETH address: 0xc8a5d3a63a05db0c2363ea1c08b37a01cce9ebfb

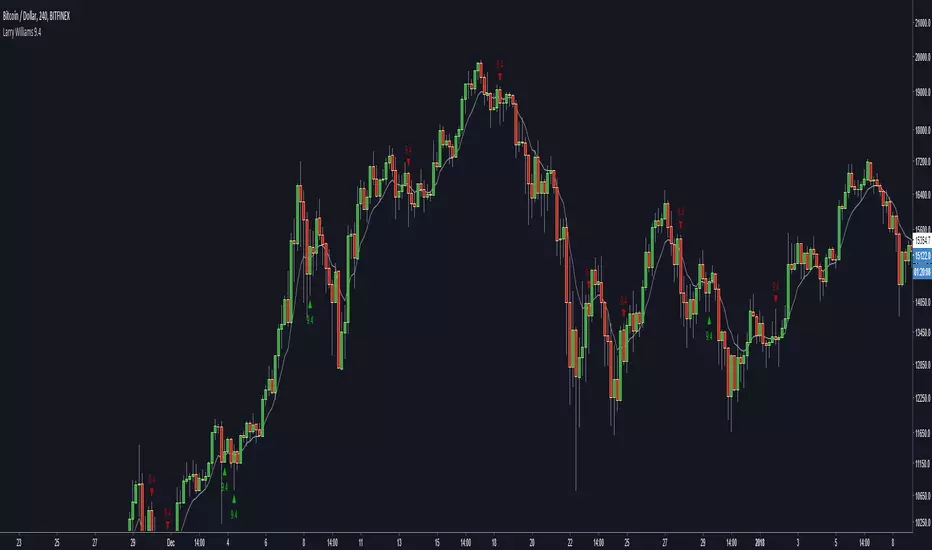
Larry Williams 9.4 [zauoyds]This script was made to find in real time the setup 9.4, made by trader Larry Williams .
This indicator just help to find the entries described by setup 9.4.
You need to know the setup and use this indicador as helper.
The indicator shows when the 9.4 is configured. The trigger to go long is the next candle high is higher than previus candle high. To go short, the low needs to be lower than previus low.
Larry Williams 9.3 [zauoyds]This script was made to find in real time the setup 9.3, made by trader Larry Williams.
This indicator just help to find the entries described by setup 9.3.
You need to know the setup and use this indicador as helper.
The indicator shows when the 9.3 is configured. The trigger to go long is the next candle high is higher than previus candle high. To go short, the low needs to be lower than previus low.

Larry Williams 9.2 [zauoyds]This script was made to find in real time the setup 9.2, made by trader Larry Williams.
This indicator just help to find the entries described by setup 9.2.
You need to know the setup and use this indicador as helper.
The indicator shows when the 9.2 is configured. The trigger to go long is the next candle high is higher than previus candle high. To go short, the low needs to be lower than previus low.

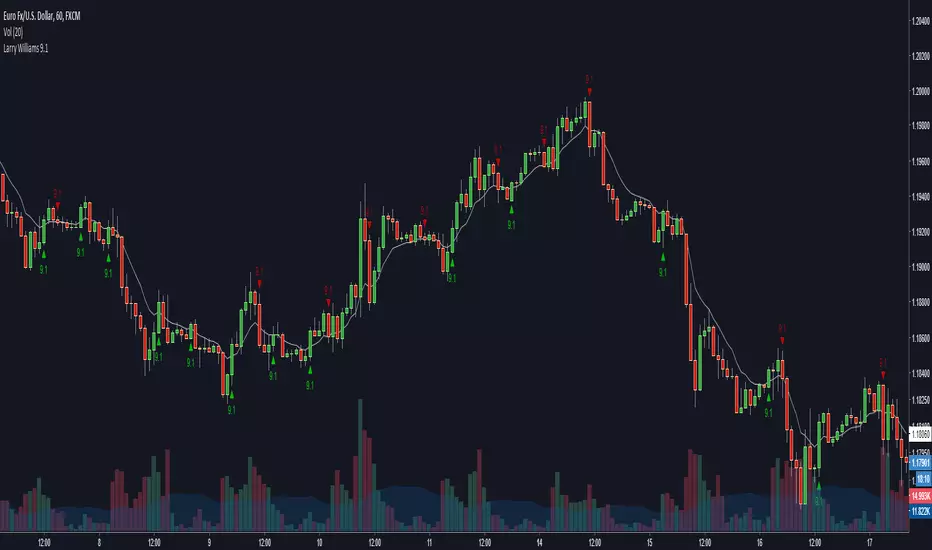
Larry Williams 9.1 [zauoyds]This script was made to find in real time the setup 9.1, made by trader Larry Williams.
This indicator just help to find the entries described by setup 9.1.
You need to know the setup and use this indicador as helper.
The indicator shows when the 9.1 is configured. The trigger to go long is the next candle high is higher than previus candle high. To go short, the low needs to be lower than previus low.
John Carter's Buy/Sell Scalper V2After a couple adjustments, double signals are now being ignore.
Here's how this script works:
Based entirely on a John Carter scalping setup, a candle will be painted purple if the next two closes are in a opposite direction of the past trend.
Green triangles indicates that the reversal is bullish, red triangles indicates that the reversal is bearish. Both are entry/exit points if you want to follow this set up.
Personally, I find this setup to work best in trending days, but it does a great job on choppy days if you use it as a confirmation.
Contra Tendência da SMA(21)Em uma tendência de baixa quando o preço estiver muito afasto (muito abaixo) da SMA (21) efetuar compra na primeira barra verde com take até a SMA (21) ou aparecimento da primeira barra vermelha.
Em uma tendência de alta quando o preço estiver muito afasto (muito acima) da SMA (21) efetuar venda na primeira barra vermelha com take até a SMA (21) ou aparecimento da primeira barra verde.
Obs. Muitas vezes será possível pegar uma reversão de tendência.
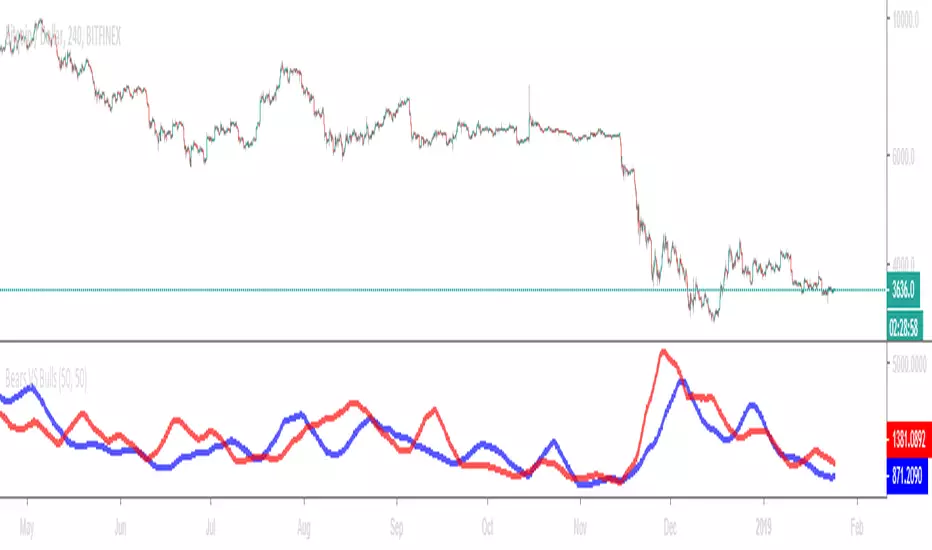
Bears VS BullsThis indicator will work on ANY instrument.
The red line is a moving average of ONLY sellers in the market.
The blue line is a moving average of ONLY buyers in the market.
The period or "length" of the individual moving averages can be adjusted in the indicator settings.
The default, it is set to 50.
Buying and selling trends often provide indications of market moves such as the most recent bottom in Cryptocurrencies.
Feel free to comment and share any indicator concepts or ideas for content you would like to see added to the Technical Indicator Bundle on www.kenzing.com