Pine Script® indicator
Strength

Pine Script® indicator

Pine Script® indicator
Pine Script® indicator

Pine Script® indicator

Pine Script® indicator
Pine Script® indicator

Pine Script® indicator
Pine Script® indicator

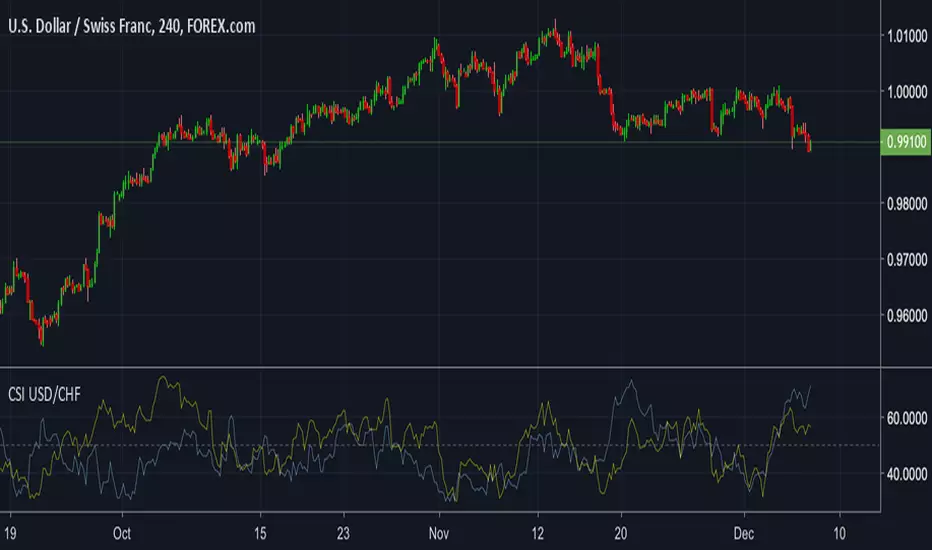
🥢Crypto-Sticks: Absolute Strength Index Osc. by Cryptorthyhms🥢Crypto-Sticks™: Absolute Strength Index Oscillator (Tudor Marcelin)
A new series of indicators brought to you by Cryptorhythms...giving you an alternate look at your trusted favorites! Follow me, there are still 2 dozen Crypto-Sticks indicators planned - all will be released in public library.
🚀Indicator Specific Info
New Crypto-Sticks option is an EMA of the average signal line output. Eventually I will go back and update the previous indicators with this feature as well!
Heiken Ashi candles (default) adds some more clear trend changing points. HA example here:
Volume weighting the HA candles adds a different dimension to the indicator which I have to explore more fully. VW
adds too much noise in my opinion, especially during periods of higher volatility. I left there in case you want to experiment. An example of VW+HA:
💭Please leave me any ideas or feedback you have!
🚫If you use volume weighting you should be on heiken candles.
🚀Crypto-Sticks General Info
🚧This series isnt polished 100%, and I have some more options I will add in the future. But for now, I want to just release them, as I am not sure when I will have the time to put more work into them (many other big projects I am working on).
📊Its basically reinterpretations of all your favorite indicators. I calculate the values a little bit differently than normal, but the end result is creating a candlestick chart (for the indicator!). Then I added the option to plot them as Heiken Ashi candles to smooth out noise and make signaling easier. I recommend using the indicator on this setting.
🔊Lastly I implemented a Volume Weighting system for them all which simply integrates volume into the formulas for these indicators. For the most part this feature is experimental and doesn't provide huge utility (yet - I have other ways I want to try it as well - just no time). Though on some of the indicators it already shows great promise.
👍Enjoying this indicator or find it useful? Please give me a like and follow! There are many more indicators to be released in this series, not to mention I post crypto analysis and other free indicators regularly.
💬Questions? Comments? Want to get access to an entire suite of proven trading indicators? Come visit us on telegram and chat, or just soak up some knowledge. We make timely posts about the market, news, and strategy everyday. Our community isnt open only to subscribers - everyone is welcome to join.
Pine Script® indicator

MTF TRIX - squattterBest setting is 5, with a couple of signal lines set to 7 and 14 for crossovers or bounces.
Pine Script® indicator

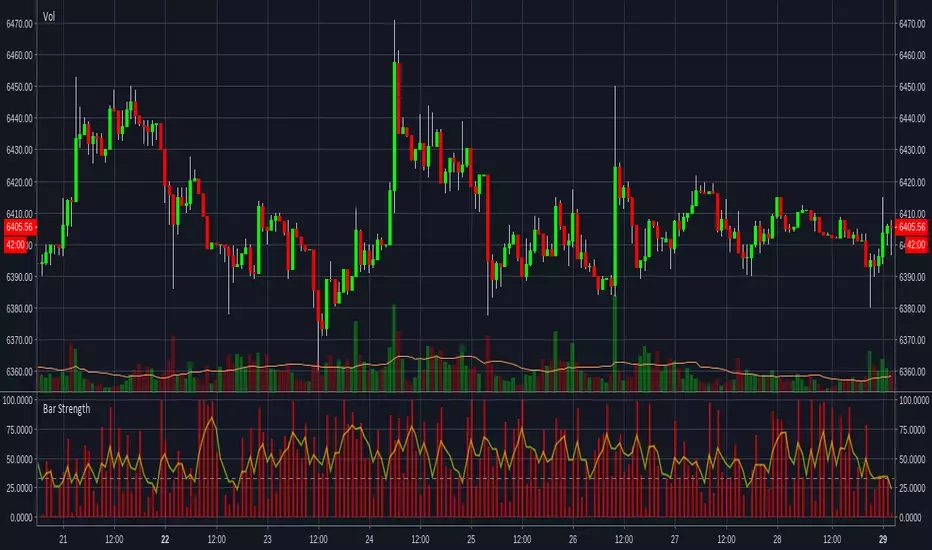
Bar Strength IndicatorIndicator to measure the size of the candle body against the whole candle including the wicks. More information can be found here www.fxstreet.com
This indidactor is based on Marco Mayers article. All credits go to him.
Pine Script® indicator
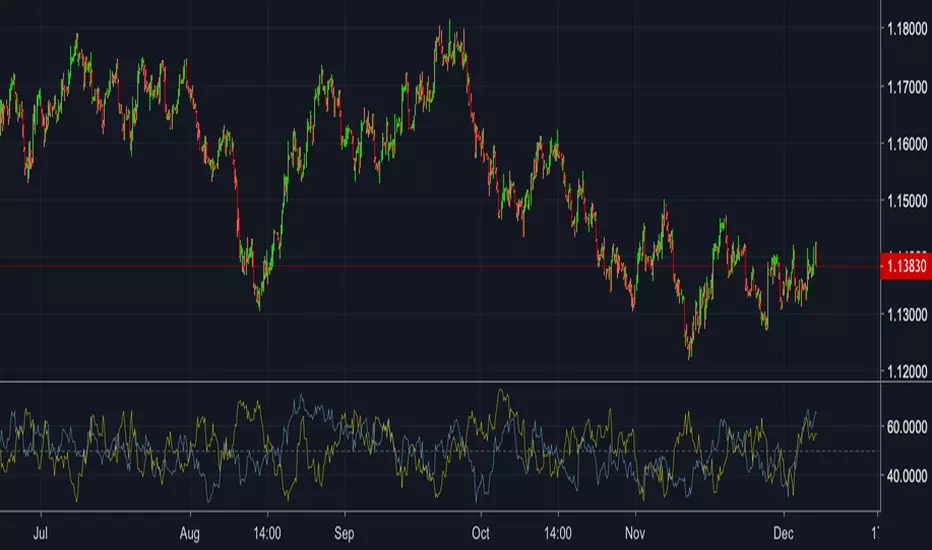
Ultimate Strength Index (USI),Stoch Multi Time Frame(MTF)[cI8DH]Ultimate Strength Index ( USI ) adds stochastic, multi time frame, signal line, histogram, and bar coloring options to RSI and Absolute Strength Index ( ASI ) . It can also turn into an indicator similar to Awesome Oscillator/MACD line. This indicator can be used for analyzing momentum and trendiness/choppiness, as well as identifying swings (stoch). The fix applied in True RSI is also applied here. Chart below shows example multi-TF setup with bar coloring.
For analyzing volume, I made a similar indicator based on money flow and accumulation/distribution, which you can find in the link below.
Aggregation Method
aggregation method = MA Percent => True RSI: momentum and divergence, failure swings
aggregation method = MA => Absolute Strength Index: accurate momentum and divergence
aggregation method = Cumulative => Awesome Oscillator alternative : momentum and divergence, twin peaks, ... (set the smoothing to 5 and signal length to 29ish)
Smoothing, signal line and histogram to detect trend and choppiness
You can apply additional smoothing to USI . Also, you can add a signal line and histogram (histogram is the difference between main line and signal line). To do so, set the signal length to a number greater than one. Signal line can help you detect changes in trend similar to the signal line on MACD. If signal line criss-crosses USI , it shows market is choppy. The worst case is when this criss-crossing coincides with USI flattening near neutral line and histogram height is relatively short; that means market is ded (until it is not; expansion following a contraction period is a common phenomena)! (Bear in mind that histogram will be hidden in stoch mode, and main and signal lines will be hidden in cumulative mode)
Stochastic
To enable stoch, change the stoch length to a number greater than 1 (default stoch length for the built-in RSI stoch is 14). This length should be calibrated depending on TF and asset. If done correctly, it can be a powerful tool for identifying swings. Stoch can be combined with any aggregation method. I recommend using stoch with MA aggregation (i.e. ASI ). For conventional uses of stochastic, please read www.tradingview.com(STOCH) and www.tradingview.com(STOCH_RSI).
Experimental Bar coloring Feature
There is an option to color bars depending on USI's position relative to the signal line. If both TFs are used in coloring and they are in disagreement, the TF with greater histogram height wins. There are two shades of green and red. The darker shade means both TFs agree. If you use the signal line, bar coloring can help with calibrating the indicator (play with parameters until you see a good looking chart i.e. a lot of green candles followed by a lot of red candles in a row). Please note that bar colors might change until candle(s) close(s). The bar coloring rules will most likely change in the future.
Notes
- Smooth MA length N = EMA length 2*N-1
- With correct settings, you can also create an alternative to normalized MACD line in the cumulative mode.
True RSI
Absolute Strength Index
Please give a like, and share the interesting configurations you find in the comments.
Pine Script® indicator

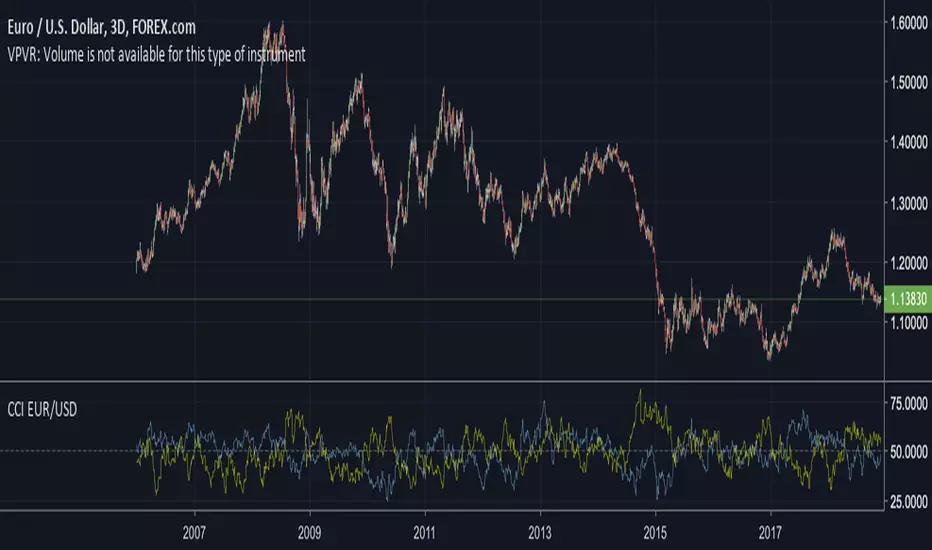
Stoch Money Flow (ADMF) & Absolute Strength Index (ASI) [cI8DH]This indicator can apply my previous indicator, Historical and Standard Stochastic, to Money Flow (ADMF) or Absolute Strength Index (ASI) or both at the same time. It can also display those two indicators in regular mode as well as showing visual cues when the indicators make new ATH or ATL.
ASI is basically a new name I am giving to my Gain/Loss Moving Average indicator. If you normalize ASI with the moving average of all the changes in price, it becomes identical to RSI. So ASI is basically non-normalized RSI, that is why it should be a more accurate representation of price momentum.
ADMF is an accumulation/distribution and money flow momentum indicator. Both ASI and ADMF are not range-bound so it is not easy to compare them against each other. When stochastic equation is applied to them, they both become range-bound and comparable. The gaps between the two indicator can reveal valuable information about market dynamics. The chart below shows some examples (note the settings).
For conventional usages of stochastic, please read www.tradingview.com(STOCH) and www.tradingview.com(STOCH_RSI). I recommend you to find the optimal length by playing with the stoch length in the indicator settings. If this parameter is calibrated properly, this indicator can be a powerful tool for identifying market cycle.
You can get these features ( ATH , ATL detection and historical stochastic) for any other indicator using the script below:
Pine Script® indicator

RSI Divergence Smoothed with Signal Line and Power ZonesThis Indicator plots Regular and Hidden Divergences lines for an RSI smoothed by an EMA and for its Signal Line
The RSI can be set to change colour with direction or can be set as single colour
Colour Changing RSI helps when trading Multiple Timeframes as you can look for confluence in the direction of RSI
The divergence script is thanks to @RicardoSantos, I've just adjusted it to suite my indicator
Remember that divergences work best when traded with the trend or very late in a trend when going against the trend
I have also added a Colour Changing Signal Line & Hima Reddy's Power Zones so now you can also
Take full advantage of trading; signal line crosses, 50 crosses and Power Zone RSI support and resistance
Pine Script® indicator

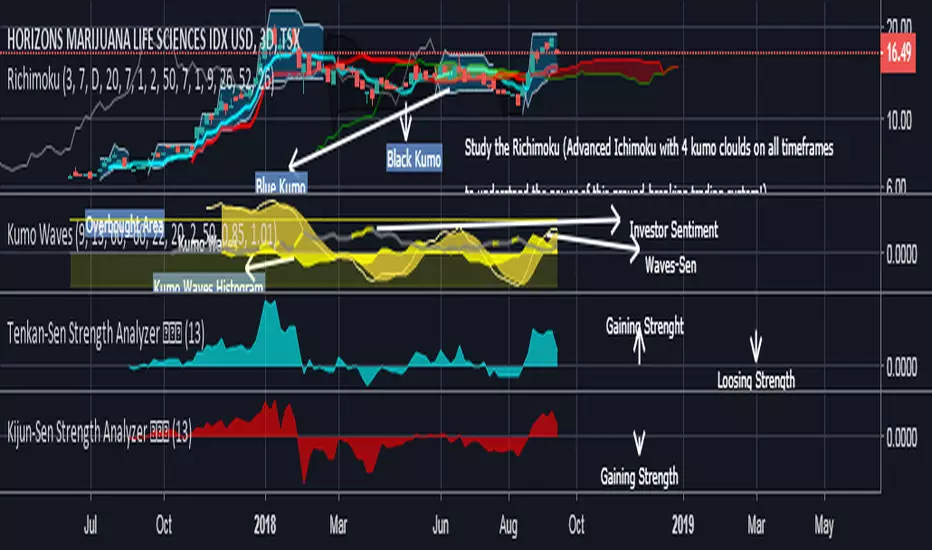
Kijun-Sen Strength Analyzer 基準線The Kijun-Sen Strength Analyzer 基準線 is included in the Richimoku Traiding System.
The Kijun-Sen Strength Analyzer (Indentify divergences. Know First. Act Faster. A must-have for every Ichimoku trader)
*As some indicators you may come across are using the repainting mode (which consists in correcting the false signal back in time).
You'll never see such thing in the Richimoku Trading System. What's on the charts is displayed in real time, no cheating...
Feel free to test the Kijun-Sen Strength Analyzer 基準線 or the Richimoku Trading System For 12 hours! Study the chart history on all timeframes. Study all details incl. divergences etc.
FAQ.
How to access the Kijun-Sen Strength Analyzer 基準線 in tradingview?
To access your indicator simply click on “Indicators” at the top of your Chart, and click on “Invite-Only Scripts”. Click on the indicator to activate it. That’s it!
Will the the Kijun-Sen Strength Analyzer 基準線 work for Stock and Index trading?
Sure! It works on all Forex, Stocks, Indexes, Metals and Crypto's!
Does this indicator work with a free TradingView Account?
Yes you can use the Kijun-Sen Strength Analyzer 基準線 or the Richimoku Indicator Trading System with a free TradingView account.
Does the indiators work on all timeframes?
Yes, the indicators can be used on all time frames!
Pine Script® indicator
Relative Strength Index Multi Time frame RSII am always checking RSI on 1hr, 4Hr and Day RSI.
Having to switch is annoying so wrote this little script to show RSI on upto 5 time frames.
The green bold line is the current time frame, and you can change the other 4 to what you prefer.
If one time frame is over sold or overbought you can change the back to indicated a buy or sell etc.
Anyway thought I would share it.
If you like it, please click the like button.
Pine Script® indicator

Strength Candles With GapCode written by Krishna Khanna on 20/11/2017 includes the following components for NimblrTA
1) Logic for detection of strength candles, only displayed candles are of strength (BH>50%CH)
2) Wicks are not considered
3) Any Gaps are indicated with a arrow, can detect gapup and gapdown
This indicator is apt for small screen devices
Pine Script® indicator

FofT - 1h, 4h, and Daily RSI in any time intervalView multiple-timeframe RSIs in a single interval. All RSI lines stay the same no matter your preference to trade in 15m, 1h, 3h…. etc.
Default RSI length is 7 (can be changed in the format settings)
All RSIs are smoothed out in default (can be changed in the format settings)
Line colors
5m RSI - white (disabled in default)
15m RSI - Lime (disabled in default)
1h RSI - Yellow
4h RSI - Red
D RSI - Blue
Overbought and Oversold threshold colors
>70 (grey) - overbought
>80 (orange) - highly overbought
>90 (pink) - extremely overbought
=50 (black dotted lines) - equilibrium
<30 (grey) - oversold
<20 (orange) - highly oversold
<10 (pink) - extremely oversold
How to add to chart
* Click on "Add to Favorite scripts" in the bottom right
* While in chart view click on "/" button on your keyboard or click on the Indicators button on the top tool bar
* Go to Favorites Tab and click on this indicator
Other interval RSIs will be added based on request. Feel free to leave any questions or requests in the comment section below.
If you find this script useful, please like and share.
Pine Script® indicator

Volume/Rsi Overbought/oversoldI present you my last indicator. A volume indicator that indicates overbought and oversold based on the rsi, I chose the rsi because the most used surment, this indicator allows you to identify the overbought and oversold areas of the rsi with the colors blue (oversold) and orange (overbought ) on the volume indicator! Hoping that you are useful
Pine Script® indicator
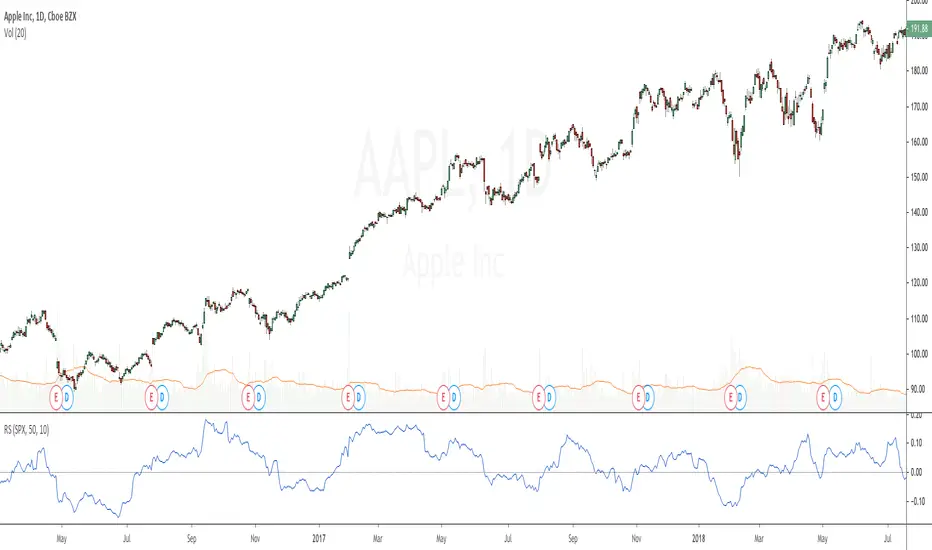
Relative StrengthRelative strength is a ratio between two assets, most often a stock and a market average (index). This implementation uses the method described here and the second method described here to calculate its value: "To calculate the relative strength of a particular stock, divide the percentage change over some time period by the percentage change of a particular index over the same time period". This indicator oscillates around zero. If the value is greater than zero, the investment has been relatively strong during the selected period; if the value is less than zero, the investment has been relatively weak. The period and the comparative symbol can be set in the settings for the indicator (the defaults are 50 and SPX), there you can also find an option to turn on a moving average.
Pine Script® indicator
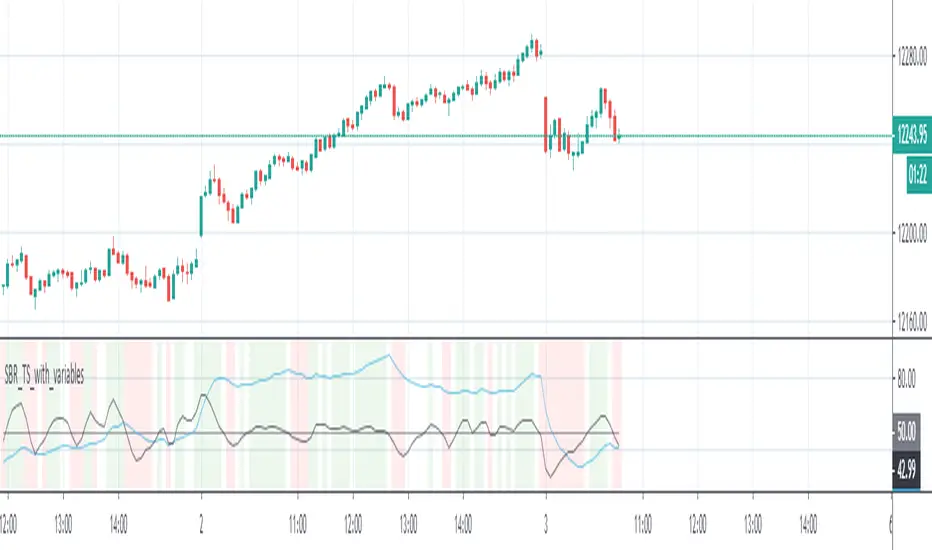
SBR_Trade_signalThis indicator is based on true strength indicator with wave trend oscillator.
Disclaimer: All the signals it is giving is based on the market movements only. I am not responsible for your PNL if you follow this indicator.
*Caution: Beta version
Pine Script® indicator
Trend Strength BuddyOne of the indicators in the "Trend Buddy" suite.
This indicator plots the oscillator at the bottom of the chart and colors the candles according to trend strength.
The oscillator can be used to identify divergence in several ways
If price is moving one way and the oscillator another, it can mean that the trend is gearing up to change. Example: above, in Bancor ( BNTBTC )
If price is making higher highs/lower lows and the oscillator is not, it can signal that the current trend is weakening. Example: see vertical lines
Legend of candle colors
strong uptrend - green
weakening uptrend - olive
weakening downtrend - maroon
strong downtrend - red
Note that the healthiest uptrends will show an oscillator value greater than zero (vice versa for downtrends). Using deflections of the zero-line can help filter our false trend changes.
This Suite of indicators is actively being developed and researched. Please contact me directly for more information.
Pine Script® indicator
