Intelligent Moving📘 Intelligent Moving – Adaptive Neural Trend Engine
Intelligent Moving is an invite-only, closed-source indicator that dynamically adjusts itself to evolving market conditions using a built-in neural optimizer. It combines a custom adaptive Moving Average, ATR-based deviation bands, and a fully internal virtual trade simulator to deliver smart trend signals and automatic parameter tuning — all without repainting or manual intervention.
This script is built entirely from original code and does not use any open-source components or built-in TradingView indicators.
🧠 Core Logic and Visual Structure
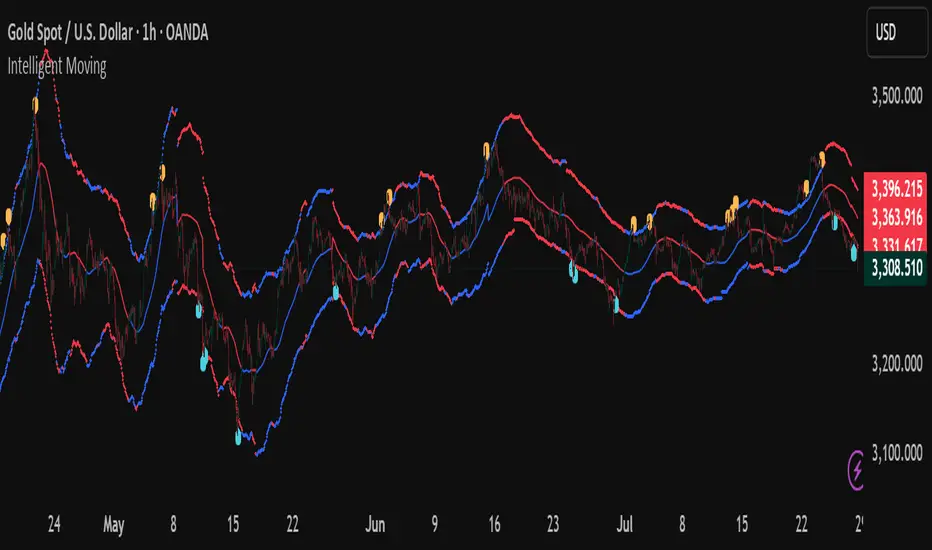
The indicator plots:
- A central moving average (optimized dynamically),
- Upper and lower deviation bands based on ATR × adaptive coefficients,
- Buy (aqua) and Sell (orange) arrows on reversion signals,
- Color-coded trend zones based on price vs. moving average.
All three bands change color in real time depending on the price’s position relative to the MA, clearly showing uptrends (e.g. blue) and downtrends (e.g. red).
📈 Signal Logic: Reversion from Extremes
- Buy Signal: After price closes below the lower deviation band, it then closes back above it.
- Sell Signal: After price closes above the upper deviation band, it then closes back below it.
These signals are not based on crossovers, oscillators, or lagging logic — they are pure structure-based reversion entries, designed to detect exhaustion and reversal zones.
🤖 Built-In Neural Optimizer (Perceptron Engine)
At the heart of Intelligent Moving lies a self-training engine that uses simulated (virtual) positions to test multiple configurations and pick the best one. Here’s how it works:
🔄 Virtual Trade Simulation
At regular intervals (user-defined), the script:
- Simulates virtual buy/sell positions based on its signal logic.
- Applies virtual Stop-Loss (just beyond the signal zone) and virtual Take-Profit (when price crosses back over the MA).
- Calculates simulated profit for each combination of:
- - MA periods,
- - Upper/lower ATR multipliers.
🧠 Neural Training Process
- A perceptron-like engine evaluates the simulated results.
- It selects the best-performing configuration and applies it to live plotting.
- You can choose whether optimization uses a base value or the last best result from the previous training pass.
This process runs forward-only and never overwrites history or uses future data. It's completely transparent and non-repainting.
⚙️ Customization and Parameters
Users can control:
- MA period range, step, and training type (base vs last best)
- Deviation multiplier ranges and step
- Training depth (number of bars in history)
- Training interval (how often to retrain)
- Spread simulation, alert options, and all visual settings
💡 What Makes It Unique
- ✅ Self-optimization with virtual trades and perceptron logic
- ✅ Adaptive deviation bands based on ATR (not standard deviation)
- ✅ No built-in indicators, no repaints, no curve-fitting
- ✅ Clear trend zones and reversal signals
- ✅ Optimized for live use and consistent behavior across assets
Unlike typical moving average tools, Intelligent Moving thinks, adapts, and reacts — turning a standard concept into a living, learning trend engine.
📊 Use Cases
- Trend detection with adaptive coloring
- Reversion trading from volatility extremes
- Dynamic strategy building with minimal manual input
- Alerts for automated or discretionary traders
🔒 Invite-Only Notice
This script is invite-only and closed-source.
The optimization logic, trade simulation system, and perceptron engine were developed from scratch, specifically for this indicator. No built-in functions (e.g. MA, BB, RSI) or public scripts were used or copied.
All decisions and calculations are based on current and past price only — no repainting, retrofitting, or future leakage.
⚠️ Disclaimer
This indicator is for educational and analytical use only.
It does not predict future prices or guarantee profits. Always use appropriate risk management and test thoroughly before live trading.
Pine Script® indicator