Session Open Range, Breakout & Trap Framework - TrendPredator OBSession Open Range, Breakout & Trap Framework — TrendPredator Open Box
Stacey Burke’s trading approach combines concepts from George Douglas Taylor, Tony Crabel, Steve Mauro, and Robert Schabacker. His framework focuses on reading price behaviour across daily templates and identifying how markets move through recurring cycles of expansion, contraction, and reversal. While effective, much of this analysis requires real-time interpretation of session-based behaviour, which can be demanding for traders working on lower intraday timeframes.
The TrendPredator indicators formalize parts of this methodology by introducing mechanical rules for multi-timeframe bias tracking and session structure analysis. They aim to present the key elements of the system—bias, breakouts, fakeouts, and range behaviour—in a consistent and objective way that reduces discretionary interpretation.
The Open Box indicator focuses specifically on the opening behaviour of major trading sessions. It builds on principles found in classical Open Range Breakout (ORB) techniques described by Tony Crabel, where a defined time window around the session open forms a structural reference range. Price behaviour relative to this range—breaking out, failing back inside, or expanding—can highlight developing session bias, potential trap formation, and directional conviction.
This indicator applies these concepts throughout the major equity sessions. It automatically maps the session’s initial range (“Open Box”) and tracks how price interacts with it as liquidity and volatility increase. It also incorporates related structural references such as:
* the first-hour high and low of the futures session
* the exact session open level
* an anchored VWAP starting at the session open
* automated expansion levels projected from the Open Box
In combination, these components provide a unified view of early session activity, including breakout attempts, fakeouts, VWAP reactions, and liquidity targeting. The Open Box offers a structured lens for observing how price transitions through the major sessions (Asia → London → New York) and how these behaviours relate to higher-timeframe bias defined in the broader TrendPredator framework.
Core Features
Open Box (Session Structure)
The indicator defines an initial session range beginning at the selected session open. This “Open Box” represents a fixed time window—commonly the first 30 minutes, or any user-defined duration—that serves as a structural reference for analysing early session behaviour.
The range highlights whether price remains inside the box, breaks out, or rejects the boundaries, providing a consistent foundation for interpreting early directional tendencies and recognising breakout, continuation, or fakeout characteristics.
How it works:
* At the session open, the indicator calculates the high and low over the specified time window.
* This range is plotted as the initial structure of the session.
* Price behaviour at the boundaries can illustrate emerging bias or potential trap formation.
* An optional secondary range (e.g., 15-minute high/low) can be enabled to capture early volatility with additional precision.
Inputs / Options:
* Session specifications (Tokyo, London, New York)
* Open Box start and end times (e.g., equity open + first 30 minutes, or any custom length)
* Open Box colour and label settings
* Formatting options for Open Box high and low lines
* Optional secondary range per session (e.g., 15-minute high/low)
* Forward extension of Open Box high/low lines
* Number of historic Open Boxes to display
Session VWAPs
The indicator plots VWAPs for each major trading session—Asia, London, and New York—anchored to their respective session opens. These session-specific VWAPs assist in tracking how value develops through the day and how price interacts with session-based volume distributions.
How it works:
* At each session open, a VWAP is anchored to the open price.
* The VWAP updates throughout the session as new volume and price data arrive.
* Deviations above or below the VWAP may indicate balance, imbalance, or directional control.
* Viewed together, session VWAPs help identify transitions in value across sessions.
Inputs / Options:
* Enable or disable VWAP per session
* Adjustable anchor and end times (optionally to end of day)
* Line styling and label settings
* Number of historic VWAPs to draw
First Hour High/Low Extensions
The indicator marks the high and low formed during the first hour of each session. These reference points often function as early control levels and provide context for assessing whether the session is establishing bias, consolidating, or exhibiting reversal behaviour.
How it works:
* After the session starts, the indicator records the highest and lowest prices during the first hour.
* These levels are plotted and extended across the session.
* They provide a visual reference for observing reactions, targets, or rejection zones.
Inputs / Options:
* Enable or disable for each session
* Line style, colour, and label visibility
* Number of historic sessions displayed
EQO Levels (Equity Open)
The indicator plots the opening price of each configured session. These “Equity Open” levels represent short-term reference points that can attract price early in the session.
Once the level is revisited after the Open Box has formed, it is automatically cut to avoid clutter. If not revisited, the line remains as an untested reference, similar to a naked point of control.
How it works:
* At session open, the open price is recorded.
* The level is plotted as a local reference.
* If price interacts with the level after the Open Box completes, the line is cut.
* Untested EQOs extend forward until interacted with.
Inputs / Options:
* Enable/disable per session
* Line style and label settings
* Optional extension into the next day
* Option for cutting vs. hiding on revisit
* Number of historic sessions displayed
OB Range Expansions (Automatic)
Range expansions are calculated from the height of the Open Box. These levels provide structured reference zones for identifying potential continuation or exhaustion areas within a session.
How it works:
* After the Open Box is formed, multiples of the range (e.g., 1×, 2×, 3×) are projected.
* These expansion levels are plotted above and below the range.
* Price reactions near these areas can illustrate continuation, hesitation, or potential reversal.
Inputs / Options:
* Enable or disable per session
* Select number of multiples
* Line style, colour, and label settings
* Extension length into the session
Stacey Burke 12-Candle Window Marker
The indicator can highlight the 12-candle window often referenced in Stacey Burke’s session methodology. This window represents the key active period of each session where breakout attempts, volatility shifts, and reversal signatures often occur.
How it works:
* A configurable window (default 12 candles) is highlighted from each session open.
* This window acts as a guide for observing active session behaviour.
* It remains visible throughout the session for structural context.
Inputs / Options:
* Enable/disable per session
* Configurable window duration (default: 3 hours)
* Colour and transparency controls
Concept and Integration
The Open Box is built around the same multi-timeframe logic that underpins the broader TrendPredator framework.
While higher-timeframe tools track bias and setups across the H8–D–W–M levels, the Open Box focuses on the H1–M30 domain to define session structure and observe how early intraday behaviour aligns with higher-timeframe conditions.
The indicator integrates with the TrendPredator FO (Breakout, Fakeout & Trend Switch Detector), which highlights microstructure signals on lower timeframes (M15/M5). Together they form a layered workflow:
* Higher timeframes: context, bias, and developing setups
* TrendPredator OB: intraday and intra-session structure
* TrendPredator FO: microstructure confirmation (e.g., FOL/FOH, switches)
This alignment provides a structured way to observe how daily directional context interacts with intraday behaviour.
See the public open source indicator TP FO here (click on it for access):
Practical Application
Before Session Open
* Review previous session Open Box, Open level, and VWAPs
* Assess how higher-timeframe bias aligns with potential intraday continuation or reversal
* Note untested EQO levels or VWAPs that may function as liquidity attractors
During Session Open
* Observe behaviour around the first-hour high/low and higher-timeframe reference levels
* Monitor how the M15 and 30-minute ranges close
* Track reactions relative to the session open level and the session VWAP
After the Open Box completes
* Assess price interaction with Open Box boundaries and first-hour levels
* Use microstructure signals (e.g., FOH/FOL, switches) for potential confirmation
* Refer to expansion levels as reference zones for management or target setting
After Session
* Review how price behaved relative to the Open Box, EQO levels, VWAPs, and expansion zones
* Analyse breakout attempts, fakeouts, and whether intraday structure aligned with the broader daily move
Example Workflow and Trade
1. Higher-timeframe analysis signals a Daily Fakeout Low Continuation (bullish context).
2. The New York session forms an Open Box; price breaks above and holds above the first-hour high.
3. A Fakeout Low + Switch Bar appears on M5 (via FO), after retesting the session VWAP triggering the entry.
4. 1x expansion level serves as reference targets for take profit.
Relation to the TrendPredator Ecosystem
The Open Box is part of the TrendPredator Indicator Family, designed to apply multi-timeframe logic consistently across:
* higher-timeframe context and setups
* intraday and session structure (OB)
* microstructure confirmation (FO)
Together, these modules offer a unified structure for analysing how daily and intraday cycles interact.
Disclaimer
This indicator is for educational purposes only and does not guarantee profits.
It does not provide buy or sell signals but highlights structural and behavioural areas for analysis.
Users are solely responsible for their trading decisions and outcomes.
Traders

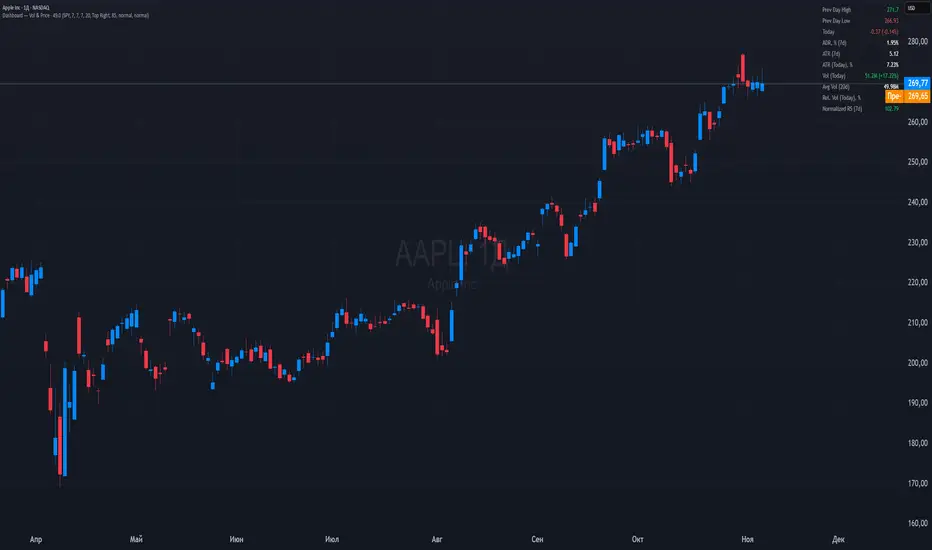
Dashboard — Vol & PriceDashboard for traders
Indicator Description
1. Prev Day High
What it shows: the previous trading day's high.
Why it shows: a resistance level. Many traders watch to see if the price will hold above or below this level. A breakout can signal buying strength.
2. Prev Day Low
What it shows: the previous day's low.
Why it shows: a support level. If the price breaks downwards, it signals weakness and a possible continuation of the decline.
3. Today
What it shows:
The difference between the current price and yesterday's close (in absolute values and as a percentage).
Color: green for an increase, red for a decrease.
Why it shows: immediately shows how strong a gap or movement is today relative to yesterday. This is an indicator of current momentum.
4. ADR, % (Average Daily Range)
What it shows: Average daily range (High – Low), expressed as a percentage of the closing price, for the selected period (default 7 days).
Why it's useful: To understand the "normal" volatility of an instrument. For example, if the ADR is 3%, then a 1% move is small, while a 6% move is very large.
5. ATR (Average True Range)
What it shows: Average fluctuation range (including gaps), in absolute points, for the specified period (default 7 days).
Why it's useful: A classic volatility indicator. Useful for setting stops, calculating position sizes, and identifying "noise" movements.
6. ATR (Today), %
What it shows: How much the current movement today (from yesterday's close to the current price) represents in % of the average ATR.
Why it shows: Shows whether the instrument has "played out" its average range. If the value is already >100%, there is a high probability that the movement will begin to slow.
7. Vol (Today)
What it shows:
Current trading volume for the day (in millions/billions).
Comparison with yesterday as a percentage (for example: 77.32M (-52.78%)).
Color: green if the volume is higher than yesterday; red if lower.
Why it shows:Quickly shows whether the market is active today. Volume = fuel for price movement.
8. Avg Vol (20d)
What it shows: Average daily volume over the last 20 trading days.
Why it's useful:"normal" activity level. It's a convenient backdrop for assessing today's turnover.
9. Rel. Vol (Today), % (Relative Volume)
What it shows: Deviation of the current volume from the average (20 days).
Formula: `(today / average - 1)` * 100`.
+30% = volume 30% above average, -40% = 40% below average.
Color: green for +, red for –.
Why it's useful:A key indicator for a trader. If RelVol > 100% (green), the market is "charged," and the movement is more significant. If low, activity is weak and movements are less reliable.
10. Normalized RS (Relative Strength)
What it shows: the relative strength of a stock to a selected benchmark (e.g., SPY), normalized by the period (default 7 days).
100 = same result as the market.
> 100 = the stock is stronger than the index.
<100 = weaker than the index.
Why it's needed: filtering ideas. Strong stocks rise faster when the market rises, weak stocks fall more sharply. This helps trade in the direction of the trend and select the best candidates.
In summary:
Prev High / Low — key support and resistance levels.
Today — an instant understanding of the current momentum.
ADR and ATR — volatility and potential movement.
ATR (Today) — how much the instrument has already "run."
Vol + Rel.Vol — activity and confirmation of the movement's strength.
RS — selecting strong/weak leaders against the market.
Monthly DividerThis Trading View indicator visually marks the beginning of each month starting from January 2024. It draws vertical lines on the chart at the start of each month and labels them with the corresponding month abbreviation (e.g., "Jan", "Feb"). Users can customize the color and thickness of the lines through the indicator settings, allowing for personalized chart aesthetics. This tool is ideal for traders and analysts who want to easily identify month transitions and enhance their technical analysis.

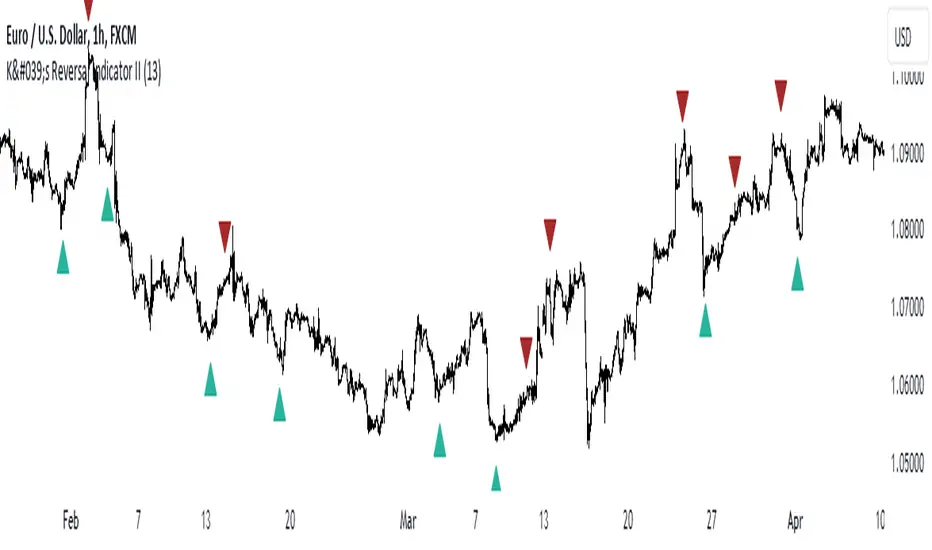
K's Reversal Indicator IIK’s Reversal Indicator II uses a moving average timing technique to deliver its signals. The method of calculation is as follows:
* Calculate a moving average (by default, a 13-period moving average).
* Calculate the number of times where the market is above its moving average. Whenever that number hits 21, a bearish signal is generated, and whenever that number if zero, a bullish signal is generated.
The indicator signals short-term to mid-term reversals as a mean-reversion move.
ICT Commitment of Traders° by toodegreesDescription:
The Commitment of Traders (COT) is a valuable raw data report released weekly by the Commodity Futures Trading Commission (CFTC). This report offers insights into the current long and short positions of three key market entities:
Commercial Traders ( usually represented in red )
Large Traders ( typically depicted in green )
Small Speculator Traders ( commonly shown in blue )
The concept of utilizing the COT data as a strategic trading tool was first introduced by Larry Williams, who emphasized the importance of monitoring Commercial Speculators – large corporate producers or consumers of commodities.
The Inner Circle Trader (ICT) prompts us to delve deeper into this data. While we can easily determine their Net Position (also referred to as the Main Program) by subtracting Commercial Short Positions from the Commercial Long Positions, this calculation doesn't reveal their ongoing Hedge Program .
Merely following the Main Program won't provide a trading edge. Aligning with the Hedge Program can be an invaluable weapon in your trading arsenal.
The Commercial Speculators' Hedge Program can be unveiled by examining the highest and lowest reading of their Net Position over a chosen time period and setting a new "zero line" between these extremes. This process generates a novel "COT Graph" providing a detailed understanding of the Commercial Speculators' current market activity.
When the Hedge Program, Seasonality, and Open Interest are cross-referenced with Institutional Orderflow, a trader can construct a very clear medium-to-long-term market narrative.
Features:
Access COT Data for the Commercial Speculators via Tradingview's reliable data source
Automate calculations and display the 3-month, 6-month, 12-month, 2-year, and 3-year Hedge Program
Define your own Custom Time Range for the Hedge Program
Display the Main Program and all Hedge Programs in an easy-to-understand table format
Additionally, by following the included instructions, you can augment your table with COT data from multiple markets. This extra information can help monitor correlated markets and develop a more robust market narrative:

Daily Gaps & Trapped PositionsThis script builds substantially upon the default Gaps script provided by Tradingview. Functionality was added to allow users to decide what price from the previous session is used to determine a daily gap, added support for showing gaps across all timeframes up to the daily time frame, and also allow gaps to be shown even with ETH enabled on the chart. This script provides support across normal securities, futures, and also crypto.
Users can decide between the following selections to determine if a daily gap has formed:
- Previous Session Close
- Previous Session High/Low
- Last RTH Candle High/Low
The other larger piece that was added is something called trapped positions or what some folks familiar with Market Profile would call "single prints". They could also be considered FVGs but they are a specific subset of FVGs as these must from above or below the current session's high/low.
Single prints form above or below a current session's high/low and can be considered an area where price has moved too fast in that area and price will most likely return to these areas at a later point in time. In some teachings, these are also looked at as "trapped shorts" (lighter blue box color) or "trapped supply" (yellow orange box color) which creates an area where there will be potential support (trapped shorts) or resistance (trapped supply) when this area is revisited in the future. Adding these to your chart will simply provide additional areas of interest where you may see buying or selling.
Both gaps and trapped positions have the following options:
- Show only active gaps/trapped positions. Selecting this will only show areas where price has not completely traded through the box.
- Close gaps/trapped positions partially. If this is selected, it will reduce the box size as price is traded through the area. If it is not selected, the box will only disappear once price has traded through the entire box completely.
There are some additional settings that allow you to tailor how many boxes show up on the chart. These settings are as follows:
- Max number of boxes. This setting will only plot up to this number of gaps/trapped positions.
- Minimum Deviation. This will prevent gaps/trapped positions from showing if they are too small relative to average across that last 14 periods.
- Limit Max Box Trail Length (bars). If checkbox is selected, the box will stop being extended after X number of bars given in this input.

WillyCycle Oscillator&DoubleMa/ErkOzi/"This code creates a technical analysis indicator used to calculate and visualize the WillyCycle oscillator and double moving average indicators on the price of a financial asset. The functionality can be summarized as follows:
*Calculate the WillyCycle oscillator: The WillyCycle is an oscillator calculated based on the highest and lowest values of an asset. This oscillator is used to measure overbought or oversold conditions of the asset.
*Calculate the double moving average: The double moving average helps determine trends by calculating the short-term and long-term moving averages of asset prices.
*Use the WillyCycle oscillator and double moving average indicators together: The WillyCycle oscillator is combined with the double moving averages to provide a clearer indication of overbought and oversold conditions.
*Visualize the indicator with color coding: The indicator is color-coded to show overbought and oversold conditions. Additionally, line and background colors are changed to make the indicator more readable.
Many parameters can be adjusted on the indicator: The indicator can be customized and modified by the user. For example, the period of the WillyCycle oscillator and the lengths of the double moving averages can be adjusted."
The strategy is based on two indicators - the WillyCycle oscillator and the double moving average. The WillyCycle oscillator measures overbought and oversold conditions of the asset based on its highest and lowest values. The double moving average calculates short-term and long-term moving averages of the asset's price, which can help identify trends.
The WillyCycle oscillator and the double moving average are combined in this strategy to provide a clearer indication of overbought and oversold conditions. When the WillyCycle oscillator indicates that the asset is oversold and the short-term moving average crosses above the long-term moving average, it may signal a buy opportunity. Conversely, when the WillyCycle oscillator indicates that the asset is overbought and the short-term moving average crosses below the long-term moving average, it may signal a sell opportunity.
To make it easier for traders to read and interpret the indicator, color-coding is used to indicate overbought and oversold conditions. The user can also customize the indicator by adjusting parameters such as the period of the WillyCycle oscillator and the lengths of the double moving averages.
*ıt provides successful buy and sell signals for price reversals.
*You can open counter trades in overbought and oversold areas by following the averages.

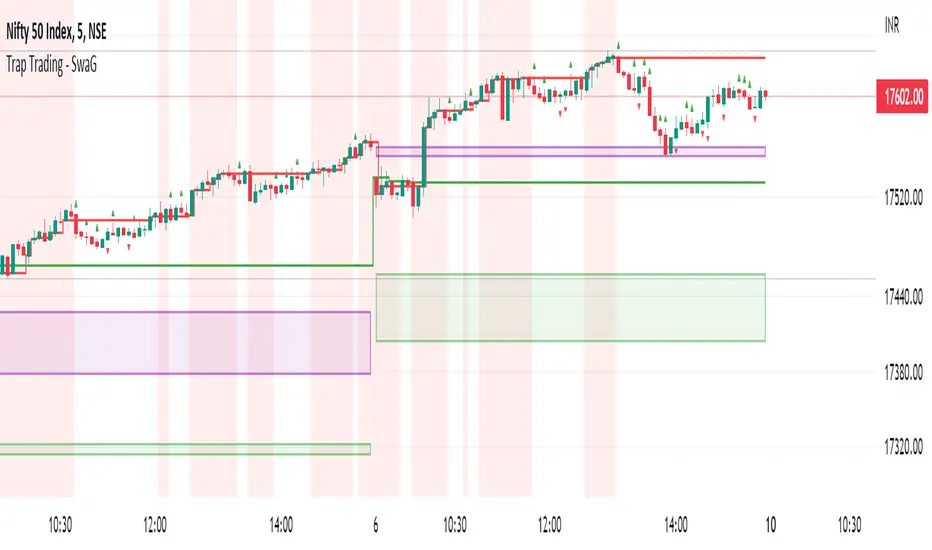
Trap Trading - SwaGThis is an intraday indicator
Set timeframe to 5 min
Take long entry on the high brakes of selling traps
Take short entry on the low brakes of buying traps
ignore traps left to red zones
Use the nearest trap
take profit/loss on a 1:2 risk-to-reward basis.
Trap Trading
Trap trading is a trading strategy that seeks to profit from false breakouts in financial markets. This strategy is based on the idea that when the market breaks through a key level of support or resistance, many traders will take that as a signal to enter or exit trades, causing the price to move further in the breakout direction.
However, in some cases, the market will quickly reverse course and move in the opposite direction, trapping those traders who entered the trade based on the breakout. This can create a trading opportunity for those who are able to identify the false breakout and trade in the opposite direction.
The trap trading strategy typically involves identifying a key level of support or resistance on a price chart and then waiting for the market to break through that level. If the price continues to move in the breakout direction, the trader may enter a trade in that direction with a stop loss set just below the breakout level.
However, if the market quickly reverses and moves back below the breakout level, the trader may enter a trade in the opposite direction with a stop loss set just above the breakout level. The idea is to take advantage of the trapped traders who entered the trade based on the false breakout, and profit from the market's reversal.
As with any trading strategy, there are risks and potential drawbacks to trap trading. False breakouts can be difficult to identify, and there is always the risk that the market will continue to move in the breakout direction, resulting in losses for the trader. Additionally, trap trading requires a solid understanding of technical analysis and market trends, which may take time and experience to develop.
Waddah Attar Explosion with TDI First of all, a big shoutout to @shayankm, @LazyBear, @Bromley, @Goldminds and @LuxAlgo, the ones that made this script possible.
This is a version of Waddah Attar Explosion with Traders Dynamic Index.
WAE provides volume and volatility information. Also, WAE calculation was changed to a full-on MACD, to provide the momentum: the idea is to "assess" which MACD bars have significant momentum (i.e. crossover the Explosion Line)
TDI provides momentum, divergences as well as overbought and oversold areas. There is also a RSI on a different timeframe, for convergence.
Almost everything is editable:
- All moving averages are customizable, including the TRAMA, from @LuxAlgo
Waddah Attar Explosion_
- Three different crossing signals: histogram crossing contracting Explosion Line, expanding Explosion Line and ascending Explosion Line while both Bolling Bands are expanding; Explosion Line shows different color when expanding.
- Explosion line signals: Below DeadZone line and Exhaustion (highest value in a given lookback period). You can set a predefined EPL slope to filter out some noise.
- Deadzone signal : Deadzone squeeze ( lowst value in a given lookback period)
TDI:
- Overbought an Oversold signals. The OB and OS shapes have two colors, in order to display extreme signals on current timeframe or extreme signals on current and different time frame.
- Visual display of RSI outside the Bollinger Bands, and crossing of RSI Moving Average crossing of zero line.
I believe this combination is great for so many reasons!
Like the idea of TTM Squeeze? You can tune the Deadzone and Explosion lines to look for a volatility breakout
Like trading divergences or want to filter out extreme areas? The RSI is great for that
You like the using the MACD strategy but don't like the amount of false signals given? this WAE version filters some of them out.
If you are a Bollinger bands fan, you can customize both indicators to trade breakouts and/or mean reversion strategies, and filter out exhaustion of the bands expansion
This is my first publication, so give it a go and provide feedback if possible.

Super OrderBlock / FVG / BoS Tools by makuchaku & eFeThis super indicator is a Swiss army knife for Smart Money traders for OrderBlocks / FVG / BoS
It provides many options for drawing (non-repainting) boxes for OrderBlocks, Fair Value Gaps (FVG) and Break of Structures. The boxes are extended into the future, until the first retest/mitigation.
Some of the additional options (not explained in the diagrams above)
PPDD OB : An order block which is formed after interacting with Liquidity (old low/high, fractal low/high, etc). Since these OB's are in the most premium or most discount, they are Premium Premium Discount Discount OB's (PPDD OB)
HVB Bars : When the volume of any bar is higher than the average volume of last N bars, it could mean something important (in the right context). Hence, the indicator allows for coloring them differently.
This indicator was built as a collaboration between @makuchaku & eFe
Pro tip : This indicator is a simply a tool to visualize trading concepts on the candle stick chart. It is the job of the trader to sequence these effectively into a profitable trade.
If you come across any bug or have a question on how to effectively use the indicator, please don't hesitate to ask questions.
Good luck & good trading!

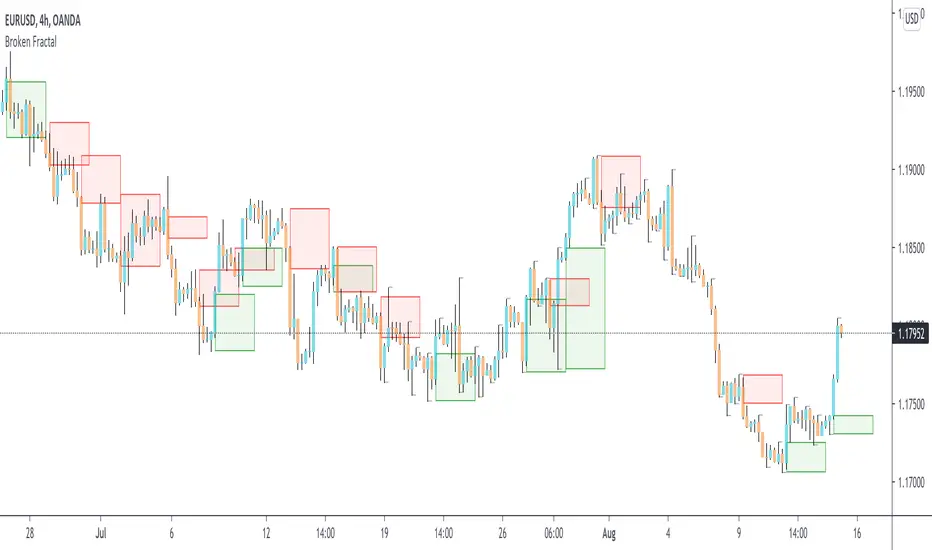
Broken Fractal : Someone's broken dream is your profit!Idea
The idea is simple : when market turns around, it traps a bunch of traders off guard. We trade with them, in the same direction of their exit!
Method
We let the market first create a fractal
We then let the market create an opposite fractal
We then let the market break the first fractal it created, thereby trapping lots of trades in the process
We then patiently wait till the market gives these trapped traders a chance to exit - and we trade in the same direction
How to use?
Green boxes are for long entry, red boxes are for short.
Whenever a box appears, that's the risk criteria - setup limit orders and trade along!
Works on all timeframes
If you like this script, please leave a note on how you are using it.
I personally use it with Higher Timeframe bias.
PS1 : some traders call this Break of market structure, some call it Breaker, I just call it "Broken Fractal"
PS2 : Break of a broken fractal is also very potent. Watch out for those!
Volatility Traders Minds Strategy (VTM Strategy)Volatility Traders Minds Strategy (VTM Strategy)
I found this startegy on internet, with a video explaingin how it works.
Conditions for entry:
1 - Candles must to be above or bellow the 48 MA (Yellow line)
2 - Candles must to break the middle of bollinger bands
3 - Macd must to be above or bellow zero level;
4 - ADX must to be above 25 level
Credits to who developed this startegy (google it).
Thanks to all pinescripters mentined in the code for their snippets.
It could be improved with stop loss based on ATR etc.
I have also a study with alerts.
Please use comment section for any feedback or contact me if you need support.

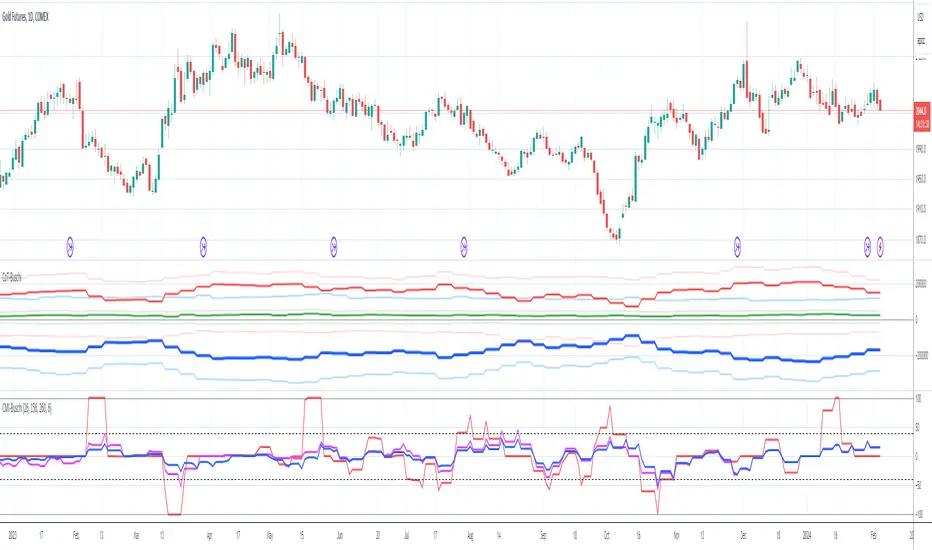
CoT Absolute Percent-Buschi
English
I'm often asked to provide an alternate view on the CoT data. For example, the indicator "Commercial index" is an oscillator from 0 to 100, but oftentimes it can be helpful to look at the absolute position. So, here the absolute position of certain parts of the CoT report are given, alongside with the percentage of a given time frame to put them in place.
The inputs are:
CoT Part Number ('1' for Commercials Short, '2' for Commercials Long, '3' for Commercials Netto, '4' for Large Speculators Short, '5' for Large Speculators Long, '6' for Large Speculators Netto, '7' for Small Speculators Short, '8' for Small Speculators Long, '9' for Small Speculators Netto, '10' for Open Interest)
Review Period (in years, just used for the percentage)
Percent Line 1, 2, 3, 4 (just to provide some lines which can be altered as required)
DISCLAIMER: I'm aware of Pine Script's ability to provide options as inputs (which would be much nicer for the CoT Parts). Alas, it is only available since version 3, and I noticed that for some reason the CoT data is not correctly adjusted to last Tuesday when using higher versions than 1. If someone knows a solution, please contact me.
Deutsch
Ich werde oft gefragt, eine alternative Sicht auf die CoT-Daten zu geben. Der Indikator "Commercial Index" zum Beispiel schwankt als Oszillator zwischen 0 und 100, aber oft kann der Blick auf die absolute Positionierung hilfreich sein. Also werden hier die Absolutpositionen verschiedene CoT-Bestandteile wiedergegeben, zusammen mit einer prozentualen Einteilung über eine vorgegebene Zeitspanne, um sie einordnen zu können.
The Eingaben lauten:
CoT Part Number ('1' Commercials Short, '2' Commercials Long, '3' Commercials Netto, '4' Large Speculators Short, '5' Large Speculators Long, '6' Large Speculators Netto, '7' Snall Speculators Short, '8' Small Speculators Long, '9' Small Speculators Netto, '10' Open Interest)
Review Period (Zeitintervall in Jahren, um die Prozentlinien zeichnen zu können)
Percent Line 1, 2, 3, 4 (um die Prozentlinien zur Verfügung zu stellen, die dann beliebig geändert werden können)
DISCLAIMER: Ich weiß über die Möglichkeit Bescheid, ab Pine Script Version 3 Optionen als Eingaben benutzen zu können (was deutlich angenehmer für die CoT-Bestandteile wäre). Leider habe ich gemerkt, dass die CoT-Daten bei Versionen über 1 leider nicht korrekt auf letzten Dienstag adjustiert werden, keine Ahnung warum. Falls jemand eine Lösung kennt, bitte kontaktieren.

Commercial Movement Index-BuschiEnglish
Inspired by the book "The Commitments of Traders Bible" by Stephen Briese, this indicator is a follow-up of my already published "Commercial Index-Buschi".
Here, the Commercial Index isn't shown in values from 0 to 100, but in how far the value changed from a given timeframe (default Movement Reference: 6 weeks). Therefore it ranges from 100 (bullish move from the Commercials during the last weeks) to -100 (bearish move).
Deutsch
Inspiriert durch das Buch "The Commitments of Traders Bible" by Stephen Briese, ist dieser Indikator eine Weiterentwicklung meines bereits veröffentlichten Skriptes "Commercial Index-Buschi".
Hier wird der Commercial Index nicht in Werten von 0 bis 100 angezeigt, sondern in wieweit er sich innerhalb eines vorgegebenen Zeitfensters (Standard: Movement Reference: 6 Wochen) verändert hat. Daher schwankt er zwischen 100 (bullishe Bewegung der Commercials innerhalb der letzten Wochen) und -100 (bearishe Bewegung).
Open Interest Rank-BuschiEnglish:
One part of the "Commitment of Traders-Report" is the Open Interest which is shown in this indicator (source: Quandl database).
Unlike my also published indicator "Open Interest-Buschi", the values here are not absolute but in a ranking system from 0 to 100 with individual time frames-
The following futures are included:
30-year Bonds (ZB)
10-year Notes ( ZN )
Soybeans (ZS)
Soybean Meal (ZM)
Soybean Oil (ZL)
Corn ( ZC )
Soft Red Winter Wheat (ZW)
Hard Red Winter Wheat (KE)
Lean Hogs (HE)
Live Cattle ( LE )
Gold ( GC )
Silver (SI)
Copper (HG)
Crude Oil ( CL )
Heating Oil (HO)
RBOB Gasoline ( RB )
Natural Gas ( NG )
Australian Dollar (A6)
British Pound (B6)
Canadian Dollar (D6)
Euro (E6)
Japanese Yen (J6)
Swiss Franc (S6)
Sugar ( SB )
Coffee (KC)
Cocoa ( CC )
Cotton ( CT )
S&P 500 E-Mini (ES)
Russell 2000 E-Mini (RTY)
Dow Jones Industrial Mini (YM)
Nasdaq 100 E-Mini (NQ)
Platin (PL)
Palladium (PA)
Aluminium (AUP)
Steel ( HRC )
Ethanol (AEZ)
Brent Crude Oil (J26)
Rice (ZR)
Oat (ZO)
Milk (DL)
Orange Juice (JO)
Lumber (LS)
Feeder Cattle (GF)
S&P 500 ( SP )
Dow Jones Industrial Average Index (DJIA)
New Zealand Dollar (N6)
Deutsch:
Ein Bestandteil des "Commitment of Traders-Report" ist das Open Interest, das in diesem Indikator dargestellt wird (Quelle: Quandl Datenbank).
Anders als in meinem ebenfalls veröffentlichten Indikator "Open Interest-Buschi" werden hier nicht die absoluten Werte dargestellt, sondern in einem Ranking-System von 0 bis 100 mit individuellen Zeitrahmen.
Folgende Futures sind enthalten:
30-jährige US-Staatsanleihen (ZB)
10-jährige US-Staatsanleihen ( ZN )
Sojabohnen(ZS)
Sojabohnen-Mehl (ZM)
Sojabohnen-Öl (ZL)
Mais( ZC )
Soft Red Winter-Weizen (ZW)
Hard Red Winter-Weizen (KE)
Magerschweine (HE)
Lebendrinder ( LE )
Gold ( GC )
Silber (SI)
Kupfer(HG)
Rohöl ( CL )
Heizöl (HO)
Benzin ( RB )
Erdgas ( NG )
Australischer Dollar (A6)
Britisches Pfund (B6)
Kanadischer Dollar (D6)
Euro (E6)
Japanischer Yen (J6)
Schweizer Franken (S6)
Zucker ( SB )
Kaffee (KC)
Kakao ( CC )
Baumwolle ( CT )
S&P 500 E-Mini (ES)
Russell 2000 E-Mini (RTY)
Dow Jones Industrial Mini (YM)
Nasdaq 100 E-Mini (NQ)
Platin (PL)
Palladium (PA)
Aluminium (AUP)
Stahl ( HRC )
Ethanol (AEZ)
Brent Rohöl (J26)
Reis (ZR)
Hafer (ZO)
Milch (DL)
Orangensaft (JO)
Holz (LS)
Mastrinder (GF)
S&P 500 ( SP )
Dow Jones Industrial Average Index (DJIA)
Neuseeland Dollar (N6)

Open Interest-Buschi
English:
One part of the "Commitment of Traders-Report" is the Open Interest which is shown in this indicator (source: Quandl database).
The following futures are included:
30-year Bonds (ZB)
10-year Notes (ZN)
Soybeans (ZS)
Soybean Meal (ZM)
Soybean Oil (ZL)
Corn (ZC)
Soft Red Winter Wheat (ZW)
Hard Red Winter Wheat(KE)
Lean Hogs (HE)
Live Cattle (LE)
Gold (GC)
Silver (SI)
Copper (HG)
Crude Oil (CL)
Heating Oil (HO)
RBOB Gasoline (RB)
Natural Gas (NG)
Australian Dollar (A6)
British Pound (B6)
Canadian Dollar (D6)
Euro (E6)
Japanese Yen (J6)
Swiss Franc (S6)
Sugar (SB)
Coffee (KC)
Cocoa (CC)
Cotton (CT)
S&P 500 E-Mini (ES)
Russell 2000 E-Mini (RTY)
Dow Jones Industrial Mini (YM)
Nasdaq 100 E-Mini (NQ)
Platin (PL)
Palladium (PA)
Aluminium (AUP)
Steel (HRC)
Ethanol (AEZ)
Brent Crude Oil (J26)
Rice (ZR)
Oat (ZO)
Milk (DL)
Orange Juice (JO)
Lumber (LS)
Feeder Cattle (GF)
S&P 500 (SP)
Dow Jones Industrial Average Index (DJIA)
New Zealand Dollar (N6)
Deutsch:
Ein Bestandteil des "Commitment of Traders-Report" ist das Open Interest, das in diesem Indikator dargestellt wird (Quelle: Quandl Datenbank).
Folgende Futures sind enthalten:
30-jährige US-Staatsanleihen (ZB)
10-jährige US-Staatsanleihen (ZN)
Sojabohnen(ZS)
Sojabohnen-Mehl (ZM)
Sojabohnen-Öl (ZL)
Mais(ZC)
Soft Red Winter-Weizen (ZW)
Hard Red Winter-Weizen (KE)
Magerschweine (HE)
Lebendrinder (LE)
Gold (GC)
Silber (SI)
Kupfer(HG)
Rohöl (CL)
Heizöl (HO)
Benzin (RB)
Erdgas (NG)
Australischer Dollar (A6)
Britisches Pfund (B6)
Kanadischer Dollar (D6)
Euro (E6)
Japanischer Yen (J6)
Schweizer Franken (S6)
Zucker (SB)
Kaffee (KC)
Kakao (CC)
Baumwolle (CT)
S&P 500 E-Mini (ES)
Russell 2000 E-Mini (RTY)
Dow Jones Industrial Mini (YM)
Nasdaq 100 E-Mini (NQ)
Platin (PL)
Palladium (PA)
Aluminium (AUP)
Stahl (HRC)
Ethanol (AEZ)
Brent Rohöl (J26)
Reis (ZR)
Hafer (ZO)
Milch (DL)
Orangensaft (JO)
Holz (LS)
Mastrinder (GF)
S&P 500 (SP)
Dow Jones Industrial Average Index (DJIA)
Neuseeland Dollar (N6)

Commercial / Open Interest-Buschi
English:
Another view the Commitment of Traders (CoT) data
Since the Commercials are often a good indicator for future market movements, I tampered a little bit with their positioning (long or short) in relation to the open interest to visualize some kind of "commercial buying (long) or selling (short) power". It's definitely nothing more than work in progress, but I decided to publish it anyway. Critical comments are mostly welcome.
Deutsch:
Ein weiterer Blick auf die Commitment of Traders (CoT) Daten
Da die Commercials häufig ein guter Indikator für zukünftige Marktbewegungen sind, habe ich ein wenig mit ihrer Positionierung (long oder short) im Verhältnis zum Open Interest herumgebastelt, um eine Art von "kommerzieller Kauf- (long) oder Verkaufs-Kraft" abzubilden. Es ist momentan noch im absoluten Teststadium, aber ich habe mich dazu entschlossen, es trotzdem zu veröffentlichen. Kritische Anmerkungen sind sehr willkommen.

Commercial Index-BuschiThis simple script takes a closer look at the Commercial part of the CoT (Commitment of Traders) Data. It shows thier percentual level on given time frames (default: during the last 6 months, 3 years and 5 years).
This relative perspective is often more useful than the absolute contract numbers.


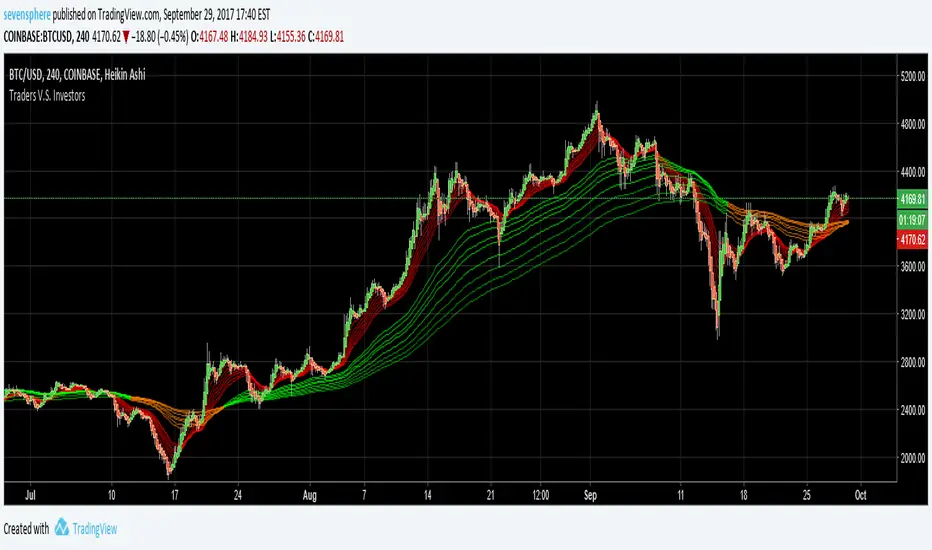
Traders V.S. InvestorsTraders are represented by red lines, they move fast
Investors are represented by green/orange lines, investors move very slow
When you see some quick moves from traders,
you can take the opposite side of the trade because you know investors
are behind you and are very slow to change position.
How to use :
When the green / orange lines are contracting, the indicator tell us that investors are changing position.
When the green /orange lines are expanded, the indicator tell us to go against trader if they go in the wrong direction.

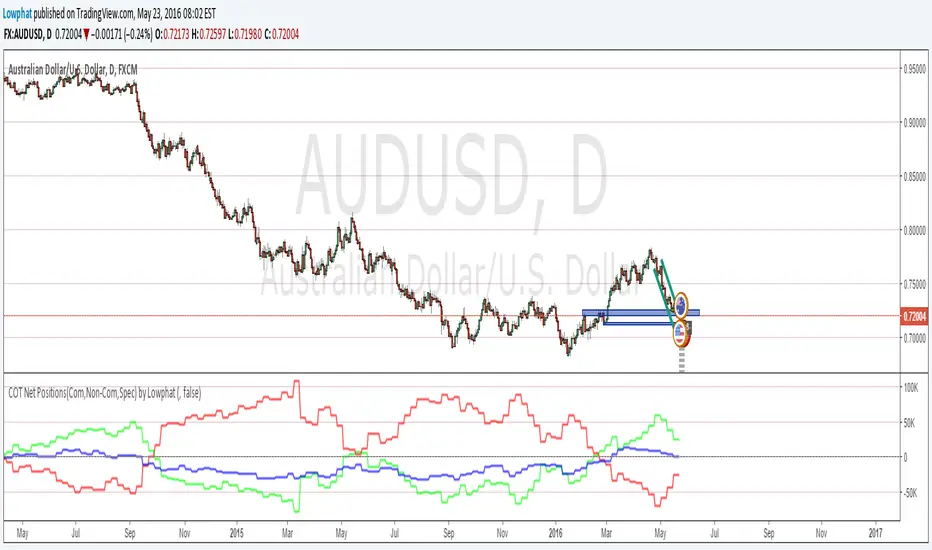
Commitments of Traders(COT) Major's noncom net (beta) By Lowphata charted commitments of traders report
of most majors on one chart.
EUR=red
GBP=blue
CHF=white
CAD=dark green
USD bright green
JPY=yellow
AUD=brown

COT Net Position's (Com,Non-Com and Spec) by LowphatCommitments of Traders with Com's Non-Com's and Spec's in one indicator.