JK Tyre & Industries Ltd – Weekly Chart Breakout WatchJK Tyre & Industries Limited is currently showing strong momentum, and the price action suggests that the stock may be approaching a fresh breakout above the ₹554 level.
Since this analysis is based on the weekly timeframe, the primary focus will be on a weekly breakout and weekly closing above the mentioned resistance (554). A confirmed close above this level will be considered as valid breakout confirmation.
Chart Structure & Price Action
The stock has recently come out of a 30–40 day consolidation phase
Post consolidation, the stock has formed a strong bullish candle, indicating renewed buying interest.
Price action suggests that the stock is respecting the breakout zone
Breakout Perspective
Breakout Level to Watch: ₹554 (weekly closing basis)
This appears to be an all-time high breakout
If sustained, a new upward phase can potentially begin from here
Momentum traders may consider tracking the stock closely once confirmation is received
Trade Planning & Risk Management
Entry should be considered only after a confirmed breakout
The breakout candle low can be used as a reference for risk management
Alternatively, ₹480 can be considered as an invalidation level
Proper position sizing and risk calculation are essential before entering any trade
What to Do Now
Keep the stock on your watchlist
Monitor weekly price action carefully
Avoid premature entries before confirmation
Further updates will be shared as the structure evolves
Disclaimer
This post represents my personal observations and is shared strictly for educational purposes only.
It is not financial advice.
Please:
Do your own analysis
Consult your financial advisor if needed
Always calculate risk before taking any trade
The financial market involves both opportunity and risk, and disciplined decision-making is essential.
Thank you.
See you in the next update.
Community ideas

On the 1H chart, $BNB is forming a Head & ShouldersOn the 1H chart, CRYPTOCAP:BNB is forming a Head & Shoulders after a strong sell-off from the 900+ region.
Left Shoulder: ~785–790
Head: ~728 (marked low on chart)
Right Shoulder: ~770–775
Neckline / Supply Zone: 780–785
Current price is trading below the neckline, which keeps the structure bearish unless invalidated.
🔽 Bearish Scenario (Pattern Confirmation)
If price fails to reclaim 780–785 and shows rejection:
First downside: 745–750
Key support retest: 728
If 728 breaks decisively:
Next downside zones: 700 → 680
This aligns with the measured move of the H&S pattern.
🔼 Bullish Invalidation Scenario
The bearish structure is invalid only if:
Strong 1H close above 785
Follow-through acceptance above 790
If that happens:
Short-term recovery toward 810–830
Still a relief bounce, not trend reversal unless higher timeframes flip

Varun Beverages: Formation Near Support | Multi-Target Study📄 Description
Varun Beverages is currently trading near a strong long-term support zone around ₹440–₹450, where price has formed a stable base after a prolonged correction.
The chart shows a descending trendline breakout attempt along with consolidation near Fibonacci support (0–0.22 zone), indicating possible accumulation.
RSI is in the lower range and approaching oversold territory, which suggests selling pressure is weakening and a potential reversal setup is building.
If price sustains above ₹480–₹500, we may see gradual upside momentum toward:
🎯 Short-term: ₹520+
🎯 Medium-term: ₹600+
🎯 Long-term: ₹680+
This setup offers a favorable risk–reward for positional and swing traders.
📌 View: Bullish above ₹450
🛑 Stop-loss: Below ₹430 (daily close)
📈 Trend: Reversal / Recovery Phase
⚠️ Disclaimer: This is only a technical view for study and learning purposes. Not a recommendation to buy or sell. Please do your own research.

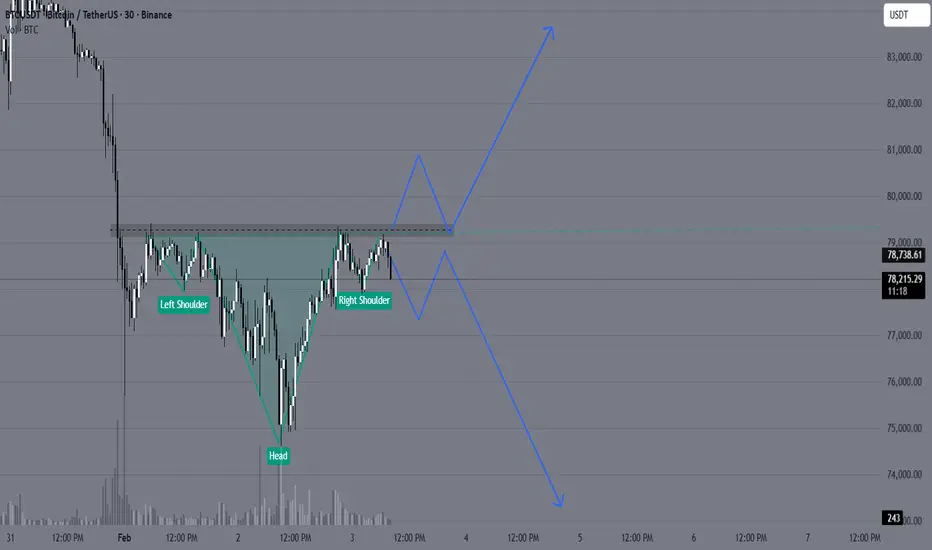
BTCUSD might give Structure Shift Now✅ Pattern: Potential Inverse Head & Shoulders
Look closely:
Left dip → around 76.8k
Deep dip (Head) → around 75k
Right dip → higher low near 76.5k
Now price is pushing back up
This is a classic reversal structure.
✅ Important Level: Neckline Resistance
The dotted zone you marked around:
79,000–79,200
That is the neckline / supply cap.
Price is repeatedly testing it.
📌 Until this breaks, structure is still “building.”
✅ Structure Type: Higher Low Creation
This is the most important:
Previous low = 75k
New low = ~76.2k
That means:
Higher Low → Early Bullish Shift
This is how reversals begin.
🚦What’s Needed for Confirmation?
Bullish Confirmation = Break + Close Above 79.2k
If BTC closes above that zone:
✅ Structure break
✅ Trend reversal likely
✅ Next targets:
80.5k
82k
84.4k (major resistance)
⚠️ Bearish Risk
If price rejects again and breaks below:
76.5k support
Then structure fails and BTC can revisit:
75k
73.8k
📌 Conclusion
BTC is creating a structure:
✅ Base + Range
✅ Higher Low
✅ Possible Inverse H&S
⏳ Waiting for neckline breakout
Texas Instruments breaks into price discovery above ATH1 Trend is constructive and the breakout came after a long base, not a random spike
2 The old high was reached, tested, then broken, now price is in discovery
3 The key is whether the market can hold above the breakout zone and stay accepted there
4 Pattern labels are visual context only, they are not required for the signal logic
5 Silent Flow is active, it confirms direction and state, but it does not promise a smooth ride
6 Scenario A is acceptance above the old high, trend can keep working higher
7 Scenario B is a slip back below the old high, then it starts to look like a failed push and price must prove demand again

TRADINGVIEW IS LOOKING FOR A NEW INDIAN REGION MODERATOR!Join Our Team: Exciting Opportunity to Become a Moderator for the Indian Region Community at TradingView!
Hello TradingView Enthusiasts,
Are you passionate about trading and the TradingView platform? We are on the lookout for a new moderator to join our INDIAN REGION Community and help elevate the experience for users like you.
As a moderator, your role is pivotal. You'll guide members, ensure adherence to our community standards, and help users maximize their TradingView experience. This is your chance to shine and directly influence the community dynamics while ensuring a friendly and respectful environment.
The General Tasks are:
✅ Replying to user inquiries that might get sent to you.
✅ Welcoming and encouraging new users
✅ Help reward and recognize users through TradingView Boosts and Editors Picks.
✅ Keeping the peace in our chat rooms
✅ Helping ensure that the site rules are followed
✅ Help maintain the quality of the site - eg unsuggesting poor ideas and untagging non-educational posts.
✅ Being visible - keep posting your ideas, chat with users, post comments on users' ideas etc
While this is an unpaid volunteer position, the benefits are substantial:
✅ Exclusive Access : Engage directly with our internal team, including the founders.
✅ Influence Development : Provide input on platform enhancements and new functionalities.
✅ Free Plan : Enjoy a free ULTIMATE account along with free data packs and exclusive merchandise.
✅ Boost Your Profile : Gain significant exposure, increase your follower count, and enhance your presence across the site.
✅ Career Opportunities : Many of our moderators have transitioned into full-time roles, using this position as a stepping stone to further their careers within TradingView.
We are looking for a Community Leader. We're looking for someone who:
✅ Has in-depth knowledge of the TradingView platform.
✅ Maintains a strong reputation within the community through high-quality content and helpful interactions.
✅ Engages positively with community members, respects diverse opinions, and upholds our community standards.
✅ Can dedicate at least one hour daily to moderating and supporting the community.
✅ Has been an active, respected TradingView member for over six months with minimal rule violations.
✅ Possesses solid general trading knowledge and can communicate effectively in both spoken and written English.
A good indication of this is:
✅ 100 or more posted trade ideas
✅ Have posted educational ideas
✅ Consistently get likes for your posted ideas (quality over quantity)
✅ 100 or more genuine followers
✅ Interact in Minds
✅ Regularly respond to comments on your own and others posts
✅ Have created and posted a Script
You don't need to have done all of these things, but it does help you stand out in the crowd and demonstrate you are familiar with multiple areas of our site.
Think this could be you? Learn more about what it means to be a moderator here:
www.tradingview.com
Ready to apply? Please fill out this form in English:
forms.gle/bsdGF1hw64wc3Epq6
🤔 If you have any questions or need further information, feel free to reach out to @zAngus .
We're excited to see who will join our team next and help us continue to provide a world-class trading community experience.
Warm regards,
💖 TradingView Team

Market Outlook & Trade Setup – Monday, 2nd Feb 2026Major indices corrected heavily yesterday during the Budget announcement due to the increase in STT in F&O and no respite in LTCG.
Nifty, Sensex and Bank nifty went minus by almost 500,1200 and 1500 points respectively. We expect the selling to continue further. Additionally, the selling in metals could continue as global tensions between US-Nato and Russai-Ukraine seems to be improving, so the focus could shift on stocks again.
🔹 NIFTY (Broke 100 MA)
* Previous Close: 24,825
* Expected Range: 24,500 – 25,000
🔹 SENSEX (Broke 100 MA)
* Previous Close: 80,723
* Expected Range: 80,000 - 81,000
🌍 Global & Market Sentiment
* DJIA: -179 | S&P: - 30
💰 Institutional Activity (Cash Market)
* FII: Net Sellers: - ₹ 588 Cr
* DII: Net Buyers: - ₹ 683 Cr
🔥 Events this Week:
India - S&P Global Manufacturing PMI (Jan)
📌 Sectoral Focus (Negative)
Metal, Energy, PSU Bank
👉 Commodities in Focus: Gold, Silver, Copper, Crude, Natural Gas
✌️Important Quarterly Results: Aarti, CUB, Indus Tower, Tata Chem, UPL
📈 Trade smart. Manage risk. Stay disciplined.

PTL Trade SetupCurrent Market Price (CMP): 41.50
Breakout Context: Consolidation breakout confirmed yesterday with strong volume, which adds conviction.
Target: 46.62 (approx. +12.3% from CMP)
Stop Loss: 40.03 (risk of about -3.5% from CMP)
Key Notes
- A breakout with volume often signals genuine momentum, but watch for retests of the breakout zone.
- If price dips near 41.00–40.50 but holds above stop loss, that’s a healthy retest.
- Trail your stop loss upward if price moves strongly toward the target to lock in gains.

KAYNES above 3427 – Breakout or Pullback?KAYNES Technology India has strong long-term earnings growth and good profit and revenue growth over recent years, supported by expanding electronics & EMS market trends.
The stock trades with a relatively high P/E but is backed by a firm order book and industry relevance.
Despite recent volatility and technical sell signals, some brokerages maintain positive long-term growth outlooks, and key quarterly results are due soon.
The stock has bounced off the recent low near 3300 after forming a double bottom, and is now approaching a historically important resistance zone at 3517–3568. Price action around this area will likely define the next directional move.
Bearish Scenario:
If KAYNES gets rejected at 3517–3568 and fails to hold, we could see a pullback toward 3427 — an important psychological and short-term support level, and the closest invalidation point for the bulls. If trades further down below 3427 then next target 3335
Bullish Scenario:
If price breaks above and sustains above 3568, that could unlock further upside with a target around 3690.
3427 will be a major pivot, bulls are likely to defend it strongly, and a clean break below with follow through selling would confirm bearish strength.
I am not sebi registered financial advisor.

Breakout soon Arman Financial Symmetrical Triangle Breakout Setup
RSI near 60 and rising
Trading above EMA50
Volume increasing
2+ yrs of consolidation
Enter after breakout confirmation!
Disc: for study, DYOR

Expecting audcad sell delivery for buy setupsBetween these two red lines inside weekly+daily imb, the set-up could be find for buys
Why? Price already taken the liquidity above and it possible scenario
shows the probability
of retracement ( where structure shift indicates sellside delivery,
however buys will be
more safer approach fundamentally
and technically both .
Fundamental reason : aud have strong
intrest rate i.e (3.6%)
whereas CAD indicates 2.25%
And Technically it's bullish orderflow .🤝

PAGEIND M PATTREN BREAKDOWN 31 01 2026📈 1) Pageind Pattern Structure: M-Pattern / Double Top
An M-Pattern (Double Top) is a bearish reversal pattern with the following components:
Left Top → Right Top ≈ equal highs
Neckline → horizontal support connecting the swing lows between tops
Breakdown → close below the neckline confirms the pattern
CHART LINES :
🔴 Double Top Peak (Both Tops): ~50500
🟢 Neckline / Base Low: ~34000
Support Line : ~17600
👉 This creates a classic M-Pattern.
2) Price Projection (Measured Move)
Calculation: Percentage Move from Neckline to Bottom Target
Top: 50,500
Neckline: 34,000
The distance from Top to Neckline is: 50,500 − 34,000 = 16,500
Measured from the neckline downward, the target projection is:
34,000−16,500=17,500
Your next major support is ~17,600, which is almost exactly the measured move target.
Now, calculate the % move from Neckline (34,000) to Target in downside (17,600):
34,000−17,600
So:
✅ Projected target from neckline to support ~17,600 ⇒ ~48% decline
📊 3) Daily Breakdown Confirmation
I noted that the last two days have broken down below the neckline:
A close below neckline signals a confirmed breakdown

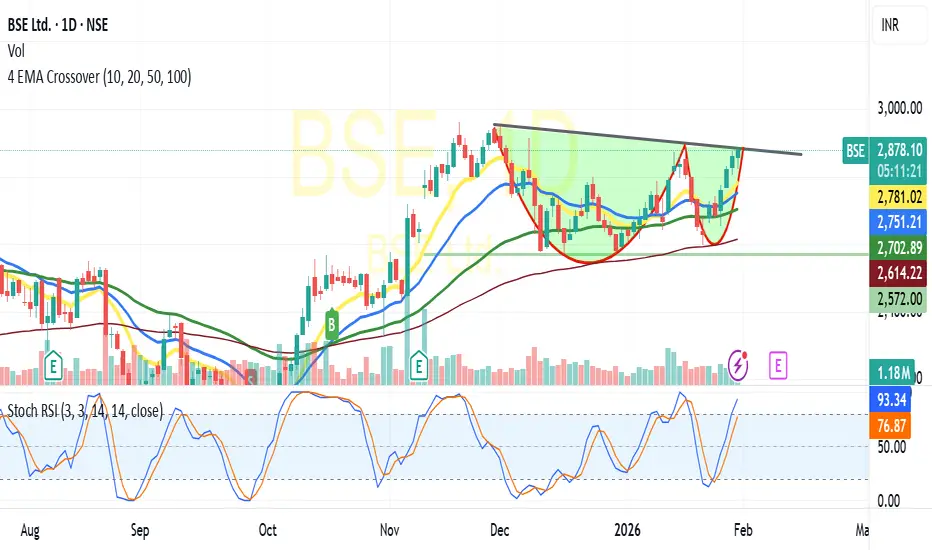
BSE-Likely Cup &Handle Break outBSE:
Trading at 2881 and above all its critical Moving averages Viz10/20/50/10 DEMA
In daily chart has formed C&H Pattern,
Based on the pattern and price volume suggests -breaking the Neckline resistance at 2880-2900 likely to test 2950/3000+ shortly(For educational purpose only)
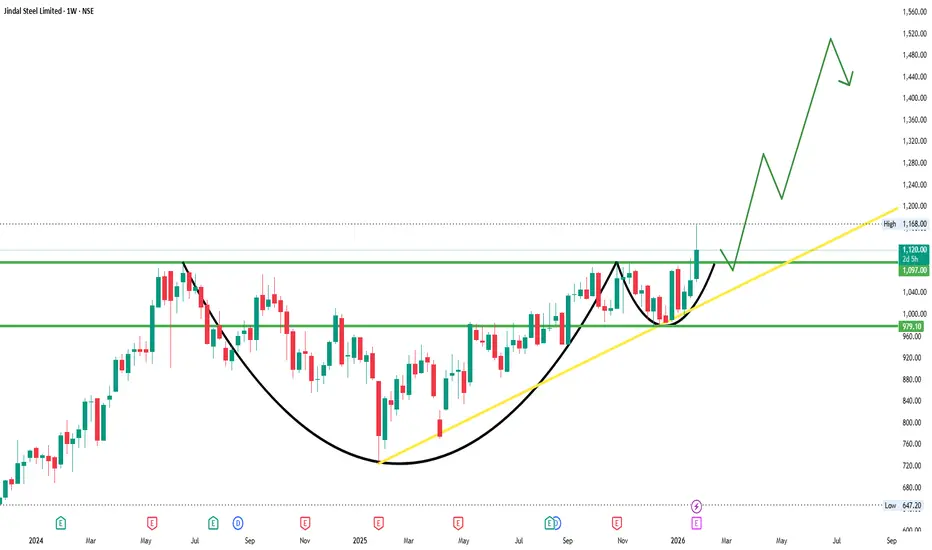
JINDALSTELJINDALSTEL
bullish trend is Showing on the chart.
buy signals in
technical indicators and
cup with handle & ascending triangle chart pattern.
BUYING RANGE 1090/1100
Watch for a breakout above 1090/1100 to sustain the bullish trend. If the resistance holds, there could be a retest towards 975/980 and an uptrend from here.
FUSION - Time to shine?DISCLAIMER: This is NOT a trade recommendation but only my observation. Please do your own analysis before entering your trades
Points to note:
-----------------
1. Price has been in consolidation for 8 months inside a triangle
2. Attempt to breakdown was rejected with price swiftly moving back into the triangle.
3. Finally price is breaking out, accompanied by good volumes
4. Target is the pattern height of the triangle.
Keeping the above points in mind:
Entry CMP, SL 155, TGT 260, RR 2.5

TATASTEEL C&H WEEKLY BREAKOUTTatasteel breaking c&h pattern weekly basis
trading at ATH,metal sector doing well
good volume last few weeks
RSI above 60,macd crossover seen
immediate target 206,after breaking 206 can lead toward 227
NO BUY/SELL RECOMENDATION

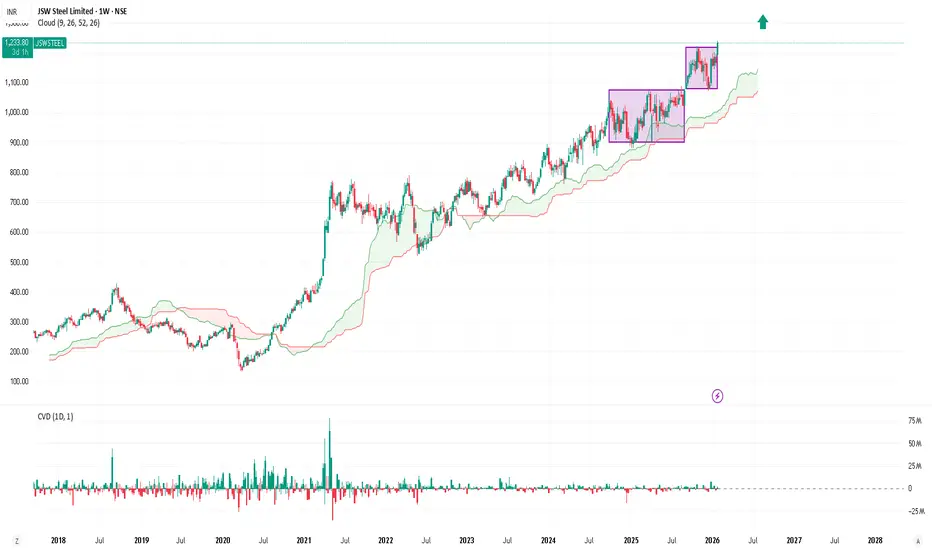
JSW Steel | Bull Continuation After Range Breakout target 1450🏭 Business Snapshot
JSW Steel is one of India’s largest integrated steel producers
Key beneficiary of infrastructure, construction, and capex-led growth
Strong domestic presence with improving capacity utilisation
Steel cycle + government infra spending provide sector tailwinds
(Business context added for background only; trade is purely technical.)
🔍 Technical Structure
Weekly chart shows a clear HH–HL staircase
Price broke out above ₹1160–1180 multi-week range
Breakout followed by healthy consolidation (no distribution)
Price holding above VWAP & EMA cluster
Volume stable → no exhaustion signs
✅ Ideal Buy Zone
₹1180 – ₹1210
Prior resistance turned support
VWAP + value area support
Avoid chasing above ₹1240
🎯 Targets
Target 1: ₹1380
Target 2: ₹1450
(Trail stop after T1 if price holds above VWAP)
❌ Stop Loss / Invalidation
₹1145 (Daily closing basis)
Below support zone
Breakdown of HL structure invalidates setup
📐 Risk–Reward
Risk: ~₹35–45
Reward: ₹160–240
R:R ≈ 1:3+
🧠 TradingView Disclaimer
This chart is shared for educational purposes only.
Levels are based on price action and market structure.
Trade only if aligned with your own risk managemen
BUY TODAY SELL TOMORROW for 5%DON’T HAVE TIME TO MANAGE YOUR TRADES?
- Take BTST trades at 3:25 pm every day
- Try to exit by taking 4-7% profit of each trade
- SL can also be maintained as closing below the low of the breakout candle
Now, why do I prefer BTST over swing trades? The primary reason is that I have observed that 90% of the stocks give most of the movement in just 1-2 days and the rest of the time they either consolidate or fall
Resistance Breakout in RAIN
BUY TODAY SELL TOMORROW for 5%

COAL INDIA (1W) – Breakout From Long Consolidation | Key Levels 🟢 What’s Happening on the Chart?
• COAL INDIA was in a strong uptrend earlier and then entered a long sideways consolidation
• Price formed a solid base with multiple rejections from the same zone
• Recently, price broke and reclaimed the key resistance area
• Old resistance is now acting as new support (very bullish sign)
📌 Key Levels (Simple & Clear):
• Support: ₹420–₹430
• Resistance: ₹470–₹500
• Major Supply Zone: ₹500–₹520
• Trend Invalid Below: ₹410 (weekly close)
📈 Price Action Insight:
• Strong bullish weekly candle
• Breakout + retest structure visible
• Buyers are in control as long as price holds above support
💡 Bias:
• Bullish above ₹420
• Expect consolidation or continuation towards higher levels
⸻
⚠️ Disclaimer
This chart analysis is only for educational purposes.
I am not a SEBI-registered advisor.
This is not a buy or sell recommendation.
Trading and investing involve market risk.
Always do your own research or consult a SEBI-registered professional.
⸻
❤️ If this analysis helps, do like & save for future reference
(Weekly levels work best when saved 👀📌)

#DCBBANK - BreakOut in DTF with Volume Script: DCBBANK
Key highlights: 💡⚡
📈 C&H BreakOut in Daily Time Frame
📈 Volume spike during Breakout
📈 Base BreakOut
📈 RS Line making 52WH
📈 MACD Crossover
BUY ONLY ABOVE 200 DCB
⏱️ C.M.P 📑💰- 199.62
🟢 Target 🎯🏆 – 12%
⚠️ Stoploss ☠️🚫 – 6%
⚠️ Important: Market conditions are BAD, Avoid entering any Trade. Protect Capital Always
⚠️ Important: Always Exit the trade before any Event.
⚠️ Important: Always maintain your Risk:Reward Ratio as 1:2, with this RR, you only need a 33% win rate to Breakeven.
✅ Boost and Follow to never miss a new idea!✅
Disclaimer: I am not SEBI Registered Advisor. My posts are purely for training and educational purposes. Not a BUY or SELL recommendation.
Eat🍜 Sleep😴 TradingView📈 Repeat 🔁
Happy learning with MMT. Cheers!🥂

JINDALSTEEL | Flag continuationStrong prior impulse, orderly flag structure
-RSI >50, EMAs rising, OBV confirms accumulation
-Sector tailwind: strength in metals
Trade plan:
-Buy > 1100 (volume confirmation required)
-SL: 1030
-Positional target: 1770
-R:R ≈ 1:11

IBEX ltd analysisJAN-2025
1. has got good move and then time correction.
2. Volume is contracting.
3. good momentum score, Good durabilty score.
2. quaterly profit & revenue has increased.
3. EPS has increased.
4. Debt has gone down.has low debt
5. No change in institution holding.
i am managing my risk by stop loss of 6.6%

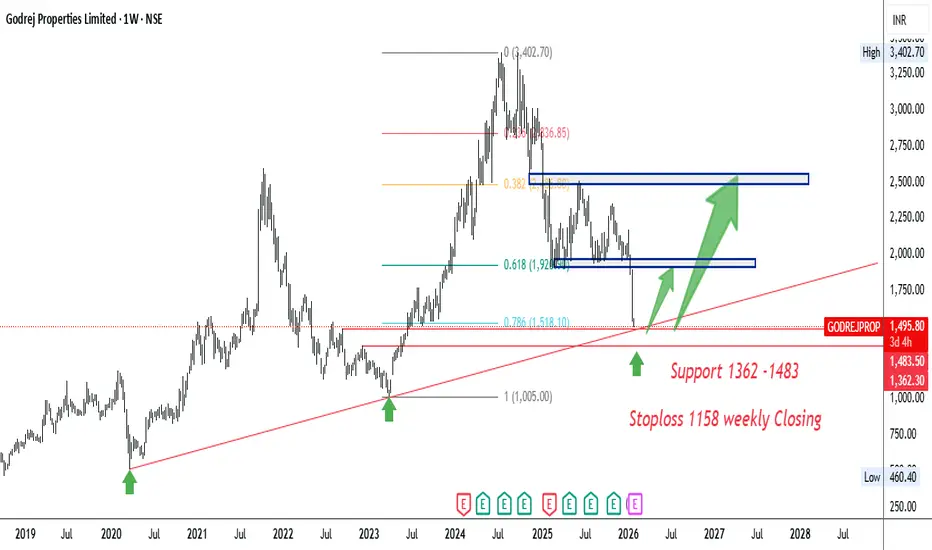
Positional Buy Godrej Properties.Buy Godrej Properties
Strong Retest Support of 1362-1483.
+
Trendline Support
+
Fibo 78.6 Support.
Stoploss 1158 weekly Closing.
Target should be 1900 and 2500