Trend detection zero lag Trend Detection Zero-Lag (v6)
Trend Detection Zero-Lag is a high-performance trend identification indicator designed for intraday traders, scalpers, and swing traders who require fast trend recognition with minimal lag. It combines a zero-lag Hull Moving Average, slope analysis, swing structure logic, and adaptive volatility sensitivity to deliver early yet stable trend signals.
This indicator is optimized for real-time decision-making, particularly in fast markets where traditional moving averages react too slowly.
Core Features
🔹 Zero-Lag Trend Engine
Uses a Zero-Lag Hull Moving Average (HMA) to reduce lag by approximately 40–60% versus standard moving averages.
Provides earlier trend shifts while maintaining smoothness.
🔹 Multi-Factor Trend Detection
Trend direction is determined using a hybrid engine:
HMA slope (momentum direction)
Rising / falling confirmation
Swing structure detection (HH/HL vs LH/LL)
ATR-adjusted dynamic sensitivity
This approach allows fast flips when conditions change, without excessive noise.
Adaptive Volatility Sensitivity
Sensitivity dynamically adjusts based on ATR relative to price
In high volatility: faster reaction
In low volatility: smoother, more stable trend state
This ensures the indicator adapts across:
Trend days
Range days
Volatility expansion or contraction
Trend Duration Intelligence
The indicator tracks historical trend durations and maintains a rolling memory of recent bullish and bearish phases.
From this, it calculates:
Current trend duration
Average historical duration for the active trend direction
This helps traders gauge:
Whether a trend is early, mature, or extended
Probability of continuation vs exhaustion
Strength Scoring
A normalized Trend Strength Score (0–100) is calculated using:
Zero-lag slope magnitude
ATR normalization
This provides a quick read on:
Weak / choppy trends
Healthy trend continuation
Overextended momentum
Visual Design
Color-coded Zero-Lag HMA
Bullish trend → user-defined bullish color
Bearish trend → user-defined bearish color
Designed for dark mode / neon-style charts
Clean overlay with no clutter
Trend Detection Zero-Lag is built for traders who need:
Faster trend recognition
Adaptive behavior across market regimes
Structural confirmation beyond simple moving averages
Clear, actionable visual signals
Trendpattern

The Abramelin Protocol [MPL]"Any sufficiently advanced technology is indistinguishable from magic." — Arthur C. Clarke
🌑 SYSTEM OVERVIEW
The Abramelin Protocol is not a standard technical indicator; it is a "Technomantic" trading algorithm engineered to bridge the gap between 15th-century esoteric mathematics and modern high-frequency markets.
This script is the flagship implementation of the MPL (Magic Programming Language) project—an open-source experimental framework designed to compile metaphysical intent into executable Python and Pine Script algorithms.
Unlike traditional indicators that rely on arbitrary constants (like the 14-period RSI or 200 SMA), this protocol calculates its parameters using "Dynamic Entity Gematria." We utilize a custom Python backend to analyze the ASCII vibrational frequencies of specific metaphysical archetypes, reducing them via Tesla's 3-6-9 harmonic principles to derive market-responsive periods.
🧬 WHAT IS ?
MPL (Magic Programming Language) is a domain-specific language and research initiative created to explore Technomancy—the art of treating code as a spellbook and the market as a chaotic entity to be tamed.
By integrating the logic of ancient Grimoires (such as The Book of Abramelin) with modern Data Science, MPL aims to discover hidden correlations in price action that standard tools overlook.
🔗 CONNECT WITH THE PROJECT:
If you are a developer, a trader, or a seeker of hidden knowledge, examine the source code and join the order:
• 📂 Official Project Site: hakanovski.github.io
• 🐍 MPL Source Code (GitHub): github.com
• 👨💻 Developer Profile (LinkedIn): www.linkedin.com
🔢 THE ALGORITHM: 452 - 204 - 50
The inputs for this script are mathematically derived signatures of the intelligence governing the system:
1. THE PAIMON TREND (Gravity)
• Origin: Derived from the ASCII summation of the archetype PAIMON (King of Secret Knowledge).
• Function: This 452-period Baseline acts as the market's "Event Horizon." It represents the deep, structural direction of the asset.
• Price > Line: Bullish Domain.
• Price < Line: Bearish Void.
2. THE ASTAROTH SIGNAL (Trigger)
• Origin: Derived from the ASCII summation of ASTAROTH (Knower of Past & Future), reduced by Tesla’s 3rd Harmonic.
• Function: This is the active trigger line. It replaces standard moving averages with a precise, gematria-aligned trajectory.
3. THE VOLATILITY MATRIX (Scalp)
• Origin: Based on the 9th Harmonic reduction.
• Function: Creates a "Cloud" around the signal line to visualize market noise.
🛡️ THE MILON GATE (Matrix Filter)
Unique to this script is the "MILON Gate" toggle found in the settings.
• ☑️ Active (Default): The algorithm applies the logic of the MILON Magic Square. Signals are ONLY generated if Volume and Volatility align with the geometric structure of the move. This filters out ~80% of false signals (noise).
• ⬜ Inactive: The algorithm operates in "Raw Mode," showing every mathematical crossover without the volume filter.
⚠️ OPERATIONAL USAGE
• Timeframe: Optimized for 4H (The Builder) and Daily (The Architect) charts.
• Strategy: Use the Black/Grey Line (452) as your directional bias. Take entries only when the "EXECUTE" (Long) or "PURGE" (Short) sigils appear.
Use this tool wisely. Risk responsibly. Let the harmonics guide your entries.
— Hakan Yorganci
Technomancer & Full Stack Developer

Buy Sell Strategy By Sultan Of Multan (Breakout/Retest)This is a comprehensive, all-in-one trading system designed for Forex, Crypto, and Stocks. It combines Smart Money Concepts (SMC), Trend Following, and Volatility Analysis into a single, easy-to-use toolkit.
Whether you are a scalper or a day trader, this indicator adapts to your style by allowing you to switch between Aggressive Breakouts and Conservative Retests.
🔥 Key Features:
1. Dual Entry Modes (New Update)
Breakout Mode: Get instant signals when price breaks market structure with momentum (BOS/CHoCH).
Retest Mode: The script waits for price to break and then pull back to the broken level before signaling. This reduces fake-outs and improves entry precision.
2. Smart Money Concepts (SMC)
Auto Fractals & Structure: Automatically detects BOS (Break of Structure) and CHoCH (Change of Character).
Fair Value Gaps (FVG): Detects 3-bar imbalances and alerts on midline taps.
Order Blocks (OB): Highlights valid bullish and bearish order blocks with trend alignment.
3. Trend & Bias Filters
EMA Stack & VWAP: Signals are only generated when the trend is aligned (Price > EMA200 & VWAP).
Multi-Timeframe Analysis: Optional HTF filter to ensure you are trading with the higher trend.
4. Advanced Confidence System
Score HUD: A smart panel that rates every signal (0-100) based on Volume (OBV), RSI, Liquidity, and Trend strength.
Volume Analysis: Integrated OBV slope and RVOL (Relative Volume) filters to confirm valid moves.
5. Complete Trade Management
ATR-Based TP/SL: Automatically calculates Stop Loss and Take Profit levels based on market volatility.
Unified Alerts: Get a single alert that includes Entry, SL, TP1, TP2, and Trade Analysis (Risk/Reward, Context) for easy automation.
Safe/Risky Panel: A dashboard that tells you if the last signal was "Safe" (high confidence) or "Risky".
🛠 How to Use:
Select Entry Method: Go to settings and choose "Breakout" for fast entries or "Retest" for safer entries.
Check the HUD: Look at the bottom center/right panels. Only take trades when the Score is Green/High and Volume is supportive.
Follow the Trend: The background color and VWAP line indicate the current market bias. Trade in the direction of the trend.
Disclaimer:
This tool is designed to assist your analysis, not to replace it. Always manage your risk and test on a demo account first.

Range Strategy (kasatura84)Winning Range Strategy (Set Heikin Ashi Candles)
Incredible winning strategy. You have to set Heikin Ashi Candles to activate strategy! It works both long and short trades.

Trend Vector Pro v2.0Trend Vector Pro v2.0
👨💻 Developed by: Mohammed Bedaiwi
💡 Strategy Overview & Coherence
Trend Vector Pro (TVPro) is a momentum-based trend & reversal strategy that uses a custom smoothed oscillator, an optional ADX filter, and classic Pivot Points to create a single, coherent trading framework.
Instead of stacking random indicators, TVPro is built around these integrated components:
A custom momentum engine (signal generation)
An optional ADX filter (trend quality control)
Daily Pivot Points (context, targets & S/R)
Swing-based “Golden Bar” trailing stops (trade management)
Optional extended bar detection (overextension alerts)
All parts are designed to work together and are documented below to address originality & usefulness requirements.
🔍 Core Components & Justification
1. Custom Momentum Engine (Main Signal Source)
TVPro’s engine is a custom oscillator derived from the bar midpoint ( hl2 ), similar in spirit to the Awesome Oscillator but adapted and fully integrated into the strategy. It measures velocity and acceleration of price, letting the script distinguish between strong impulses, weakening trends, and pure noise.
2. ADX Filter (Trend Strength Validation – Optional)
Uses Average Directional Index (ADX) as a gatekeeper.
Why this matters: This prevents the strategy from firing signals in choppy, non-trending environments (when ADX is below the threshold) and keeps trades focused on periods of clear directional strength.
3. Classic Pivot Points (Context & Targets)
Calculates Daily Pivot Points ( PP, R1-R3, S1-S3 ) via request.security() using prior session data.
Why this matters: Momentum gives the signal, ADX validates the environment, and Pivots add external structure for risk and target planning. This is a designed interaction, not a random mashup.
🧭 Trend State Logic (5-State Bar Coloring)
The strategy uses the momentum's value + slope to define five states, turning the chart into a visual momentum map:
🟢 STRONG BULL (Bright Green): Momentum accelerating UP. → Strong upside impulse.
🌲 WEAK BULL (Dark Green): Momentum decelerating DOWN (while positive). → Pullback/pause zone.
🔴 STRONG BEAR (Bright Red): Momentum accelerating DOWN. → Strong downside impulse.
🍷 WEAK BEAR (Dark Red): Momentum decelerating UP (while negative). → Rally/short-covering zone.
🔵 NEUTRAL / CHOP (Cyan): Momentum is near zero (based on noise threshold). → Consolidation / low volatility.
🎯 Signal Logic Modes
TVPro provides two selectable entry styles, controlled by input:
Reversals Only (Cleaner Mode – Default): Targets trend flips. Entry triggers when the current state is Bullish (or Bearish) and the previous state was not. This reduces noise and over-trading.
All Strong Pulses (Aggressive Mode): Targets acceleration phases. Entry triggers when the bar turns to STRONG BULL or STRONG BEAR after any other state. This mode produces more trades.
📌 Risk Management Tools
🟡 Golden Bars – Trailing Stops: Yellow “Trail” Arrows mark confirmed Swing Highs/Lows. These are used as logical trailing stop levels based on market structure.
Extended Bars: Detects when price closes outside a 2-standard-deviation channel, flagging overextension where a pullback is more likely.
Pivot Points: Used as external targets for Take Profit and structural stop placement.
⚙️ Strategy Defaults (Crucial for Publication Compliance)
To keep backtest results realistic and in line with House Rules, TVPro is published with the following fixed default settings:
Order Size: 5% of equity per trade ( default_qty_value = 5 )
Commission: 0.04% per order ( commission_value = 0.04 )
Slippage: 2 ticks ( slippage = 2 )
Initial Capital: 10,000
📘 How to Trade with Trend Vector Pro
Entry: Take Long when a Long signal appears and confirm the bar is Green (Bull state). Short for Red (Bear state).
Stop Loss: Place the initial SL near the latest swing High/Low, or near a relevant Pivot level.
Trade Management: Follow Golden (Trail) Arrows to trail your stop behind structure.
Exits: Exit when: the trailing stop is hit, Price reaches a major Pivot level, or an opposite signal prints.
🛑 Disclaimer
This script is for educational purposes only and does not constitute financial advice. Past performance does not guarantee future results. Always forward-test and use proper risk management before applying any strategy to live trading.

Kinetic EMA & Volume with State EngineKinetic EMA & Volume with State Engine (EMVOL)
1. Introduction & Concept
The EMVOL indicator converts a dense family of EMA signals and volume flows into a compact “state engine”. Instead of looking at individual EMA lines or simple crossovers, the script treats each EMA as part of a kinetic vector field and classifies the market into interpretable states:
- Trend direction and strength (from a grid of prime‑period EMAs).
- Volume regime (expansion, contraction, climax, dry‑up).
- Order‑flow bias via delta (buy versus sell volume).
- A combined scenario label that summarises how these three layers interact.
The goal is educational: to help traders see that moving averages and volume become more meaningful when observed as a structure, not as isolated lines. EMVOL is therefore designed as a real‑time teaching tool, not as an automatic signal generator.
2. Volume Settings
Group: “Volume Settings”
A. Calculation Method
- Geometry (Source File) – Default mode.
Buy and sell volume are estimated from each candle’s geometry: the close is compared to the high/low range and the bar’s total volume is split proportionally between buyers and sellers. This approximation works on any TradingView plan and does not require lower‑timeframe data.
- Intrabar (Precise) – Reconstructs buy/sell volume using a lower timeframe via requestUpAndDownVolume(). The script asks TradingView for historical intrabar data (e.g., 15‑second bars) and builds buy/sell volume and delta from that stream. This mode can produce a more accurate view of order flow, but coverage is limited by your account’s history limits and the symbol’s available lower‑timeframe data.
B. Intrabar Resolution (If Precise)
- Intrabar Resolution (If Precise) – Selected only when the calculation method is “Intrabar (Precise)”. It defines which lower timeframe (for example 15S, 30S, 1m) is used to compute up/down volume. Smaller intrabar timeframes may give smoother and more granular deltas, but require more historical depth from the platform.
When “Intrabar (Precise)” is active, the dashboard’s extended section shows the resolution and the number of bars for which precise volume has been successfully retrieved, in the format:
- Mode: Intrabar (15S) – where N is the count of bars with valid high‑resolution volume data.
In Geometry mode this counter simply reflects the processed bars in the current session.
3. Kinetic Vector Settings
Group: “Kinetic Vector”
A. Vector Window
- Vector Window – Controls the temporal smoothing applied to the aggregated vectors (trend, volume, delta, etc.). Internally, each bar’s vector value is averaged with a simple moving window of this length.
- Shorter windows make the state engine more reactive and sensitive to local swings.
- Longer windows make the states more stable and better suited to higher‑timeframe structure.
B. Max Prime Period
- Max Prime Period – Sets the largest prime number used in the EMA grid. The engine builds a family of EMAs on prime lengths (2, 3, 5, 7, …) up to this limit and converts their slopes into angles.
- A higher limit increases the number of long‑horizon EMAs in the grid and makes the vectors sensitive to broader structure.
- A lower limit focuses the analysis on short- and medium‑term behaviour.
C. Price Source
- Price Source – The price series from which the kinetic EMA grid is built (e.g., Close, HLC3, OHLC4). Changing the source modifies the context that the state engine is reading but does not change the core logic.
4. State Engine Settings
Group: “State Engine Settings”
These inputs define how the continuous vectors are translated into discrete states.
A. Trend Thresholds
- Strong Trend Threshold – Value above which the trend vector is treated as “extreme bullish” and below which it is “extreme bearish”.
- Weak Trend Threshold – Inner boundary between neutral and directional conditions.
Roughly:
- |trend| < weak → Neutral trend state.
- weak < |trend| ≤ strong → Bullish/Bearish.
- |trend| > strong → Extreme Bullish/Extreme Bearish.
B. Volume Thresholds
- Volume Climax Threshold – Upper bound at which volume is considered “climax” (unusually expanded participation).
- Volume Expansion Threshold – Boundary for normal expansion versus contraction.
Conceptually:
- Volume above “expansion” indicates increasing activity.
- Volume near or above “climax” marks extreme participation.
- Negative values below the symmetric thresholds map to contraction and extreme dry‑up (liquidity vacuum) states.
C. Delta Thresholds
- Strong Delta Threshold – Cut‑off for extreme buying or selling dominance in delta.
- Weak Delta Threshold – Threshold for mild buy/sell bias versus neutral order flow.
Combined with the sign of the delta vector, these thresholds classify order flow as:
- Extreme Buy, Buy‑Dominant, Neutral, Sell‑Dominant, Extreme Sell.
D. State Hysteresis Bars
- State Hysteresis Bars – Minimum number of bars for which a new state must persist before the engine commits to the change. This prevents the dashboard from flickering during fast spikes and emphasises persistent market behaviour.
- Smaller values switch states quickly; larger values demand more confirmation.
5. Visual Interface
Group: “Visual Interface”
A. Ribbon Base Color
- Ribbon Base Color – Base hue for the multi‑layer EMA ribbon drawn around price. The script plots a dense grid of hidden EMAs and fills the gaps between them to form a semi‑transparent band. Narrow, overlapping bands hint at compression; wider separation hints at dispersion across EMA horizons.
B. Show Dashboard
- Show Dashboard – Toggles the on‑chart table which summarises the current state engine output. Disable this if you only want to keep the EMA ribbon and volume‑based structure on the price chart.
C. Color Theme
- Color Theme – Switch between a dark and light style for the dashboard background and text colours so that the table matches your chart theme.
D. Table Position
- Table Position – Places the dashboard at any corner or edge of the chart (Top / Middle / Bottom × Left / Centre / Right).
E. Table Size
- Table Size – Changes the dashboard’s text size (Tiny, Small, Normal, Large). Use a larger size on high‑resolution screens or when streaming.
F. Show Extended Info
- Show Extended Info – Adds diagnostic rows under the main state summary:
- Mode / Primes / Vector – Shows the current calculation mode (Geometry / Intrabar), the selected intrabar resolution and coverage in bars ( ), how many prime periods are active, and the vector window.
- Values – Displays the current aggregated vectors:
- P: price vector
- V: volume vector
- B: buy‑volume vector
- S: sell‑volume vector
- D: delta vector
Values are bounded between ‑1 and +1.
- Volume Stats – Prints the last bar’s raw buy volume, sell volume and delta as formatted numbers.
- Footer – A final row with the symbol and current time: #SYMBOL | HH:MM.
These extended rows are meant for inspecting how the engine is behaving under the hood while you scroll the chart and compare different assets or timeframes.
6. Language Settings
Group: “Language Settings”
- Select Language – Switches the entire dashboard between English and Turkish.
The underlying calculations and scenario logic are identical; only the labels, titles and comments in the table are translated.
7. Dashboard Structure & Reading Guide
The table summarises the current situation in a few rows:
1. System Header – Shows the script name and the active calculation method (“Geometry” or “Intrabar”).
2. Scenario Title – High‑level description of the current combined scenario (e.g., “Trending Buy Confirmed”, “Sideways Balanced”, “Bull Trap”, “Blow‑Off Top”). The background colour is derived from the scenario family (trending, compression, exhaustion, anomaly, etc.).
3. Bias / Trend Line – States the dominant trend bias derived from the trend vector (Extreme Bullish, Bullish, Neutral, Bearish, Extreme Bearish).
4. Signal / Consideration Line – A short sentence giving qualitative guidance about the current state (for example: continuation risk, exhaustion risk, trap‑like behaviour, or compression). This is deliberately phrased as a consideration, not as a direct trading signal.
5. Trend / Volume / Delta Rows – Three separate rows explain, in plain language, how the trend, volume regime and delta are classified at this bar.
6. Extended Info (optional) – Mode / primes / vector settings, current vector values, and last‑bar volume statistics, as described above.
Together, these rows are meant to be read as a narrative of what price, volume and order‑flow are doing, not as mechanical instructions.
8. State Taxonomy
The state engine organizes market behaviour in three stages.
8.1 Trend States (from the Price Vector)
- Extreme Bullish Trend – The prime‑grid price vector is strongly upward; most EMAs are aligned to the upside.
- Bullish Trend – Upward bias is present, but less extreme.
- Neutral Trend – EMAs are mixed or flat; price is effectively sideways relative to the grid.
- Bearish Trend – Downward bias, with the EMA grid sloping down.
- Extreme Bearish Trend – Strong downside alignment across the grid.
8.2 Volume Regime States (from the Volume Vector)
- Volume Climax (Buy‑Side) – Strong positive volume vector; participation is unusually high in the current direction.
- Volume Expansion – Activity above normal but below the climax threshold.
- Neutral Volume – No major expansion or contraction versus recent history.
- Volume Contraction – Activity is drying up compared with the past.
- Extreme Dry‑Up / Liquidity Vacuum – Very low participation; the market is thin and prone to slippage.
8.3 Delta Behaviour States (from the Delta Vector)
- Extreme Buy Delta – Buying pressure dominates strongly.
- Buy‑Dominant Delta – Buy volume exceeds sell volume, but not at an extreme.
- Neutral Delta – Buy and sell flows are roughly balanced.
- Sell‑Dominant Delta – Selling pressure dominates.
- Extreme Sell Delta – Aggressive, one‑sided selling.
8.4 Combined Scenario State s
EMVOL uses the three base states above to generate a single scenario label. These scenarios are designed to be read as context, not as entry or exit signals.
Trending Scenarios
1. Trending Buy Confirmed
- Bullish or extreme bullish trend, supported by expanding or climax volume and buy‑side delta.
- Educational idea: a healthy uptrend where both participation and order flow agree with the direction.
2. Trending Buy – Weak Volume
- Bullish trend, but volume is neutral, contracting or in dry‑up while delta is still buy‑side.
- Educational idea: price is advancing, yet participation is thinning; trend continuation becomes more fragile.
3. Trending Sell Confirmed
- Bearish or extreme bearish trend, with expanding or climax volume and sell‑side delta.
- Educational idea: strong downtrend with both volume and order‑flow confirmation.
4. Trending Sell – Weak Volume
- Bearish trend, but volume is neutral, contracting or very low while delta remains sell‑side.
- Educational idea: downside continues but with limited participation; vulnerable to short‑covering.
Sideways / Range Scenarios
5. Sideways Balanced
- Neutral trend, neutral delta, neutral volume.
- Classic range environment; low directional edge, suitable for observation and context rather than trend trading.
6. Sideways with Buy Pressure
- Neutral trend, but buy‑side delta is dominant or extreme.
- Range with latent accumulation: price may still appear sideways, but buyers are quietly more active.
7. Sideways with Sell Pressure
- Neutral trend with dominant or extreme sell‑side delta.
- Distribution‑like environment where price chops while sellers are gradually more aggressive.
Exhaustion & Volume Extremes
8. Exhaustion – Buy Risk
- Extreme bullish trend, volume climax and strong buy‑side delta.
- Educational idea: very strong up‑move where both participation and delta are already stretched; risk of exhaustion or blow‑off.
9. Exhaustion – Sell Risk
- Extreme bearish trend, volume dry‑up and strong sell‑side delta.
- Suggests one‑sided selling into increasingly thin liquidity.
10. Volume Climax (Buy)
- Neutral trend, neutral delta, but volume at climax levels.
- Often associated with a “big event” bar where participation spikes without a clear directional commitment.
11. Volume Climax (Sell / Dry‑Up)
- Neutral trend and neutral delta, while the volume vector indicates an extreme dry‑up.
- Highlights a stand‑still episode: very limited interest from both sides, increasing the sensitivity to future impulses.
Divergences
12. Divergence – Bullish Context
- Bullish or extreme bullish trend, but delta has faded back to neutral.
- Price trend continues while order‑flow conviction softens; can precede pauses or complex corrections.
13. Divergence – Bearish Context
- Bearish or extreme bearish trend with a neutral delta.
- Downtrend persists, but selling pressure no longer dominates as clearly.
Consolidation & Compression
14. Consolidation
- Default state when no specific pattern dominates and the market is broadly balanced.
- Educational use: treat this as a “no strong edge” label; focus on structure rather than direction.
15. Breakout Imminent
- Neutral trend with contracting volume.
- Compression phase where energy is building up; often precedes transitions into trending or shock scenarios.
Traps & Hidden Divergences
16. Bull Trap
- Bullish trend, with neutral or contracting volume and sell‑side delta.
- Price appears strong, but order‑flow shifts against it; often seen near fake breakouts or failing rallies.
17. Bear Trap
- Bearish trend, neutral or contracting volume, but buy‑side delta.
- Downtrend “looks” intact, while buyers become more aggressive underneath the surface.
18. Hidden Bullish Divergence
- Bullish trend, contracting volume, but strong buy‑side delta.
- Educational idea: price dips or slows while aggressive buyers step in, often inside an ongoing uptrend.
19. Hidden Bearish Divergence
- Bearish trend, volume expansion and strong sell‑side delta.
- Reinforced downside pressure even if price is temporarily retracing.
Reversal & Transition Patterns
20. Reversal to Bearish
- Neutral trend, volume climax and strong sell‑side delta.
- Suggests that heavy selling appears at the top of a move, turning a previously neutral or rising context into potential downside.
21. Reversal to Bullish
- Neutral trend, extreme volume dry‑up and strong buy‑side delta.
- Often associated with selling exhaustion where buyers start to take control.
22. Indecision Spike
- Neutral trend with extreme volume (climax or dry‑up) but neutral delta.
- Crowd participation changes sharply while order‑flow remains undecided; treat as an informational spike rather than a direction.
Extended Compression & Acceleration
23. Coiling Phase
- Neutral trend, contracting volume, and delta that is neutral or only mildly one‑sided.
- Extended compression where price, volume and delta all contract into a tightly coiled range, often preceding a strong move.
24. Bullish Acceleration
- Bullish trend with volume expansion and strong buy‑side delta.
- Uptrend not only continues but gains kinetic strength; educationally, this illustrates how trend, volume and delta align in the strongest phases of a move.
25. Bearish Acceleration
- Bearish trend with volume expansion and strong sell‑side delta.
- Mirror image of Bullish Acceleration on the downside.
Trend Exhaustion & Climax Reversal
26. Bull Exhaustion
- Bullish or extreme bullish trend, with contraction or dry‑up in volume and buy‑side or neutral delta.
- The move has already travelled far; participation fades while price is still elevated.
27. Bear Exhaustion
- Bearish or extreme bearish trend, with volume climax or contraction and sell‑side or neutral delta.
- Down‑move may be approaching a point where additional selling pressure has diminishing impact.
28. Blow‑Off Top
- Extreme bullish trend, volume climax and extreme buy delta all at once.
- Classic blow‑off behaviour: price, volume and order‑flow are simultaneously stretched in the same direction.
29. Selling Climax Reversal
- Extreme bearish trend with extreme volume dry‑up and extreme sell‑side delta.
- Marks a very aggressive capitulation phase that can precede major rebounds.
Advanced VSA / Anomaly Scenarios
30. Absorption
- Typically neutral trend with expanding or climax volume and extreme delta (either buy or sell).
- Educational focus: large participants are aggressively absorbing liquidity from the opposite side, while price remains relatively contained.
31. Distribution
- Scenario where volume remains elevated while directional conviction weakens and the trend slows.
- Represents potential “selling into strength” or “buying into weakness”, depending on the active side.
32. Liquidity Vacuum
- Combination of thin liquidity (extreme dry‑up) with a directional trend or strong delta.
- Highlights environments where even small orders can move price disproportionately.
33. Anomaly / Shock Event
- Triggered when the vector z‑scores detect rare combinations of price, volume and delta behaviour that deviate from their own historical distribution.
- Intended as a warning label for unusual events rather than a specific tradeable pattern.
9. Educational Usage Notes
- EMVOL does not produce mechanical “buy” or “sell” commands. Instead, it classes each bar into an interpretable state so that traders can study how trends, volume and order‑flow interact over time.
- A common exercise is to overlay your usual EMA crossovers, support/resistance or price patterns and observe which EMVOL scenarios appear around entries, exits, traps and climaxes.
- Because the vectors are normalized (bounded between ‑1 and +1) and then discretized, the same conceptual states can be compared across different symbols and timeframes.
10. Disclaimer & Educational Purpose
This indicator is provided strictly as an educational and analytical tool. Its purpose is to help visualise how price, volume and order‑flow interact; it is not designed to function as a stand‑alone trading system.
Please note:
1. No Automated Strategy – The script does not implement a complete trading strategy. Scenario labels and dashboard messages are descriptive and should not be followed as unconditional entry or exit signals.
2. No Financial Advice – All information produced by this indicator is general market analysis. It must not be interpreted as investment, financial or trading advice, or as a recommendation to buy or sell any instrument.
3. Risk Warning – Trading and investing involve substantial risk, including the risk of loss. Always perform your own analysis, use appropriate position sizing and risk management, and consult a qualified professional if needed. You are solely responsible for any decisions made using this tool.
4. Data Precision & Platform Limits – The “Intrabar (Precise)” mode depends on the availability of high‑resolution historical data at the chosen intrabar timeframe. If your TradingView plan or the symbol’s history does not provide sufficient depth, this mode may only partially cover the visible chart. In such cases, consider switching to “Geometry (Source File)” for a fully populated view.

V-CORE SMA Matrix LiteV-CORE SMA Matrix Lite
A clean, lightweight 5-SMA structure tool built using Pine Script v6.
This open-source Lite edition provides a simple visual framework for identifying market structure using the most commonly used moving averages:
21 SMA
50 SMA
80 SMA
100 SMA
200 SMA
Each line is individually adjustable and colour-coded for easy trend reading.
No signals, no alerts, no automation — purely a visual tool for traders who prefer clarity over complexity.
This Lite version exposes only basic, non-proprietary logic.
Advanced regime systems, multi-stage confirmation models, and automation features are available only in the full V-CORE Engine suite.
Part of the V-CORE Lite Series
Free open-source tools designed for education, research, and clean charting.
Follow our work:
TradingView: VectorCoresAI
X (Twitter): vectorcoresai
Telegram: vectorcoresai

V-CORE Engine Free v1V-CORE Engine Free v1 — Public Release
This is a simplified trend-state visualiser from the V-CORE suite, designed for clean directional bias on crypto markets using 1H+ timeframes.
The engine runs fixed, non-editable internal logic with multi-stage trend confirmation.
No optimisation, no signals, no settings — just locked-in regime detection for educational and research use.
This free edition is a lightweight derivative of our internal V-CORE Engine architecture.
It includes only the essential background-state display while keeping all proprietary components sealed.
For additional V-CORE tools, future releases, or extended versions, please visit our TradingView profile.

V-CORE Engine Free v2V-CORE Engine Free v2 — Public Release
This is another release from the V-CORE suite, providing simplified market regime visualization based on proprietary trend-state processing.
No settings, no noise — just clean directional bias adapted for crypto markets on 1H+ timeframes.
This free version is intentionally minimal. It uses a reduced feature-set derived from our internal V-CORE Engine architecture.
For more details about V-CORE tools, future releases, or the full professional engine, please check our profile page.

ZynIQ Breakout Essentials + Risk v1Overview
ZynIQ Breakout Essentials + Risk v1 is a breakout-based tool designed for traders who want a clean, rules-driven framework for identifying consolidation zones, breakout levels, and structured stop/target planning. It highlights key areas where price may transition from compression into momentum.
Key Components
• Breakout Range Detection – Identifies consolidation zones using a configurable lookback window and optional candle-range filters.
• Breakout Levels – Plots upper/lower boundaries that define potential breakout points.
• Signal Spacing Filters – Helps reduce noisy or clustered breakout triggers.
• Risk Helper – Provides both %-based and ATR-based structure for stop loss and take profit planning.
Use Cases
• Spotting breakouts from tight ranges.
• Structuring consistent entries for intraday or swing setups.
• Planning stops and targets with volatility-adjusted levels.
Notes
This tool provides structure for assessing breakout conditions and planning trade levels. It is not a standalone trading system. Use alongside your own confirmation and risk management.

Volume–Phase Analyzer ProVolume–Phase Analyzer Pro – Trend & Institutional Volume Phases
This indicator analyzes how volume behaves relative to price movement to detect whether the market is in Accumulation, Markup, Distribution, or Markdown — the same phases institutions track in professional trading.
Unlike regular volume/MA mashups, this tool combines:
• Institutional volume classification (HighVol Up/Down, LowVol, Confused Vol)
• Price–volume efficiency and wick dominance
• Multi-Timeframe directional filters
• Volatility compression signals using Bollinger Width
• Volume mapped directly into the price chart as candles
• Smart signal engine with cooldown (prevents repeated signal spam)
This helps reveal w hen Smart Money is accumulating, pushing trends, unloading positions, or flushing liquidity.
────────────────────────────────────
How It Works
1️⃣ Volume Strength vs Average Volume
Identifies whether a move is backed by genuine buying/selling power.
2️⃣ Wick & Body Analysis
Confirms whether volume produced meaningful directional pressure — not just noise.
3️⃣ Trend Alignment
Fast EMA vs Slow EMA ensures signals align with active trend.
4️⃣ Higher-Timeframe Confirmation
Confirms if current movement agrees with a larger directional bias.
5️⃣ Compression Detection
When price volatility contracts while high-volume bars appear → phase shift often ahead.
────────────────────────────────────
Signals
BUY → Confirmed bullish demand with trend backing
SELL → Confirmed bearish supply taking control
TRAP → Likely stop-hunt or absorption — often before reversal
Signals only appear when multiple institutional conditions align.
A cooldown prevents repetitive signals like BUY-BUY-BUY.
────────────────────────────────────
Background shading helps visually locate these phases.
Markup phase:
• Meaning: Buyers are in control and the market is trending up
• Background color: Light green
Markdown phase:
• Meaning: Sellers are in control and the market is trending down
• Background color: Light red
Accumulation phase:
• Meaning: Smart Money quietly buying near the bottom before an uptrend
• Background color: Teal (blue-green)
Distribution phase:
• Meaning: Smart Money quietly selling near the top before a downtrend
• Background color: Light orange/yellow
Consolidation phase:
• Meaning: Sideways movement with low conviction
• Background color: Very light grey
Transition phase:
• Meaning: Market has not picked a direction yet
• Background color: No shading (clear background)
⸻
Quick Usage Notes
• Best trades are Buy signals during Markup and Sell signals during Markdown
• Accumulation and Distribution often come before reversals
• Consolidation is a low-quality trading zone
────────────────────────────────────
How to Trade It
• Take BUY signals during Markup
• Take SELL signals during Markdown
• Expect reversals near Trap signals, especially when phase is changing
• Avoid over-trading Consolidation zones
• Volume candles below price reveal when momentum is increasing or fading
Best applied on 5m–1H for intraday and swing confirmation.
────────────────────────────────────
Why This Indicator Is Unique
• It uses p rice-volume efficiency , not standard lagging signals
• It detects S mart Money intent , not retail reactions
• It avoids spam signals using an internal cooldown logic
• It gives context, not just entries — via live market-phase analysis
This makes it a multi-purpose tool for trend trading, breakout trading, and reversal anticipation.
────────────────────────────────────
Alerts Included
• Buy/Sell/Trap Signals
• Phase Change Alerts
────────────────────────────────────
This is a free tool and meant for educational use only.
Always use proper risk management.
────────────────────────────────────

Trendviewer_Auctheo.Trendviewer 240 is built for traders who want clearer structure and fewer false starts. It reads higher-timeframe trend strength and turns it into a simple visual map on your active chart. You get precise directional bias, dynamic stop zones that adapt to current volatility, and optional filters that help you stay aligned with momentum instead of fighting it.
The script highlights areas where the trend is shifting, shows you when conditions are supportive for entries, and manages exits using a mix of adaptive levels and tiered targets. Everything is designed to keep your decision-making clean without cluttering the chart or revealing unnecessary details.
If you trade with the higher timeframe in mind but want the execution on the lower timeframe to feel controlled and confident, this tool will fit right in.
Please for free to contact us @theauctiontheorist@gmail.com

ORB Pro SuiteOverview
ORB Pro with Filters + Debug Overlay is an advanced Opening Range Breakout indicator designed for precision intraday trading. It defines a configurable ORB window, automatically builds the breakout range, and triggers long or short signals only when all active filters align. The script also includes a built-in debug overlay that explains why each breakout is accepted or blocked, allowing traders to fine-tune entries with transparency.
What Makes It Unique
• Modular filter stack – close-confirmation vs. instant breaks, retest confirmation with adjustable tolerance %, volume-spike and EMA-trend filters, ORB-size range, session cutoff, and cooldown logic.
• Non-blocking debug overlay – inline or corner display of the exact rejection reason (“Too late,” “Low volume,” “Trend mismatch,” etc.).
• Fully customizable visuals – choose shaded, outline, or line-only ORB styles; set opacity, border color, and right-edge offset so the box never hides current candles.
• Integrated reversal engine – detects doji, hammer, and engulfing structures within a time-filtered window and optional VWAP/EMA confluence.
How It Works
During the defined opening window (default 9:30 – 9:45 NY), the indicator records the session high and low.
After the box closes, it looks for breakouts confirmed by candle close or retest (per user settings).
Each signal passes through range, volume, trend, time-delay, and session filters before printing.
Visual stop-loss / take-profit levels appear for reference using either R:R multiples or fixed %.
The optional reversal layer marks short-term exhaustion zones for counter-scalp setups.
Usage Guidelines
• Apply to standard candlestick charts (not Heikin Ashi, Renko, or Range).
• Select your local ORB start / end time, then enable or disable filters based on your playbook.
• Use the “Outline only” or “Corner table” debug modes for a cleaner chart.
• The script provides visual and alert-based confirmations only; it does not execute orders or backtest performance.
Inputs at a Glance
– ORB window (start/end time)
– Close-confirm toggle
– Retest tolerance %
– Volume SMA length
– EMA length for trend filter
– Min/Max range % filter
– Cooldown bars and session cutoff
– Visual R:R ratio or fixed SL/TP %
– Box style, opacity, border width / color
– Debug overlay mode (inline or table) and leader lines
Notes & Disclaimers
• This script is for analysis and educational purposes only. It does not constitute financial advice or guarantee performance.
• Signals are calculated on completed bars without lookahead.
• Invite-only access ensures version integrity and controlled distribution.
© Trades with B – Original development in Pine v6. Reuse of this code requires explicit permission from the author.

TrendRebel.pro SMA 🆓Welcome to Trend Rebel!
This 🆓 Indicator will help guide you through boundaries across multiple timeframes.
Seamlessly watch your 4 Hour or any other timeframe while being able to plot aand or just view other important SMA's.
Add this with a FREE subscription to Trend Rebels Bootcamp and you can master the boundaries that SMA"s provide giving you an edge.
SMA's provide you with the boundaries that define how technicals move, while they are based on previous candles, future candles respect them with patterns and institutions use them to guide their trading as well. This of it as a cheat sheet to awareness of whats to come.
This Free version is somewhat limited, so make sure you get a free trial to trend rebel and explore the many Indicators we use to navigate the market with precision.
For instance our Pivot Indicator which is based on charting techniques that Trading View cannot duplicate, therefore we manually update our Pivots DAILY and deliver them to your screen!
For a Paid Subscription to TrendRebel copy paste this link to your browser:
whop.com
For a FREE subscription to Bootcamp copy paste this link to your browser:
whop.com
For more information go to:
www.trendrebel.pro

✅ Heikin Ashi Trend Reversal Confirmedusing the heikin ashi trend candles, this indicator can attempt to give buy and sell signals

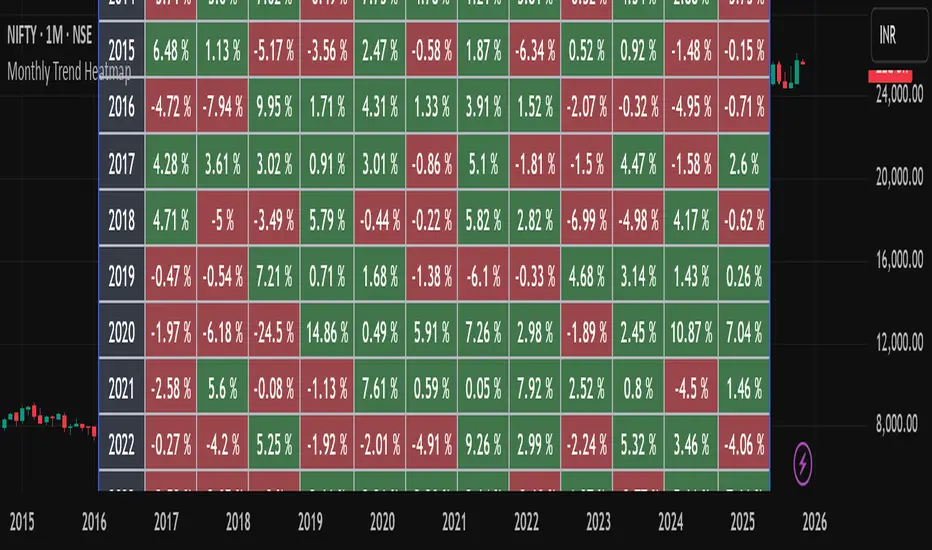
Monthly Trend Heatmap – Price Change by MonthThis indicator analyzes multi-year monthly price seasonality and displays it as a clear table of percentage returns for each month, from 2013 to the current year. By calculating the monthly open-to-close percentage change, it helps traders quickly identify recurring seasonal trends, positive or negative months, and long-term behavioral patterns of the selected market.
The goal of this tool is to make seasonal analysis accessible to everyday traders by presenting the data visually in a simple, structured, and easy-to-interpret format.
How It Works
The script must be used on a 1-Month chart.
For each month and each year, the indicator calculates:
Monthly return = (Monthly Close – Monthly Open) / Monthly Open × 100
The result is plotted inside a table, with green for positive months and red for negative months.
Data auto-updates as new monthly candles form.
This tool is not a signal generator and does not tell you when to buy or sell. It is a statistical seasonality visualizer meant to enhance decision-making.
The information provided is for educational and informational purposes only and should not be interpreted as financial, investment, or trading advice. Trading and investing in the stock market involve a high level of risk, including the potential loss of capital. Past performance does not guarantee future results, and no strategy or analysis can assure profits or prevent losses.
All examples, charts, scripts, indicators, or market discussions are strictly for demonstration, learning, and analytical purposes. No warranties or guarantees are made regarding accuracy, completeness, or future performance.
Trend Entry_0 [TS_Indie]Trend Entry_0 — Mechanism Overview
The core structure of this strategy is based on a price action reversal pattern, as detailed below:
In the case of a Bullish Trend Reversal:
The price initially moves in a bearish direction. When candle A forms a low lower than the previous low, the high of candle A becomes a key reference point.
If the next candle closes above the high of candle A , it confirms a Bullish Trend Reversal.
* Upon a Bullish signal, a Long position is opened at the opening price of the next candle (candle B).
* When a subsequent Bearish signal occurs, the Long position is closed at the opening price of the next candle (candle C).
In the case of a Bearish Trend Reversal:
The price initially moves in a bullish direction. When candle A forms a high higher than the previous high, the low of candle A becomes a key reference point.
If the next candle closes below the low of candle A , it confirms a Bearish Trend Reversal.
* Upon a Bearish signal, a Short position is opened at the opening price of the next candle (candle B).
* When a subsequent Bullish signal occurs, the Short position is closed at the opening price of the next candle (candle C).
Options
* The start and end dates of the backtest can be customized.
* The swing lines of the trend can be displayed as an optional visual aid.
* The user can choose whether to open only Long or Short positions.
Backtest Results and Observations
Based on the backtesting results of this strategy across various assets and timeframes, it has been observed that this approach works best on trending assets such as Gold, BTC, and stocks.
It also performs well on higher timeframes, starting from the Daily timeframe and above, especially when taking Long positions only.
However, when applied to currency pairs such as EUR/USD, the results tend to be less impressive.
I encourage everyone to try backtesting and further developing this strategy — adding new conditions or filters may potentially lead to improved performance.
Disclaimer
This script is intended solely for backtesting purposes, based on a particular price action pattern.
It does not constitute financial or investment advice.
Backtest results do not guarantee future performance.

OG Trend MasterOG Trend Master
Smart trend-tracking indicator designed to identify opportunities using Supertrend + EMA confirmation logic.
It automatically adapts to market volatility and structure:
✅ Supertrend core to detect directional bias
⚡ Dual EMA cross for confirmation and precision
🎯 Visual arrows + diamonds for instant clarity on entries
🔔 Real-time alerts for both LONG and SHORT confirmations
Built for traders who value simplicity, accuracy, and flow.
From scalpers to swing traders OG Trend Master delivers smooth trend identification across all timeframes.

#1 Vishal Toora Buy/Sell Table#1 Vishal Toora Buy/Sell Table
A multi-range volume analysis tool that tracks Short, Medium, and Long-term volume activity directly from recent candles.
It calculates Buy and Sell volumes for each range, shows their Delta (difference), and generates a combined Signal (Buy / Sell / Neutral) based on all active ranges.
Each column and the Signal row can be switched ON/OFF for custom clarity.
🧠 What the Numbers Represent (Candle Connection)
Each number represents total volume from a group of candles:
The script looks back a certain number of candles in each range (e.g., 2–3 candles for Short, 10–20 for Medium, 50–100 for Long).
It measures how much volume occurred on bullish candles (Buy) vs bearish candles (Sell).
Buy Volume (Green Numbers):
Volume from candles where price closed higher than it opened → bullish pressure.
Sell Volume (Red Numbers):
Volume from candles where price closed lower than it opened → bearish pressure.
Delta (White or Yellow Numbers):
The difference between Buy and Sell volumes within that range.
Positive → More bullish volume.
Negative → More bearish volume.
Larger absolute values = stronger imbalance between buyers and sellers.
Signal Row:
Summarizes all ranges’ deltas:
🟢 Buy → majority of ranges show positive delta.
🔴 Sell → majority show negative delta.
⚪ Neutral → roughly balanced or mixed candle behavior.
🎯 In Simple Terms
Each number in the table is a summary of what recent candles did —
it converts multiple candles’ volume data into clean, readable signals,
so you instantly see who’s in control (buyers or sellers) across short, medium, and long perspectives.
© 2025 Vishal Toora — counting volumes so you don’t have to.
Buy or Sell... or just stare at the screen.
Making deltas speak louder than your ex. 💀
Disclaimer:
This indicator is for educational and informational purposes only.
It does not guarantee accuracy or performance.
You are solely responsible for your trading decisions.

Swing High/Low (Adaptive)Swing High/Low (Adaptive)
Overview
The Indicator is a pivot point detection tool that identifies swing highs and lows with invalidation tracking. The key differentiator of this indicator is its adaptive invalidation system . Most pivot indicators simply mark every detected pivot without considering whether subsequent price action has made earlier pivots less relevant.
How It Works
The indicator uses Pine Script's native ta.pivotlow() and ta.pivothigh() functions combined with custom logic to detect swing points. The adaptive algorithm evaluates each potential pivot against the following criteria:
For Low Pivots:
Confirms a new low pivot when it's the next expected pivot type in the swing sequence
If consecutive lows occur, only accepts a new low if it's lower than the previous low
Marks the previous low as invalidated when a stronger low is detected
For High Pivots:
Confirms a new high pivot when it's the next expected pivot type in the swing sequence
If consecutive highs occur, only accepts a new high if it's higher than the previous high
Marks the previous high as invalidated when a stronger high is detected
This approach ensures that the indicator maintains clean swing structure and automatically adjusts when price action creates stronger pivots, providing a more realistic view of support and resistance levels.
Settings
Pivot Settings:
Left Bars : Number of bars to the left required for pivot confirmation (default: 5)
Right Bars : Number of bars to the right required for pivot confirmation (default: 5)
Pivot Display Settings:
Toggle visibility for low and high pivots independently
Customizable colors for valid pivot markers
Low pivots marked with upward triangle (▲)
High pivots marked with downward triangle (▼)
Invalid Pivot Settings:
Optional display of invalidated pivots
Separate color customization for invalid low and high pivots
Helps visualize where market structure expectations changed
ZigZag Settings:
Toggle ZigZag line display on/off
Separate colors for upward and downward price swings
Adjustable line width
Use Cases
1. Market Structure Analysis
Identify key swing points to understand the current market structure and trend direction. The adaptive invalidation feature ensures you're always looking at the most relevant pivots.
2. Support and Resistance Identification
Use confirmed swing highs and lows as potential support and resistance levels for entry and exit planning.
3. Trend Confirmation
The ZigZag visualization helps confirm trends by showing the sequence of higher highs and higher lows (uptrend) or lower highs and lower lows (downtrend).
Disclaimer
This indicator is designed as a technical analysis tool and should be used in conjunction with other forms of analysis and proper risk management. Past performance does not guarantee future results, and traders should thoroughly test any strategy before implementing it with real capital.

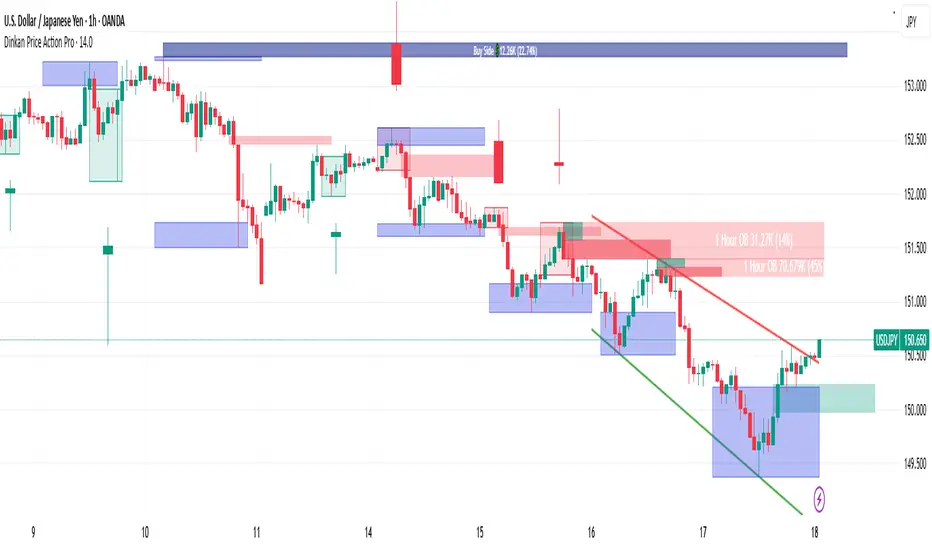
Dinkan Price Action Pro | Pure Price Action Toolkit🔸 Overview
Dinkan Price Action Pro is a pure price-action research toolkit that automatically detects and visualizes Order Blocks (OB), Fair Value Gaps (FVG), merged-candle hidden structures, liquidity zones (including HTF bias liquidity), and trendline & chart-pattern liquidity.
This indicator helps traders align with the Higher Time Frame (HTF) bias — the direction of the dominant institutional wave — and uncover hidden candlestick structures that normal timeframe charts never show.
⚙️ Core Features
✅ Automatic Order Block detection (bullish & bearish)
✅ Fair Value Gaps with real-time fill tracking
✅ Merged-Candle Engine — reveals hidden structures between standard timeframes
✅ Liquidity Zones — equal highs/lows, trendline liquidity & HTF liquidity pools
✅ HTF Bias Engine — detect directional bias across multiple timeframes
✅ Auto Trendlines & Chart Pattern Liquidity
🔍 How It Works (Step by Step)
🕯️ A. Merged Candle Engine (Hidden Structure)
1️⃣ Choose how many candles to merge (e.g., 3–5).
2️⃣ The script groups candles backward from the current bar in continuous sets.
3️⃣ Each merged candle forms using:
• Open = first candle’s open • Close = last candle’s close
• High = highest high • Low = lowest low
4️⃣ These new candles expose “hidden” structures between fixed timeframes — revealing true base-impulse patterns missed by normal charts.
🟩 B. Order Block Detection
Detects consolidation (base) followed by strong impulse.
Marks demand (green) and supply (red) zones automatically.
Strength calculated using impulse range (and volume, if available).
Older, mitigated OBs can be hidden for clarity.
🟦 C. Fair Value Gaps (FVG)
Automatically detects imbalances between consecutive candles.
Unfilled FVGs are highlighted; once filled, zones fade or gray out.
Works dynamically across merged and standard candles.
🟧 D. Liquidity Zones
Finds equal highs/lows, wick clusters, and structural liquidity.
Trendline liquidity and chart-pattern liquidity detected in real time.
Projects HTF liquidity zones from higher charts down to current timeframe.
🔺 E. HTF Bias Engine
Analyzes higher and medium timeframes (HTF/MTF) using CISD-style confirmation.
Bias auto-adjusts or can be manually selected.
🧭 Purpose: Identify the dominant institutional flow and trade in its direction.
⏰ Timeframe Alignment
Recommended structure:
HTF: 4H or 1D
MTF: 1H or 30M
LTF: 15M or 5M
Users may let the script auto-adjust or manually configure each timeframe combination.
📘 Inputs & Settings
🔹 OB sensitivity (Low / Medium / High)
🔹 Volume weighting toggle
🔹 HTF & MTF selection (Auto / Manual)
🔹 Multi-symbol mode
🔹 Visual toggles (OB, FVG, trendlines, merged candles, bias labels)
🔹 Alert toggles (zone touch, bias flip, hidden structure detection)
📊 How to Use — Workflow Example
1️⃣ Load the indicator on your chart.
2️⃣ Check the HTF Bias direction — trade only in that direction.
3️⃣ Identify nearby Order Blocks or FVGs inside HTF liquidity areas.
4️⃣ Watch the Merged Candle View to confirm hidden structures (base + impulse).
5️⃣ Wait for LTF confirmation (e.g., small structure break, wick rejection).
6️⃣ Place stop beyond the opposite OB edge; target next liquidity cluster.
🎯 This workflow aligns your lower-timeframe trades with the dominant higher-timeframe flow.
🧱 Repainting & Stability
Completed OBs and FVGs remain static — they do not repaint.
Real-time zones during candle formation can update until candle closes (standard behavior).
Merged candles are recalculated each bar; once a group closes, it remains fixed historically.
⚠️ Limitations
This is not a buy/sell signal generator.
Volume-weighted features require volume data.
Use responsible risk management and independent confirmation methods.
🔒 Invite-Only / Locked Code
The script is published as invite-only to protect proprietary implementations of:
The merged-candle engine
Liquidity and bias-detection heuristics
Invite-only publishing complies with TradingView rules.
All logic, purpose, and usage are fully described here for transparency.
🧩 Originality & Usefulness
This script is an original integrated system, not a simple mashup.
Each module is interconnected to provide a unified analytical process:
The Merged Candle Engine creates hybrid bars that expose hidden base–impulse patterns.
These merged bars feed into the Order Block and Fair Value Gap logic, refining zone accuracy.
The Liquidity Detector references those zones and merged bars to locate valid structural pools.
Finally, the HTF Bias Engine confirms directional context across multiple pairs and timeframes.
Together, these elements form a dynamic framework that interprets institutional footprints and structure flow — something no single indicator can achieve individually.
The combination produces new analytical value: a precise, adaptive HTF bias alignment and structure-based liquidity map in one visual system.
📜 Disclaimer
This tool is for educational and analytical use only.
It does not constitute financial advice.
Trading involves risk — always perform independent analysis and practice sound risk management.
Past performance does not guarantee future results.
Adaptive Vol Gauge [ParadoxAlgo]This is an overlay tool that measures and shows market ups and downs (volatility) based on daily high and low prices. It adjusts automatically to recent price changes and highlights calm or wild market periods. It colors the chart background and bars in shades of blue to cyan, with optional small labels for changes in market mood. Use it for info only—combine with your own analysis and risk controls. It's not a buy/sell signal or promise of results.Key FeaturesSmart Volatility Measure: Tracks price swings with a flexible time window that reacts to market speed.
Market Mood Detection: Spots high-energy (wild) or low-energy (calm) phases to help see shifts.
Visual Style: Uses smooth color fades on the background and bars—cyan for calm, deep blue for wild—to blend nicely on your chart.
Custom Options: Change settings like time periods, sensitivity, colors, and labels.
Chart Fit: Sits right on your main price chart without extra lines, keeping things clean.
How It WorksThe tool figures out volatility like this:Adjustment Factor:Looks at recent price ranges compared to longer ones.
Tweaks the time window (between 10-50 bars) based on how fast prices are moving.
Volatility Calc:Adds up logs of high/low ranges over the adjusted window.
Takes the square root for the final value.
Can scale it to yearly terms for easy comparison across chart timeframes.
Mood Check:Compares current volatility to its recent average and spread.
Flags "high" if above your set level, "low" if below.
Neutral in between.
This setup makes it quicker in busy markets and steadier in quiet ones.Settings You Can ChangeAdjust in the tool's menu:Base Time Window (default: 20): Starting point for calculations. Bigger numbers smooth things out but might miss quick changes.
Adjustment Strength (default: 0.5): How much it reacts to price speed. Low = steady; high = quick changes.
Yearly Scaling (default: on): Makes values comparable across short or long charts. Turn off for raw numbers.
Mood Sensitivity (default: 1.0): How strict for calling high/low moods. Low = more shifts; high = only big ones.
Show Labels (default: on): Adds tiny "High Vol" or "Low Vol" tags when moods change. They point up or down from bars.
Background Fade (default: 80): How see-through the color fill is (0 = invisible, 100 = solid).
Bar Fade (default: 50): How much color blends into your candles or bars (0 = none, 100 = full).
How to Read and Use ItColor Shifts:Background and bars fade based on mood strength:Cyan shades mean calm markets (good for steady, back-and-forth trades).
Deep blue shades mean wild markets (watch for big moves or turns).
Smooth changes show volatility building or easing.
Labels:"High Vol" (deep blue, from below bar): Start of wild phase.
"Low Vol" (cyan, from above bar): Start of calm phase.
Only shows at changes to avoid clutter. Use for timing strategy tweaks.
Trading Ideas:Mood-Based Plays: In wild phases (deep blue), try chase-momentum or breakout trades since swings are bigger. In calm phases (cyan), stick to bounce-back or range trades.
Risk Tips: Cut trade sizes in wild times to handle bigger losses. Use calm times for longer holds with close stops.
Chart Time Tips: Turn on yearly scaling for matching short and long views. Test settings on past data—loosen for quick trades (more alerts), tighten for longer ones (fewer, stronger).
Mix with Others: Add trend lines or averages—buy in calm up-moves, sell in wild down-moves. Check with volume or key levels too.
Special Cases: In big news events, it reacts faster. On slow assets, it might overstate swings—ease the adjustment strength.
Limits and TipsIt looks back at past data, so it trails real-time action and can't predict ahead.
Results differ by stock or timeframe—test on history first.
Colors and tags are just visuals; set your own alerts if needed.
Follows TradingView rules: No win promises, for learning only. Open for sharing; share thoughts in forums.
With this, you can spot market energy and tweak your trades smarter. Start on practice charts.

TradeScope: MA Reversion • RVOL • Trendlines • GAPs • TableTradeScope is an all-in-one technical analysis suite that brings together price action, momentum, volume dynamics, and trend structure into one cohesive and fully customizable indicator.
An advanced, modular trading suite that combines moving averages, reversion signals, RSI/CCI momentum, relative volume, gap detection, trendline analysis, and dynamic tables — all within one powerful dashboard.
Perfect for swing traders, intraday traders, and analysts who want to read price strength, volume context, and market structure in real time.
⚙️ Core Components & Inputs
🧮 Moving Average Settings
Moving Average Type & Length:
Choose between SMA or EMA and set your preferred period for smoother or more reactive trend tracking.
Multi-MA Plotting:
Up to 8 customizable moving averages (each with independent type, color, and length).
Includes a “window filter” to show only the last X bars, reducing chart clutter.
MA Reversion Engine:
Detects when price has extended too far from its moving average.
Reversion Lookback: Number of bars analyzed to determine historical extremes.
Reversion Threshold: Sensitivity multiplier—lower = more frequent signals, higher = stricter triggers.
🔄 Trend Settings
Short-Term & Long-Term Trend Lookbacks:
Uses linear regression to detect the slope and direction of the short- and long-term trend.
Results are displayed in the live table with color-coded bias:
🟩 Bullish | 🟥 Bearish
📈 Momentum Indicators
RSI (Relative Strength Index):
Adjustable period; displays the current RSI value, overbought (>70) / oversold (<30) zones, and trending direction.
CCI (Commodity Channel Index):
Customizable length with color-coded bias:
🟩 Oversold (< -100), 🟥 Overbought (> 100).
Tooltip shows whether the CCI is trending up or down.
📊 Volume Analysis
Relative Volume (RVOL):
Estimates end-of-day projected volume using intraday progress and compares it against the 20-day average.
Displays whether today’s volume is expected to exceed yesterday’s, and highlights color by strength.
Volume Trend (Short & Long Lookbacks):
Visual cues for whether current volume is above or below short-term and long-term averages.
Estimated Full-Day Volume & Multiplier:
Converts raw volume into “X” multiples (e.g., 2.3X average) for quick interpretation.
🕳️ Gap Detection
Automatically identifies and plots bullish and bearish price gaps within a defined lookback period.
Gap Lookback: Defines how far back to search for gaps.
Gap Line Width / Visibility: Controls the thickness and display of gap lines on chart.
Displays the closest open gap in the live table, including its distance from current price (%).
🔍 ATR & Volatility
14-day ATR (% of price):
Automatically converts the Average True Range into a percent, providing quick volatility context:
🟩 Low (<3%) | 🟨 Moderate (3–5%) | 🟥 High (>5%)
💬 Candlestick Pattern Recognition
Auto-detects popular reversal and continuation patterns such as:
Bullish/Bearish Engulfing
Hammer / Hanging Man
Shooting Star / Inverted Hammer
Doji / Harami / Kicking / Marubozu / Morning Star
Each pattern is shown with contextual color coding in the table.
🧱 Pivot Points & Support/Resistance
Optional Pivot High / Pivot Low Labels
Adjustable left/right bar lengths for pivot detection
Theme-aware text and label color options
Automatically drawn diagonal trendlines for both support and resistance
Adjustable line style, color, and thickness
Detects and tracks touches for reliability
Includes breakout alerts (with optional volume confirmation)
🚨 Alerts
MA Cross Alerts:
Triggers when price crosses the fast or slow moving average within a tolerance band (default ±0.3%).
Diagonal Breakout Alerts:
Detects and alerts when price breaks diagonal trendlines.
Volume-Confirmed Alerts:
Filters breakouts where volume exceeds 1.5× the 20-bar average.
🧾 Live Market Table
A fully dynamic table displayed on-chart, customizable via input toggles:
Choose which rows to show (e.g., RSI, ATR, RVOL, Gaps, CCI, Trend, MA info, Diff, Low→Close%).
Choose table position (top-right, bottom-left, etc.) and text size.
Theme selection: Light or Dark
Conditional background colors for instant visual interpretation:
🟩 Bullish or Oversold
🟥 Bearish or Overbought
🟨 Neutral / Moderate
🎯 Practical Uses
✅ Identify confluence setups combining MA reversion, volume expansion, and RSI/CCI extremes.
✅ Track trend bias and gap proximity directly in your dashboard.
✅ Monitor relative volume behavior for intraday strength confirmation.
✅ Automate MA cross or breakout alerts to stay ahead of key price action.
🧠 Ideal For
Swing traders seeking confluence-based setups
Intraday traders monitoring multi-factor bias
Analysts looking for compact market health dashboards
💡 Summary
TradeScope is designed as a single-pane-of-glass market view — combining momentum, trend, volume, structure, and reversion into one clear visual system.
Fully customizable. Fully dynamic.
Use it to see what others miss — clarity, confluence, and confidence in every trade.
