Volume Forecast === Volume Forecast ===
The idea of "Vwap BLVD"(Closing vwap value of most recent highest volume Day of which todays price is coming in contact with above or below) is to show when you are running into "overhead supply", and or "Demand zones" on the daily chart , or intraday. You can use the Volume Forecast to check throughout the day to see if we are on pace on the current day to "beat" the Blvd's launch dates recorded volume . You can go long on positive volume forecasts toward blvd, or on the break and hold over, or you can go short against Blvd on a negative/lower forecast at the rejection of Vwap Blvd or key technical highs
You can use this label tool after the open, checking periodically to see what VF% on the day were at thus far, and does today's Forecast have a positive expectancy in relation to previous high volume days in question? Or does it have a negative expectancy based on a lower forecast number than the highest volume day and possibly slow % gains over the first hour, (checking every 15min and notating increase or decrease) thus possibly failing to over come previous over head volume resistance from the highest volume day.
Scenarios would be-
Long- We have a previous highest volume day metric of 10Mil on the daily chart. Today we have a Small gap, high PM Volume, and First 30min Were already at 50% of a 100Mil forecast. In this scenario, i would have more confidence getting long once we have reached key support areas or broken and held prior highs or vwap of the highest volume day knowing that we are forecasting MUCH higher on the day then highest volume day previously.
Short- Would be just the opposite. We have a Gapper in the morning of which has a previous high volume day of 100mil, and were interacting with that days range. low volume premarket, and out of the bell we spike but fail, and VF% is very slow to rise, and our total forecast on the day is only showing 5mil on the day total after the first 30min. I would feel confident going short against Vwap BLVD or a prior HOD from the highest volume days price range, knowing we wont have enough volume to clear the overhead volume supply.
Ive also included a small table that covers AVG vol on the time frame of your current chart. RVOL and ATR as well to help ID outlier type moves.
ALL METRICS INCLUDING VOLUME FORECAST CALCULATE FOR THE TIME FRAME YOUR CHART IS CURRENTLY ON.
Best results and most accurate readings for Forecast have been on the 1min and daily chart. Using both time frames for cross comparison intraday to gauge the volume flow after open every 15 min for the first hour or so of market. Volume forecast DOES NOT work outside of normal market hours on trading view. It will reflect negative numbers in off hours depending on the volume done on the day in that stock and in some replay modes.
This is a SIMPLE study, I wanted to KEEP it that way. So it was EASY to read, and less to be confused about.
ARE WE DEALING WITH A EARLY BIG, HIGH % IN FIRST HOUR FORECAST FOR TODAY VS PRIOR HIGH VOL DAYS???
Or
ARE WE DEALING WITH A LOW, SLOW BUILDING FORECAST IN THE FIRST HOUR FOR TODAY VS PRIOR HIGH VOL DAYS KEY LEVELS?
The easier and simple it is to read this, the faster and cleaner you can execute.
Hope you enjoy.
JMF
SPECIAL THANKS TO ©Rumpypumpydumpy AN AMAZING CODER IVE BEEN WORKING WITH FOR HELP WITH THE FINAL LOGIC AND CLEANING THE CODE AND VISUAL ASPECTS UP.
Make sure to stop by his page here on trading view and check out some of his amazing studies.
If you have any questions feel free to Dm here.
Volume Indicator

VolT by empowerTVolT is conceived to expose and alert volume volatility.
Using 21-candle moving average volume values compared to the current candle volume, you can graphically see the volume as it comes in - as a percentage of the historic 1X volume moving average.
Getting close to 2X or 5X of the 21-candle SMA? Just glance at the transparent plots behind the volume bars - or the actual percentage value in yellow.
Never wonder again how much volume that bar is compared to previous volume - now you know. Set alerts based on the volume crossing your chosen volume SMA. You'll never be surprised that the hedgies loaded up and left you behind, because you'll be right there loading up with them. (Let me know if you need help setting the alerts...)
As always, your feedback and criticisms are appreciated.
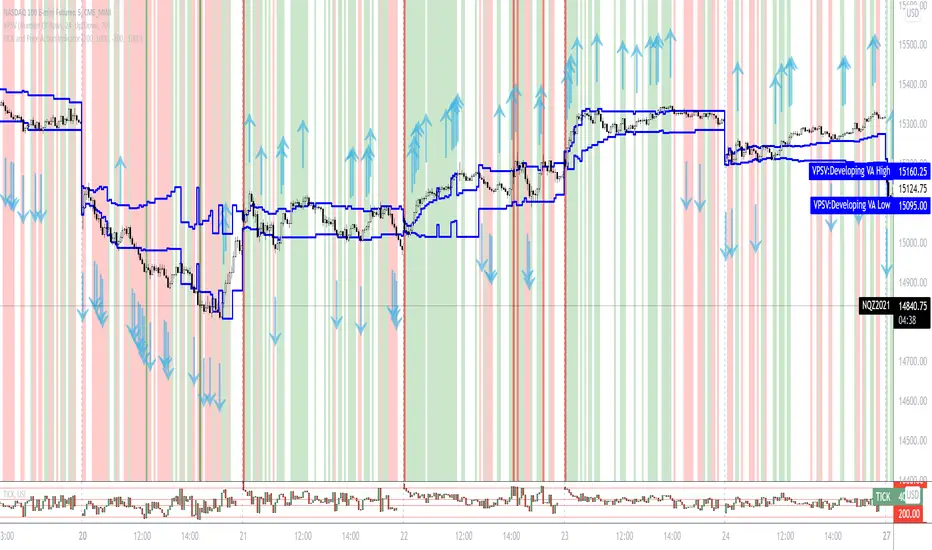
TICK and Price Action Indicator for NQ 5 minuteThis indicator for 5 minute NQ charts utilises TICK index and price action.
Where TICK opens beyond +1000/-1000 this is an overbought/oversold signal.
Similarly, when TICK closes below -200 it is a sell signal, and above +200 it is a buy signal.
This indicator colours the NQ bars based on the closing/opening values of the previous TICK.
It also draws arrows where price action (close above previous high, close below previous low) is in concordance with TICK behaviour.
BE_VolumeAnalysis_ProTraders rely on volume as a key metric because it lets them know the liquidity level of an asset. If enough volumes are supplied (Buy | Sell) definitely prices respect the supplied volume.
However, the word “Supplied” is here indicated as “Pressure”. If there is enough Buying pressure then sellers will be kicked out easy and vis-versa.
Index traders normally refers to future contract volumes and hence we have provided an option to refer the volumes from the near expiry contracts.
Mathematical calculation is involved in this study to arrive at the Appx volume for the options such as Volume Splitter. If pressure is seen from buyer side, then volumes will be shown for buyers more and similarly for sellers. Each candle will have both buyers’ volume vs Seller Volume.
Similar study have be made along with some averages to arrive at the buying | Selling pressure for the Options “Volume Pressure & Vol Pres 2”. If price has to move up buying volumes should get pumped in and for prices to fall down selling volumes should be pumped in to the market. Quantum of pressure is being calculated accordingly and shown as the areas for option “Volume Pressure” and Candles for option “Vol Pres 2”.
Also we have shown some additional built in indicators like OBV and Price Volume Trend along with faith plots to show the traders extra information about the volumes to take some wise trades.
Note: Study involves more of price action calculations (mathematical calculations only).
Volume Pressure AnalysisVolume Pressure Analysis is a new concept I have been working on designed to show the effort required to move price. An ideal tool for confirming trends or locating reversals early. This indicator can highlight whale action and market manipulation. It calculates volume vs volatility and displays the results as a meter:
Above 0 shows how easy price action is traveling, the bigger these bars the less volume and effort is required to push price. These are indicated with a teal or red arrows and can confirm the beginning or continuation of a trend. This is the natural direction the chart wants to travel at that time.
Below 0 shows how hard price is to move. The bigger these bars the more volume and effort is required to push price. When whales and market makers push price against its will these bars will get bigger.
Yellow arrows signal pressure in that direction and excessive amounts of volume is required to move price. These signals can lead to reversal/ pivot points as price action struggles to continue its trend. These signals can be turned on in settings or use the overlay version of this script to display signals on chart. This is a very powerful tool when used with relative volume.

Volume Pressure Analysis - OverlayVolume Pressure Analysis is designed to show effort required to move price. This script is the overlay version that displays signals on the candles as well as changes the bar colors. Yellow arrows signal pressure in that direction and excessive amounts of volume is required to move price. These signals can lead to reversal/pivot points as price action struggles to continue its trend. Red and teal arrows indicate free flowing price action where very little effort or volume is needed to push price. These signals can confirm the beginning or continuation of a trend and is the natural direction the chart wants to travel at that time. For more information please check out the main Volume Pressure Analysis indicator.

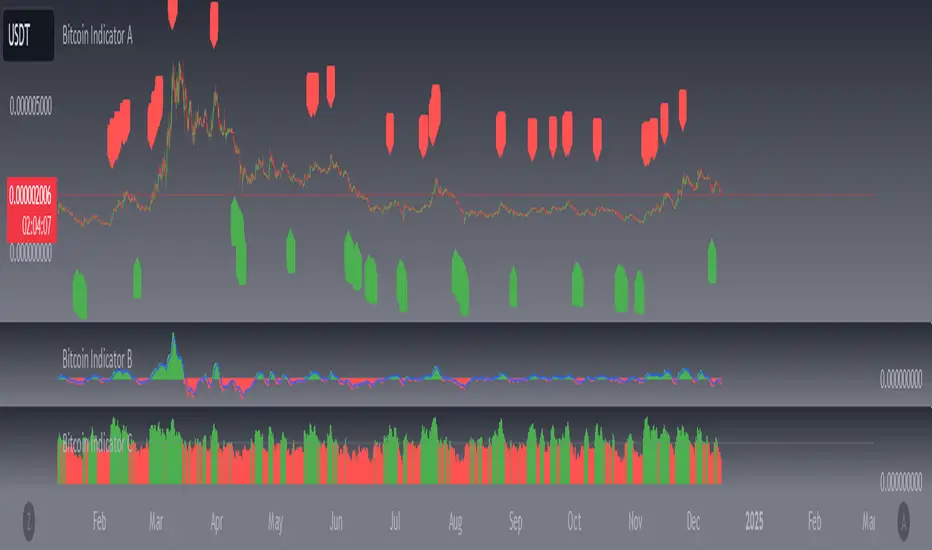
Bitcoin Indicator BThe Bitcoin Indicator was developed especially for high leverage Bitcoin trading. It comes in two parts; Bitcoin Indicator A/B. Indicator B shows the amount of money flow in & out the market in real time.
Indicator B must be used together with Indicator A. You can use it as the last confirmation after a trading signal on Indicator A. You can also look for divergence, trend continuation and trend dominance with it.
For example: There is a strong uptrend according to the Indicator A also a trend continuation signal appears. This case you won't jump into the trade immediately but check Indicator B. If there is a huge dominance on the positive side you can be pretty sure your trade will be profitable. If you rather look for trend reversal the best thing you can do is waiting for a divergence on the Bitcoin Indicator B and the price. If the Trend Cloud also shows weakness from Indicator A you can open your position.
Divergence usually comes with a new trend. So if you trade divergence you can use the Trend Cloud from Indicator A to identify trend weakness. When you see the weakness in the new trend there will be your exit point. If you do short-term trade you can also look for the top of the first hill on Indicator B right after the divergence.
There are 4 levels added to the indicator which are the grey lines. These will help you to identify the selling and buying power on the market. Also the lines can be changed manually and used for alerts.
The Bitcoin Indicator can be used on any timeframe. Also there are several strategies you can apply. For the other strategies you can read the Bitcoin Indicator user guide once you got access. For more information please go to the website.
Accumulation/Distribution %This script takes the signal from the Accumulation Distribution indicator invented by Larry Williams and normalizes it such that it becomes an oscillator about a zero line as described by John Bollinger in his book Bollinger on Bollinger Bands . The purpose of the indicator is to serve as a volume-based confirmation of signals given by other indicators, typically Bollinger Bands paired with a momentum indicator . In the example shown, Bollinger Bands are paired with Bollinger Bands %B and the Bollinger Bands %B indicator is interpreted similar to the Relative Strength Index ( RSI ) which is a momentum indicator .
The AD% indicator is colorized such that positive readings are green and negative readings are red. The readings become darker when approaching the zero line. The colorization is also displayed on the price chart. The chart type needs to be set to "bars" for price colorization to work properly.
The formula for this indicator is presented in the John Bollinger book as follows:
10-day sum of /10-sum of volume
How to use (my take on a strategy from the book):
1. Look for %B readings that are oversold or overbought (less than 0.00 or greater than 1.00)
2. Check for bearish divergence or bullish convergence of price and %B as shown on the chart
3. Verify divergence or convergence with AD%
4. Note previous trending/crossover behavior of AD% and %B and compare to situation being analyzed
5. A conservative trader may consider buying/selling on a close beyond the 20-day moving average and an AD% zero line crossover (color change)
6. An aggressive trader may consider buying/selling on a color change alone, on a breakdown of %B, or some other signal(s).
Securities behave differently from one another and this strategy doesn't work for all of them. As with any strategy, check past performance to make sure this approach is a good fit. Bandwidth ( volatility ) squeeze is another strategy which seems to work well for this security. For that reason, it was used to demonstrate buy signals, but squeezes aren't always so predictable. AD% may be useful for determining which direction a squeeze will resolve itself, as was the case here. Further information on volatility squeeze trading can be found in the John Bollinger book Bollinger on Bollinger Bands or online.
The default TradingView Accumulation Distribution indicator does not incorporate opening price. The formula used for this indicator does, so there are multiple versions of the A/D formula.
Despite the buy signal indicated, I'm not going long Hecla Mining here and I don't recommend it. I'd need to do further DD before doing so.
Please feel free to ask questions.

TAPLOT Volume Pocket PivotsThis volume indicator identifies up-day volume spikes that quality as pocket pivots. A pocket pivot volume is an up day volume that is greater than the highest down volume day of the last 10 down days (AKA 10 day pocket pivot).
Pocket Pivots are the work of Gil Morales and Chris Kacher.
www.wiley.com
www.wiley.com
My study checks volume only to see if they met the pocket pivot criteria.
The other stock criteria (strong fundamentals, no wedging, constructive basing, how extended price is -etc.) need to be evaluated separately. Please read author's books to fully understand how Pocket Pivots are to be used.
My implementation of it in this manner is to visually give a sense of institutional buying pressure (demand). This is not a trigger indicator. Read the author's books if you want to understand the difference between a "buy-able" Pocket Pivot and non-buy-able one.
Volume colors:
10 day pocket pivots are bright green bars
5 day pocket pivots are blue
Regular up volume days are dark green or light gray (depending on the color scheme you choose)
Down volume days are red or dark gray (depending on the color scheme you choose)
You have the option to choose your volume color scheme. My charts are mainly white and black candles, so the default volume color scheme is Light gray for up day volume and dark gray for down day volume. Fee free to change that through indicator settings.
Hope you find this useful. Please leave any questions you have in the comment section and I'll be happy to answer them.

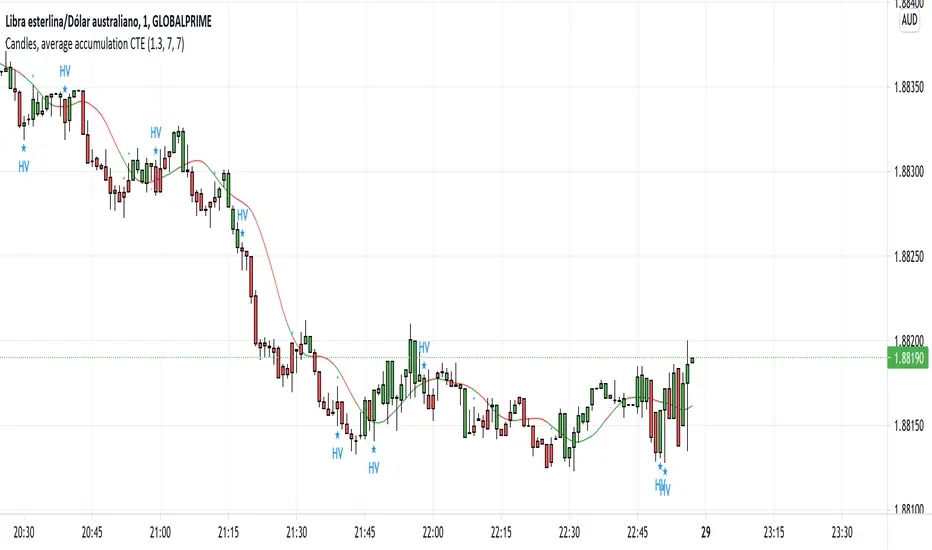
Candles, average accumulation CTEHello everyone, this indicator is made to calculate the historical average cumulative volume, in the number configurable by the trader.
It is used to display bullish or bearish color in relation to the accumulation of historical volumes.
In the settings of the same indicator you can read the recommendations.
This indicator has 4 relevant data
1- Average accumulated volume, configurable by color
2- It shows us the climatic volume, based on the considerable and configurable increase in volume, in relation to the volume of the nearby candles.
3- It shows us a smoothed moving average, acting as support or dynamic resistance, this moving average should be used as a complement for the volume analysis, for example, if the color of the last candle appears in a negative accumulation color then we must wait that has force in movement with the crossing of the moving average.
In addition, this moving average is being used to perform anticipation calculations, based on short-term average accumulations of volume.
4- Anticipation calculations, the indicator shows us signs of "+" or "-" if the result of the early accumulation is being supported by climatic volume and in the same direction as the candle.
I hope this indicator is very useful so that you can keep in mind a relevant data such as the volume and the ease of visualization in space and time of the graph.
Ultimate MACD Strategy [PrismBot] [Lite]Included in this Ultimate MACD Lite Strategy:
✔️ Tweak a multitude of specific settings (MA lengths, R:R, SL distance etc)
✔️ Enable advanced setup filters
✔️ Use money management and risk calculations
✔️ Draw trade info directly to chart (eg. SL size in percent, win rate etc)
✔️ Use various filters (eg. time filter, date filter, MA slope angle etc)
✔️ Manage risk per position when auto-trading forex through AutoView
✔️ Choose from various alert conditions!
✔️ Sync to any bot or algorithmic trading system
Some details about this strategy:
LONG SIGNAL
When the MACD is below the zero line of the histogram, close is above the 200EMA, and the MACD line crosses above the signal line, longs are taken
SHORT SIGNAL
When the MACD is above the zero line of the histogram, close is below the 200EMA, and the MACD line crosses below the signal line, shorts are taken
A couple of options are given for how to calculator stop losses.
The Take profit is calculated by the risk of the stop loss. So a 1.5 take profit target is 1.5 times the stop loss added to the entry price.
There is also an option to filter out trades by the histogram deviation. This prevents crossovers that are too close to the histogram from being taken.
Please note I used the code for the PPO instead of the traditional MACD to make calculating these percentage deviations more consistent across multiple asset types.
You can easily enable and disable strategies using the checkbox.
This strategy incorporates a risk to reward system where the user can select between ATR and Percent based stop losses and take profit targets. This means that the user has much better control over money management when utilizing this strategy and it doesn't require you to babysit the strategy to ensure it's entering and existing strategies in an ideal place.
You can also enter custom messages for alerts for use with bots (set alerts to "alert() function calls only")

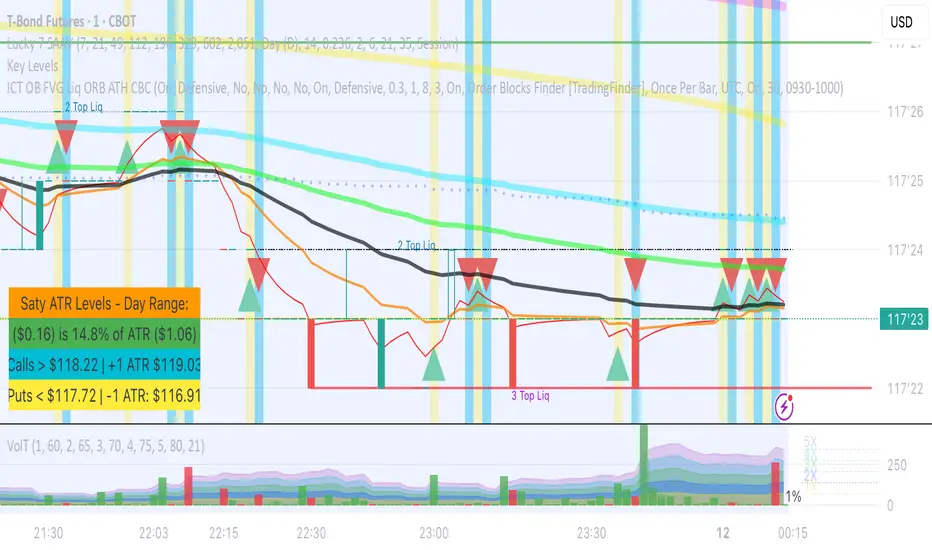
Unusual Time Frame VolumeThis script plots the ratio of each volume bar to the average daily volume of that specific bar (at that specific time of day).
You can see what the volume at the 09:30 (or whenever) bar looks like compared to the average volume at the same time during the previous X number of days.
The output can be read like a normal volume chart; however, you can see at a glance whether these is more volume than "normal" for that time of day.
A value of "2" would be 2x the "normal" volume; a value of "0.5" would be half.
Thus, if bars exceed the value of "1", you know that there is more volume than normal.
If the bar exceeds an adjustable threshold, it will change the color of the bar to yellow; otherwise it will be orange for values exceeding "1".
As a consequence to this approach, the plot is effectively normalized such that it obviates the need to scale up or down as volume changes throughout the day.
Notes:
If the settings are not set appropriately for your mode and time frame, the output will be incorrect/invalid!
Make sure you set the "Asset Mode" and "Time Frame (minutes)" to values that match your asset and chart setting. For example, if you are trading Futures on a 2m chart, set the Asset Mode to Futures and Time Frame to 2m. If you are trading crypto on a 5m chart, set the Asset Mode to 24/7 and Time Frame to 5m.
If you choose a "Look-back (Days)" setting that is too far back given the time frame, the script will produce an error. I suggest playing with settings from 1 (compares volume to the previous day's volume) to the highest number that doesn't break the script. For example, at a 2m time frame, the maximum look-back will be 6-7 depending on which mode you are using. Longer time frames allow larger look-back values. I find that the default value (6 Days) does a decent job in general.

On Balance Volume - Color Packed Patch'emOBV is provided as a built-in by TradingView.
This contribution grew out of reading about trend discovery, and since the library kept on this end was lacking in a volume-centric indicator, it looked like a good time to play around.
This approach isn't all that much different than many others with the possible exception of its color scheme.
Should you decide to use the script, it might be worth your while to work with the logic of color and line, to produce alerts.
Enjoy.

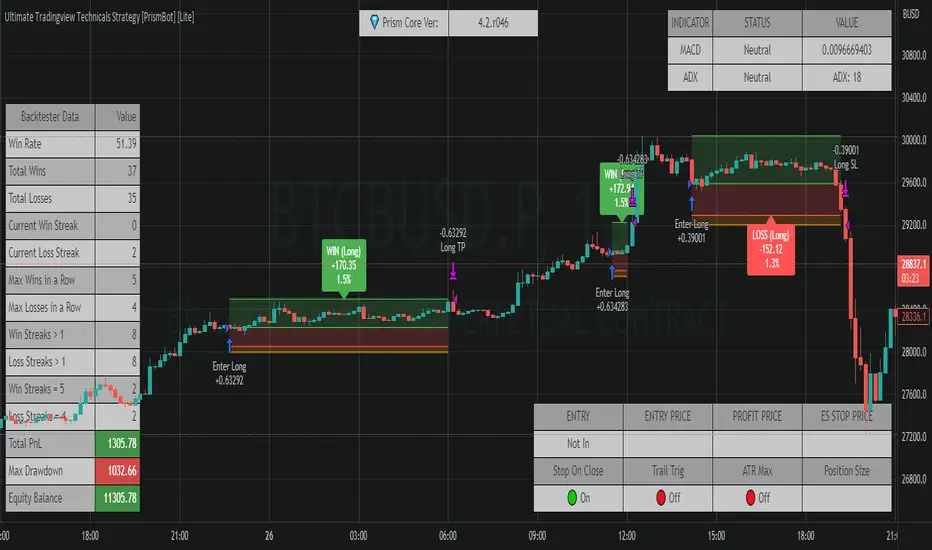
Ultimate Tradingview Technicals Strategy [PrismBot] [Lite]Included in this builder:
MACD
RSI
Tradingview Technical Analysis
Ichimoku
Global Trend Filter
Pullback Filter
Our most robust strategy to date with MACD , RSI , and many other basic strategies included as well as additional filters and alert options.
It is an advanced trading strategy built with the intent to make it easy for anyone to begin trading, but also avoid too much complication of strategy concepts.
For instance, you can change the MACD settings to be "more sensitive" by using a simple dropdown menu, and adjust which strategy you are employing with the MACD on the fly with another.
You can easily enable and disable strategies using the checkbox.
The strategy demo results use 100% equity per trade as an example - the reason for this is that the stop loss is set to 1%, so each trade is risking 1% (give or take slippage). Slippage is set to 5 ticks, and a 0.04% commission (Binance average for market and limit orders)
This strategy incorporates a risk to reward system where the user can select between ATR and Percent based stop losses and take profit targets. This means that the user has much better control over money management when utilizing this strategy and it doesn't require you to babysit the strategy to ensure it's entering and existing strategies in an ideal place.
The status box shows the current state of the various strategies and their values. A red circle indicates the filter / strategy is not valid for entry yet. A green circle indicates that filter / strategy is valid for entry. When all selected strategies are valid simultaneously, the next bar will trigger an entry signal.
If you have any questions about this strategy, please leave them in the comments below, or DM for more details. Thanks!
Additional features in this lite strategy:
✔️ Tweak a multitude of specific settings (MA lengths, R:R, SL distance etc)
✔️ Use money management and risk calculations
✔️ Draw trade info directly to chart (eg. SL size in percent, win rate etc)
✔️ Use various filters (eg. time filter, date filter etc)
✔️ Manage risk per position
✔️ Sync to any bot or algorithmic trading system
Super Volume+(Süper Hacim+)English
The "Super Volume+" plug-in was designed to be used in conjunction with the "Super Volume" plug-in, but can also be used alone. It facilitates the use of "Volume Bar Patterns(Volume Action)" by marking voluminous and non-voluminous bars on the chart. It also helps to distinguish between useful support and resistance by highlighting strong trading zones. You can receive "high volume" notifications with the alarm feature.
How to use?
Volume buys and sells are marked with dark dots.
Volumeless buys and sells are marked with light colored dots.
Having more dark dots on the support or resistance lines you draw indicates that those regions are strong regions.
Warning: I discovered these formations, they are still in the testing phase. You should be careful while using it.
Shifting Volume Patterns
*The volumeless red candles on the hills indicate that the decline will begin, and the decline accelerates with the normal and volume sales that follow.
*Green candles with no volume at the bottom indicate that the rise will begin, and the rise will accelerate with the normal and voluminous purchases that follow.
Fake Volume Patterns
*Volumeless red candles formed in an upward movement are false decreases and the rise continues.
*The volumeless green candles formed in a bearish movement are false rises and the decline continues.
Working logic:
For Shifting Volume Formations; the total volume of buying and selling is less than half of the 90 bar average. Incoming transactions are greatly reduced. This shows us that either the buyer or the seller is about to run out. Transactions of the prevailing party increase. We can understand which side is winning by looking at the color of the candle when the candle is closed. If it is red, the decline continues, if it is green, the rise continues.
For Fake Volume Formations; the total volume of buying and selling is less than half of the 90 bar average. Let's consider a minor trend, a candle without volume (buying or selling without volume) will not be enough to disrupt the trend. A small amount that comes in cannot change the direction of the buying or selling transaction. The price continues in the same direction even if there are candles of different colors in the trend.
Türkçe
"Süper Hacim+" eklentisi "Süper Hacim" eklentisi ile birlikte kullanılmak için tasarlandı ancak tek başına da kullanılabilir. Grafik üzerinde hacimli ve hacimsiz barları işaretleyerek "Hacim Çubuk Formasyonlarının" kullanımını kolaylaştırır. Ayrıca güçlü alım satım bölgelerini belirginleştirmesi sayesinde işe yarayacak destek ve dirençlerin kolayca ayırt edilmesine yardımcı olur. Alarm özelliği ile "yüksek hacim" bildirimleri alabilirsiniz.
Nasıl Kullanılır?
Hacimli alış ve satışlar koyu renkli noktalar ile işaretlenir.
Hacimsiz alış ve satışlar açık renkli noktalar ile işaretlenir.
Çizdiğiniz destek veya direnç çizgileri üzerinde koyu renkli noktaların fazla olması o bölgelerin güçlü bölgeler olduğunu gösterir.
Uyarı: Bu formasyonları ben keşfettim hala test aşamasındadır. Kullanırken dikkatli olmalısınız.
Yön Değiştiren Hacim Formasyonları
*Tepelerde oluşan hacimsiz kırmızı mumlar düşüşün başlayacağına işaret eder sonrasında gelen normal ve hacimli satışlarla düşüş hızlanır.
*Diplerde oluşan hacimsiz yeşil mumlar yükselişin başlayacağına işaret eder sonrasında gelen normal ve hacimli alışlarla yükseliş hızlanır.
Fake Hacim Formasyonları
*Bir yükseliş hareketi içerisinde oluşan hacimsiz kırmızı mumlar sahte düşüşlerdir yükseliş devam eder.
*Bir düşüş hareketi içerisinde oluşan hacimsiz yeşil mumlar sahte yükselişlerdir düşüş devam eder.
Çalışma mantığı:
Yön Değiştiren Hacim Formasyonları için; alış ve satış toplam hacim miktarı 90 barlık ortalamanın yarısından azdır. Gelen işlemler çok azalmıştır. Bu da bize alıcıların yada satıcıların ikisinden birinin bitmek üzere olduğunu gösterir. Üstünlük kazanan tarafın işlemleri artar. Hangi tarafın kazandığını mum kapandığında rengine bakarak anlayabiliriz kırmızı ise düşüş devam eder yeşil ise yükseliş devam eder.
Fake Hacim Formasyonları için; alış ve satış toplam hacim miktarı 90 barlık ortalamanın yarısından azdır. Minör bir trend düşünelim yükselen yada düşen trendin tersine oluşacak hacimsiz mum (hacimsiz alış veya satış) trendi bozmaya yetmeyecektir. Gelen küçük bir miktar alış yada satış işlemin yönünü değiştiremez. Trend içinde farklı renkte mum olsa da fiyat aynı yönde devam eder.
Örnek / Example:

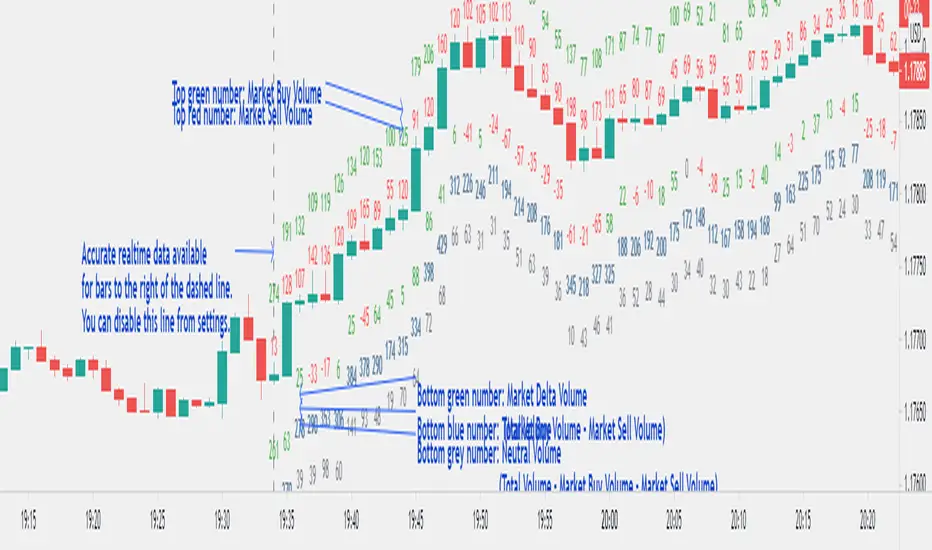
Realtime Volume Bars w Market Buy/Sell/Neutral split & Mkt Delta
What is it?
A tool that shows Real-time Volume bars split into 3 components: (1) Market Buy Volume - i.e., the volume that got transacted on upticks; (2) Market Sell Volume - i.e., the volume that got transacted on downticks;
and, (3) Neutral Volume - i.e., the volume that got transacted without a change in price. (This feature can be turned off if you want normal volume bars).
Market delta (i.e., Market Buy Volume - Market Sell Volume) is also displayed above each volume bar. (On by default; can be switched off from Settings)
The split and Market Delta data are ONLY AVAILABLE FOR REAL-TIME BARS. Historical bars are shown just like regular ones. The dotted line marks the start of real-time data (i.e., the bar from which the indicator started collecting and displaying data). You will see accurate data for bars to the right of this line. The longer you keep a chart open with the study enabled, the more data it collects and displays, and the better your analysis can potentially be.
Note that the data gets reset every time any of the options is changed, the market is switched, the browser is refreshed, or the script is reloaded
DATA ISN'T STORED. I.e., every time a new symbol is loaded, the previous symbol's data is lost. So if you intend to monitor a symbol, you would need to keep it loaded all the time.
Who is it for?
For traders who are used to analyzing buy/sell activity using market buy/sell volume and market delta information
Although you can use this independently as well, use it in conjunction with "Market Delta Volume for Realtime Bars" indicator to get a better visual representation of the numbers.

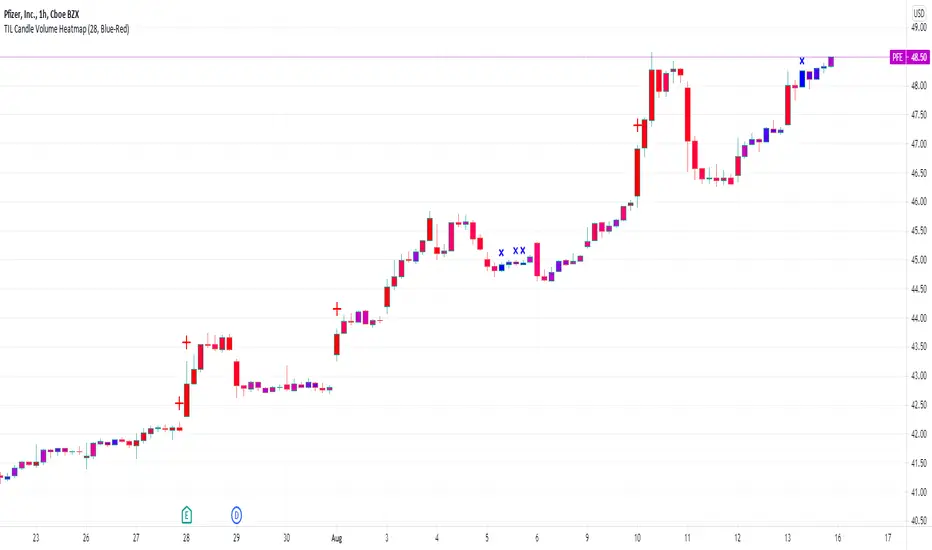
TIL Candle Volume HeatmapTrading Indicator Lab’s Candle Volume Heatmap for TradingView merges volume with price by applying gradient colors in the bars. It can also detect bars that have the most volume and the least volume.
Gradient Coloring
When applied to a chart, the Candle Volume Heatmap indicator applies colors to each bar which may vary according to its number of volume. The chart becomes a heatmap where you can easily spot which parts of the chart that are “hottest” or the bars that had the greatest number of volume and the “coldest” or ones that had the least volume. The indicator uses colors that transitions from BLUE to RED where shades closer to blue are “cold” (low volume) and those that are more in the shade of red are considered “hot” (high volume).
- Blue candlesticks – has low volume
- Red candlesticks – has high volume
High and Low Volume Bars
In addition to bar color changes, the Candle Volume Heatmap indicator also marks bars that have the lowest and highest volume within a certain length. Low and high-volume bars are marked as follows.
- – Low volume bars are marked with a small cross above them signifying a very low volume. Please note that this symbol always appears in new bars which are only starting to accumulate volume.
- – High volume bars are marked with a large plus sign above them signifying a very high volume. These bars along with other red-colored bars are the ones that should be monitored most.
Uses
Identifying low and high-volume bars can be useful in determining whether there is weight or “force” behind the price action that occurs in each bar. High volume bars can be used to validate candlestick reversal patterns and confirm breakouts in support and resistance levels.
Available Alert Conditions
- High Volume – triggers when a high-volume bar (marked with a plus sign) is detected
- Low Volume – triggers when a low-volume bar (marked with a cross sign) is detected
Inputs
- Length – sets the number of bars the indicator analyzes at each execution.
- Color Gradient – sets the color set for applying the heatmap on the chart candlesticks. Choices available are Blue-Red (good for light mode) and Yellow-Red (good for dark mode). Red color always signifies the highest concentration of volume.
- Apply Heatmap Colors – applies the color gradient on the chart candlesticks to indicate the amount of volume in each one
- Display Markers Below – moves the position of the high volume (plus) and low volume (cross) markers below the candlestick
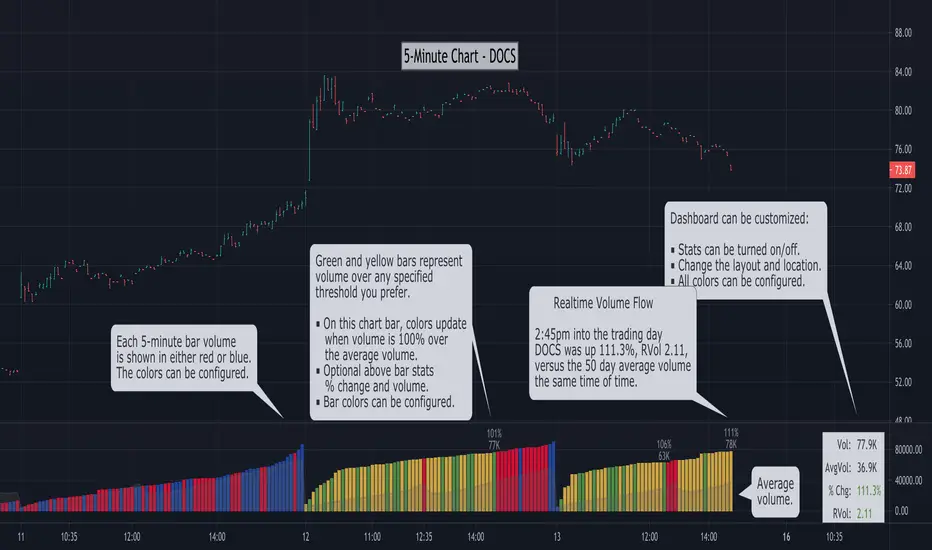
Relative Volume - Real-Time Volume [LevelUp]Relative volume compares the volume at a specific time in the trading day versus the prior volume at the same time of day over a specified range. This is an ideal way to gauge if there is significant volume driving a price move, either up or down.
What's Unique About this Relative Volume Indicator?
Many relative volume indicators simply divide the current volume by the average volume. Unfortunately, this calculation is not an accurate gauge of volume at a specific point in time and it will not account for typical spikes in volume that occur early and late in the day.
This indicator calculates relative volume on an intraday chart, looking at the volume for each bar in the current timeframe, over a range of days that is configured in Settings. For example, if the preferred lookback is set to 50 and you are on a 5-minute chart at 1:00pm, the indicator will determine the average of cumulative volume traded up to 1:00pm on each 5-minute bar, over the past 50 days. The result is an accurate representation of the "true" volume for a specific time in the day.
Relative Volume as Percentage or Ratio
Relative volume can be shown as a percentage change, a ratio or both. The calculations are the same, it's more about your preference.
For example, if a stock has traded 1M shares at 10:00am, yet the average over the past 50 days at 10:00am is 500k shares, the percentage increase is 100% and the ratio would be 2.0.
Intraday Charts
To accurately determine volume at a specific point during the trading day, as compared to the average at that same time of day, calculations need to be done on an intraday chart. This is your go-to chart to gauge realtime volume flow.
Daily, Weekly and Monthly Charts
Relative volume data is also shown on daily, weekly and monthly charts, however, it's important to note these values are based on the close of the respective timeframe.
Acknowledgement
Many thanks to @LucF and @e2e4mfck for their excellent open source indicator, Relative Volume at Time, for TradingView. If you are interested to learn more about the details of relative volume, this is the definitive resource.
Market Delta Volume for Realtime BarsWhat is it?
Market Delta Volume Tool for real-time bars
A market delta tool that shows, (1) the volume that got transacted on upticks - or the market buy volume; (2) the volume that got transacted on downticks - or the market sell volume (3) the market delta volume (i.e., market buy volume - market sell volume); (4) the total volume (market buy volume + market sell volume + neutral volume); and (4) the volume that got transacted without a change in price - or the neutral volume (total volume = market buy volume + market sell volume + neutral volume)
NOTE: THIS WORKS ONLY ON REAL-TIME BARS, NOT ON HISTORICAL BARS! The dotted line marks the start of real-time data (i.e., the bar from which the indicator started collecting and displaying data). You will see accurate data only for bars to the right of this line.
The longer you keep a chart open with the study enabled, the more data it collects and displays and the better your analysis can potentially be.
Note that the data gets reset every time any of the options is changed, the market is switched, the browser is refreshed, or the script is reloaded.
DATA ISN'T STORED. I.e., every time a new symbol is loaded/or the same symbol is reloaded, data gets refreshed.
Who is it for?
For traders who are used to analyzing buy/sell activity using market delta information. Especially, short-term trader/scalpers who are used to keeping the same chart open through the trading session.
Also for traders to see and study how anomalies in volume can give clues to buyer/seller absorption, initiative buying/selling etc.
Can be used to better understand VSA as well, although not necessary.
Essentially, this gives real-time delta volume information; use it however you see fit.
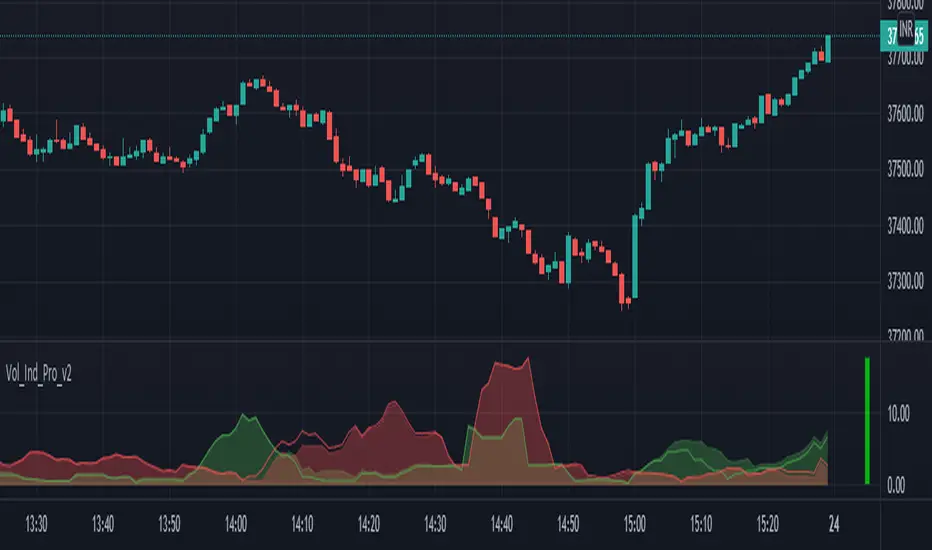
Volume PlusVolume plus provides volume insights to identify increase or decrease in relative volume or sudden volume expansion that exceeds the average. Based on the period selected the script displays the color code.
Features
1. Two different sensitivity levels can be selected for volumes and coloring.
2. Whenever the volume is higher than the selected SMA, volume bars will change color.
3. Can Plot 20 SMA (can be changed)

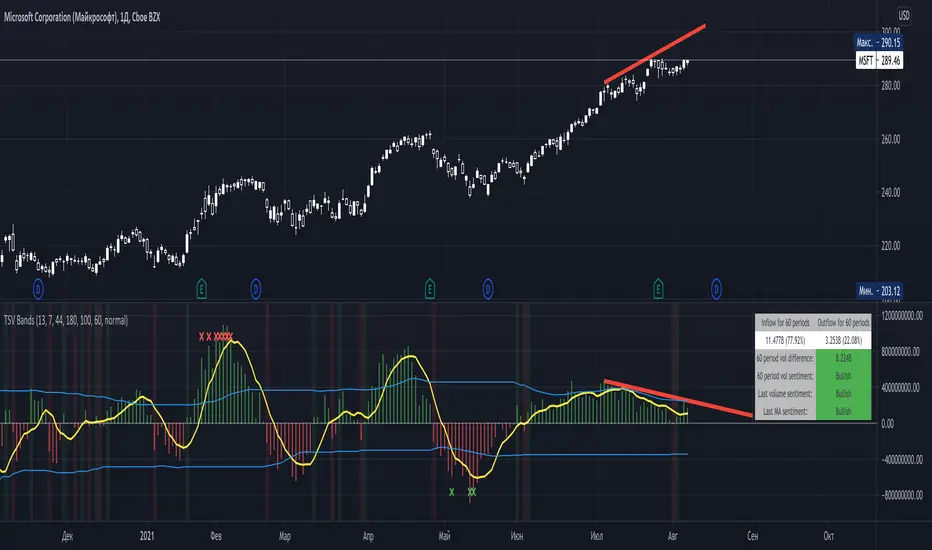
Time Segmented Volume BandsTime Segmented Volume Bands
This time I took as a basis TSV - Time Segmented Volume, a rather rare one, almost never mentioned on TradingView.
TSV is a leading indicator because its movement is based on both the movement of the stock price and its volume. Ideal entry and exit points are usually found when a stock moves through a baseline. This indicator is similar to the more well-known balance volume (OBV) because it measures the amount of money flowing in or out of a particular stock.
What is their main difference between TSV and OBV?
Time Segmented Volume is used to eliminate distortions of the standard volume graph. OBV is based on cumulative total volume, while TSV compares the current time period with the previous one, without a subtotal.
What I added on my own script
Bands, similar to Bollinger. The main idea is to have an idea of the average inflow and outflow of volumes from / to shares for a particular period. We have an opportunity to estimate how much the current volumes differ from the average for 60 days (all values can be flexibly adjusted).
Excess markers by the current average volume (sensitivity can be adjusted separately).
A table that calculates the total sentiment (force) of volume on average for N periods in comparison with the current one.
Sell/buy markers
How to read a TSV graph
The main graph is a histogram. Green bars mean an inflow of volume, red bars mean an outflow. When the red volume crosses the baseline zero, it is considered a buy signal (in the classic TSV version). A similar sell signal - just the opposite. I highlight them with a colored background fill.
It is especially important to find divergences on the chart. For example, when the volume peaks getting lower but the price rises (short).
The yellow line is the average TSV for 7 periods. Just a smoother lagging line.
Blue stripes. Above - the average inflow of volumes over N periods (44 days). Below - the average outflow.
Markers are additional buy / sell signals generated when the current TSV value exceeds the average for N periods. In the script settings, you can choose how many percent deviations from the average should occur in order to count it as a strong signal (by default, an excess of 180% for selling, 100% for buying). The main idea of the marker is to catch a better price than with the standard TSV logic (take at the intersection of the zero line). The marker can serve as both an assistant and drive into a trap. If you are not very confident, then it is better to adhere to standard practice, and set the excess of markers to completely abnormal situations, so that it triggers less often.
Colored background - a classic buy or sell zone (when crossing the TSV baseline).
Table - you can configure its presence and size in the settings. On it you can estimate the sentiment of the movement of money for the last N periods. Pay particular attention to the % value in parentheses. It shows the strength of the trend in volumes over N periods.
The basic rule, as with any trend indicator: do not trade against the trend. A sell signal in a constantly rising channel is not a short signal. This is a signal for a possible fixation of a part of the position. No more.
How do I use this indicator?
For starters, I never make decisions purely based on an indicator. TSV plays the role of a clearer visualization of volumes for me. If I see that the volumes are fading away (thin market), then I try not to enter the trade. For the last two weeks, while picking charts, I completely abandoned standard volume bars in favor of TSV due to it's greater informative.
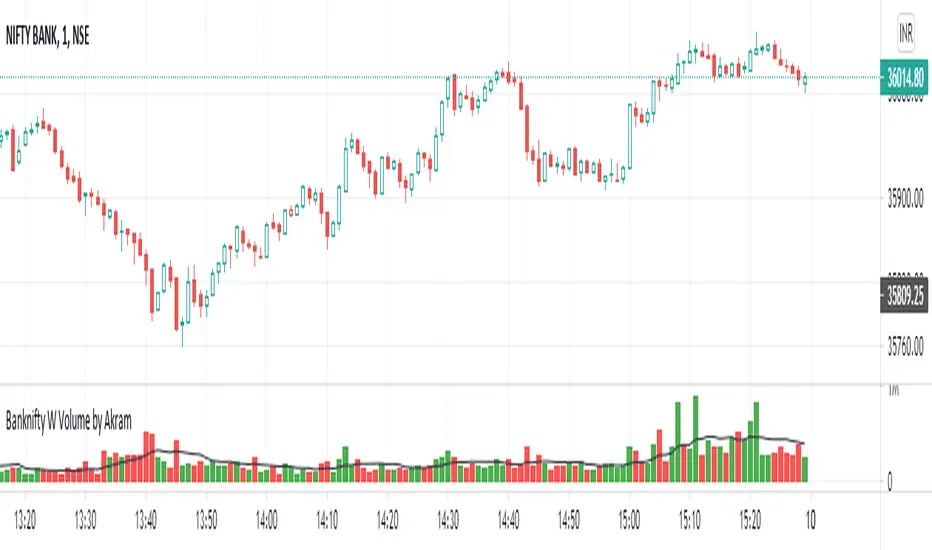
Banknifty Weighted volume by AkramulBanknifty Weighted volume as per share ratio.
HDFC Bank – 27.56%
ICICI Bank – 22.91%
State Bank of India (SBI) – 12.42%
Kotak Mahindra Bank – 11.77%
Axis Bank – 11.49%
IndusInd Bank – 5.20%
AU Small Finance Bank Ltd. – 2.35%
Bandhan Bank – 1.73%
Federal Bank – 1.53%
IDFC First Bank Ltd. – 1.22%
Punjab National Bank (PNB)- 1.03%
RBL Bank – 0.79%
and moving average plotted on volume
Volume Average / Current Volume / ATR On ChartSimple Study to display volume data and atr value on the chart. It will display the relative volume in percentage, an average volume and the current volume and ATR value for the time resolution.
Thank you to @PriceCatch for the ATR code
