OBV based on MADescription:
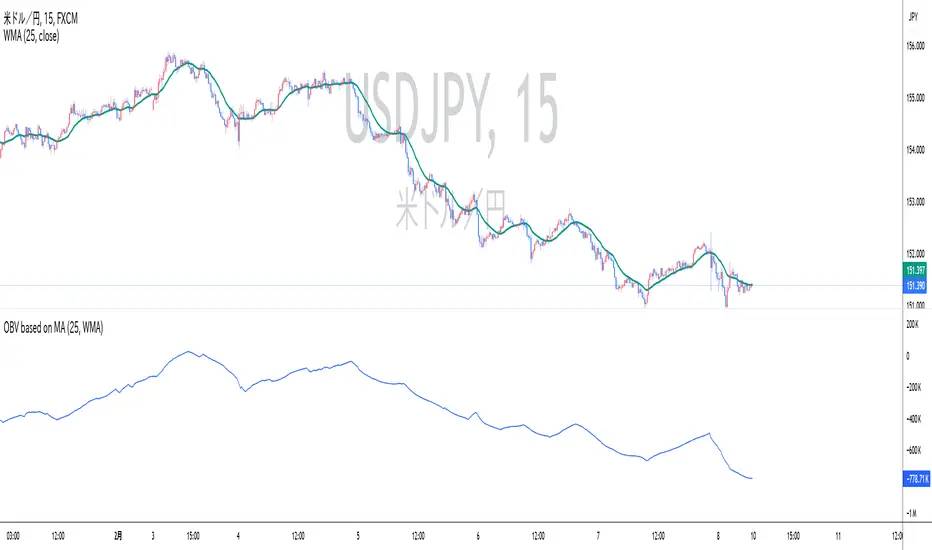
This indicator calculates On-Balance Volume (OBV) based on the direction of a Simple Moving Average (SMA). Instead of using price movements, this OBV adds or subtracts volume depending on whether the SMA is rising or falling.
SMA-based OBV: When the SMA rises, the volume is added to the OBV. When the SMA falls, the volume is subtracted from the OBV. This allows traders to observe cumulative volume in relation to the wave patterns created by the SMA.
SMA Period: The period of the SMA can be customized, allowing traders to adjust it according to the wave size they want to observe.
While the cumulative volume indicator already exists, traders who analyze volume patterns can use this indicator to more easily conduct volume analysis across different wave sizes.
Inputs:
SMA Period: Defines the lookback period for calculating the Simple Moving Average (default is 25).
Ideal for:
Traders who want to analyze volume flow relative to moving average trends, rather than price movements. This can help identify underlying strength or weakness in market trends.
説明:
このインジケーターは、単純移動平均(SMA)の方向に基づいてオンバランス・ボリューム(OBV)を計算します。価格の動きではなく、SMAが上昇しているときは出来高を加算し、SMAが下降しているときは出来高を減算します。
SMA基準のOBV: SMAが上昇している場合はOBVに出来高が加算され、SMAが下降している場合は出来高が減算されます。これにより、SMAが作る波形に即した累積出来高を観察することができます。
SMA期間: トレーダーが見たい波のサイズ感に応じて、SMAの期間をカスタマイズできます。
既に累積出来高(Cumulative Volume)というインジケーターは存在しますが、波形を基に出来高を分析しているトレーダーは、このインジケーターを使うことで、様々なサイズの波形に即した出来高分析をより簡単に行うことができます。
入力項目:
SMA期間: 単純移動平均の計算に使用される期間を定義します(デフォルトは25)。
適しているトレーダー:
より波形に即した累積出来高分析を重視するトレーダーに最適です。
Pine Script® indicator