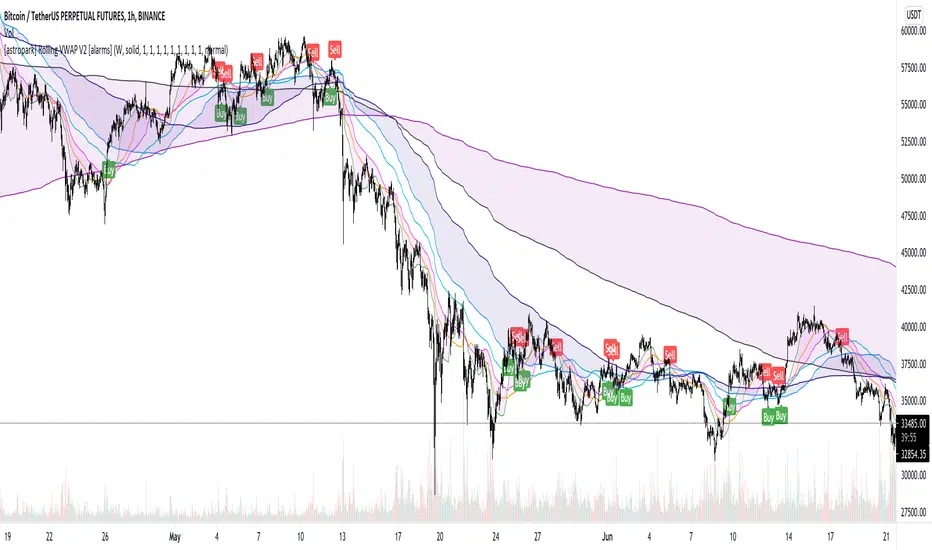
[astropark] Rolling VWAP V2 [alarms]Dear Followers,
today I'm glad to present you yet another awesome Analysis Tool and Strategy, that you may like to use in your trading journey: Rolling VWAP V2 !
This is an upgraded version of my "Progressive VWAP" analysis tool (progressive and rolling are synonymous for me), its description describes quite well what a progressive/rolling vwap is and why they are important to watch:
This indicator can print automatically for you many important Rolling VWAPs:
Daily (D)
2 days (2D)
3 days (3D)
4 days (5D)
Weekly (W)
2 weeks (2W)
Monthly (M)
Quarterly (Q)
Yearly (Y)
As an indicator it will let you:
enable/disable each rolling vwap, change its color and line style and thickness
enable/disable labels and/or price on labels, as well as change their size
As a strategy it will let you:
enable/disable buy/sell signals
choose which strategy to use (all based on rolling vwaps of course)
choose a starting date & time from which to start backtesting
enable/disable individually long and short setups in the backtesting
You should choose low timeframe rolling vwap strategy if you are on a low timeframe, while higher timeframe rolling vwaps are good on medium-high timeframes.
For example D-2D-3D rolling vwap strategies are good at 1h or below, the others on higher timeframes. Backtesting results will help you in understanting this point quite easily.
This indicator works on every timeframe, market and pair. By the way it must be said that, as a bot strategy it has been tested and designed mostly for Bitcoin trading and it works best on 1h or above.
As I always say, all tools are great if you use them correctly: this is not the "Holy Grail", so always use proper money and risk management strategies.
This indicator is the alarms version of the backtesting one you can see here below:
This is a premium indicator , so send me a private message in order to get access to this script.
Vwapbreakout
[astropark] Rolling VWAP V2 [strategy]Dear Followers,
today I'm glad to present you yet another awesome Analysis Tool and Strategy, that you may like to use in your trading journey: Rolling VWAP V2 !
This is an upgraded version of my "Progressive VWAP" analysis tool (progressive and rolling are synonymous for me), its description describes quite well what a progressive/rolling vwap is and why they are important to watch:
This indicator can print automatically for you many important Rolling VWAPs:
Daily (D)
2 days (2D)
3 days (3D)
4 days (5D)
Weekly (W)
2 weeks (2W)
Monthly (M)
Quarterly (Q)
Yearly (Y)
As an indicator it will let you:
enable/disable each rolling vwap, change its color and line style and thickness
enable/disable labels and/or price on labels, as well as change their size
As a strategy it will let you:
enable/disable buy/sell signals
choose which strategy to use (all based on rolling vwaps of course)
choose a starting date & time from which to start backtesting
enable/disable individually long and short setups in the backtesting
You should choose low timeframe rolling vwap strategy if you are on a low timeframe, while higher timeframe rolling vwaps are good on medium-high timeframes.
For example D-2D-3D rolling vwap strategies are good at 1h or below, the others on higher timeframes. Backtesting results will help you in understanting this point quite easily.
This indicator works on every timeframe, market and pair. By the way it must be said that, as a bot strategy it has been tested and designed mostly for Bitcoin trading and it works best on 1h or above.
As I always say, all tools are great if you use them correctly: this is not the "Holy Grail", so always use proper money and risk management strategies.
This is a premium indicator , so send me a private message in order to get access to this script.

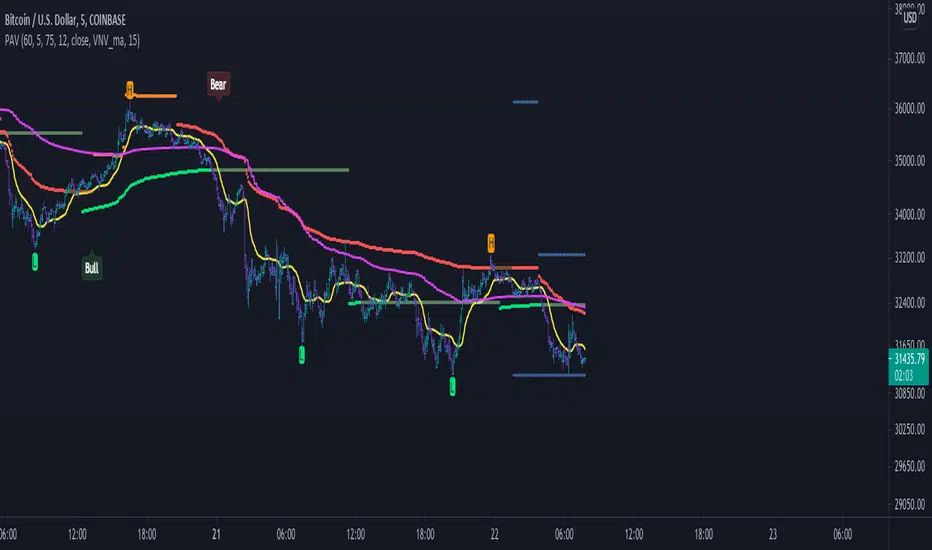
High time frame Pivot Anchored VWAP V1.0Purpose:
-----------
To provide VWAPs anchored on the high and low pivots. I have seen scripts which anchor VWAP on a session or time frame or indeed a time, but not yet one that anchors on pivot points.
Value:
--------
As many have stated, price action tends toward VWAPs. I named the VWAPs anchored on high pivots the Selling VWAP, representing the volume weighted average of the sellers. And the VWAPs anchored on the low pivots, Buying VWAP, representing the volume weighted average of the buyers.
One of these two governs the current price action.
What is unique about this script:
---------------------------------------
- Locates pivots also found in higher time frames (it does not use the Security Function, technically it does not locate high time frame pivots)
- It uses a simple technique to locate the pivots that avoids using "For Loops" , typically used with HTF Pivots and at times can cause time outs
- VWAPs are then anchored on the pivots
- High Pivots are anchored with a VWAP using the High price as the source
- Low Pivots are anchored with a VWAP using the Low price as the source
How to Use It
-----------------
- Choose the higher time frame pivots of interest, the script uses current time frame multiplier
- so on a 1 minute chart, 60 is 1 hour. On a 5 min chart the same multiplier would be 5 hours.
- Choose how many of the higher time frame bars define the pivot, the right side and left side
- the default is 8 and 4, for a 60 multiplier on a 1min chart it implies 4hrs right of the pivot and 8 hrs left of the pivot.
- A Vidya moving average is included
- When the ma crosses over the Selling VWAP then the system is dominated by the buyers and the Buying VWAP provides support
- When the ma crosses under the Buying VWAP then the system is dominated by the sellers and the Selling VWAP provides resistance
It helps by keeping you in a trade, also by using the support/resistance to add to a position.
I make those decisions in the script, and display only the dominating VWAP
Acknowledgements
------------------------
PineCoders for their functions on managing resolution.
LucF for his work on high time frame pivots.
Future considerations
--------------------------
- Provide option to show both VWAPs
- Use a different ma, such as VWMA, or provide a choice.
- Open the script, version 1.0 being what it is
[astropark] Progressive VWAPDearDear Followers,
today another awesome Analysis Tool, that you can use in your trading journey: Progressive VWAP !
If you love vwap, you will love this indicator, as it calculates some special "progressive" / "evolving" vwap levels:
daily vwap named dvwap
2D vwap named 2dvwap
3D vwap named 3dvwap
weekly vwap named wvwap
2W vwap named 2wvwap
Monthly vwap named mvwap
Quarterly vwap named qvwap
Yearly vwap named yvwap
You can:
choose which progressive vwap to show and which to hide
change each line color / thickness / display style (solid or dashed)
choose to show or hide labels and change their size
Why such indicator should be helpful? How can I use it to do profit?
In multiple ways:
when a lower timeframe crosses an higher timeframe progressive vwap, you know sentiment is getting bullish and viceversa if the cross is downwards
price tends to bounce on such progressive vwaps: the higher the timeframe, the more probably the bounce is as well as the magnitude of the breakout of the level
This indicator works on every timeframe, market and pair.
As I always say, all tools are great if you use them correctly: this is not the "Holy Grail", so always use proper money and risk management strategies.
This is a premium indicator , so send me a private message in order to get access to this script.

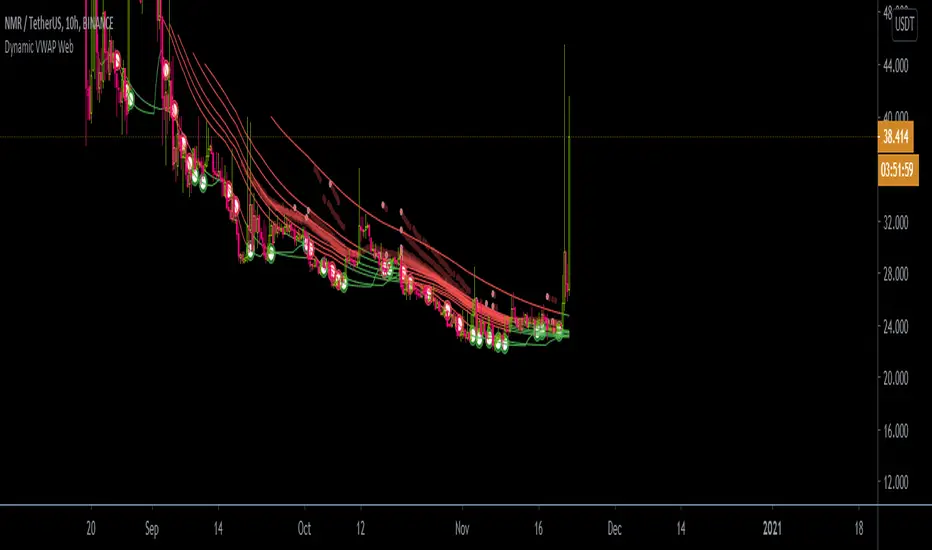
Dynamic VWAP WebNote : The large purple ellipses and shaded boxes are not part of the indicator and have been manually drawn to show how the indicator provides important pattern signals you can recognize. The small red and green dots are however bulit_in and show highs and lows that break key averages to further add to pattern data.
This indicator is built from my Bonfire system and includes VWAP , linear regression , and moving averages combined with dynamic lengths to show key trends, a moving profile, fractal patterns, and data visuals. The VWAP portion of the script is weighed a bit more and automated recognitions provide tons of pattern data and a moving profile that sharply interacts with the price on all levels. *dynamic lengths = lengths change when specific criteria has been met. This is opposed to the default, static or constant length inputs that stay the same unless changed manually.
Things to look for and questions to ask yourself:
a: How is the structure of the indicators flowing? Are the indicators collecting, pinching together, and smoothing out to provide a unanimous direction? How is the price reacting to the indicators? Is the price above, below all, most, or some of the indicators? (MARKED WITH LARGE DRAWN ELLIPSES)
b: What is your interpretation of the deviation between the indicators and the price? Is there a big spread? Is the price seemingly spiking or dropping to touch or grab certain indicator levels briefly while there is still a big spread between unorganized indicators? This can lead to a temporary pivot that does not sustain a long term bear or bull trend.
c: Is the price just above or below the indicators? Does the current trajectory and volume project a break upward, pushing the price through and over the indicators. Is the price bouncing off the lines as live resistance or support? Time is the most powerful force to recon with. The trajectory of the price towards the indicators vs the candle countdown can assist you in predicting if the price will be forced to cross above or below the profile indicators. When price crosses above a collected group of indicators , it's to be considered a bullish move. Likewise, when the price breaks downward on levels it would be considered a time to limit exposure.
d: Notice the difference in the thicker gradient lines above or below the price and more importantly, the absence of these lines compared to the current state of the other indicators. (MARKED WITH DRAWN DARK SHADED BOXES). Are the thick profile lines darker or lighter? Are these lines making sharp moves up or down well below the current price?
e: Keep note of each detail of the signals provided. The smaller green and red dots consistently appear along the (gradient) moving profile levels during specific price interactions with VWAP linear moving profile lines. Though these dots provide minor changes, it's still worth noting for consistent pattern recognition.
f: The built-in red and green rings signal when the price highs and lows breach or interrupt the linear/MA indicator lines. Often these appear in a pattern before and after a bigger move in price. Each asset or stock will have a different pattern or story to tell at different intervals. It is critical that you take the time to look at the patterns at different cycles and learn how to read the overall health of the price compared to the data and historical patterns provided.
g: The gradients fade and darken based on strength.
This is a new way to visualize the current state of an asset. Therefore it will take some time to learn the nuances of Dynamic VWAP WEB. Devote some time to learn the patterns that align with your goals and timeframes.
This is a pay for use indicator. Please message me for access through Tradingview messages.
Payment = Contact for details . A one time fee via cryptocurrency ( BTC ,ETH,LTC, DGB ) preferred.
MACD VWAP IndicatorThis indicator uses a combination of the VWAP, EMA 9 and parts of the MACD in order to detect a bullish or bearish trend.
How to trade it:
Set SL either below or above the VWAP line (orange) and TP to 1:1.5 ratio (depending on last few candles, of course).
If EMA200 is close by then place SL either below or above EMA200 (blue) and TP to 1:1.5 ratio
Important:
Best traded in 15M, 30M => Intraday.
Have fun! :)

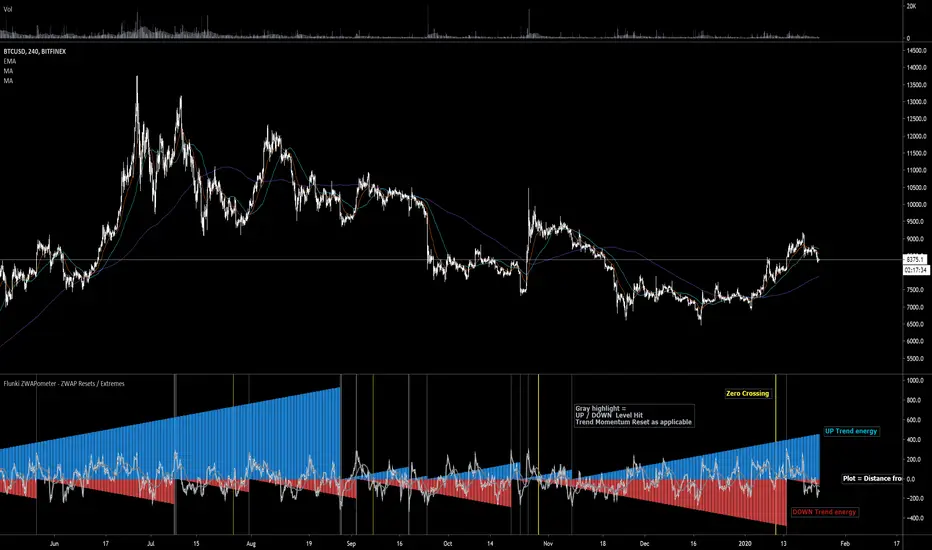
Flunki ZWAPometer - ZWAP Resets / Extremes
Here with another VWAP based indicator, this time using ZWAP (distance from VWAP) and flagging the extremities and crosses of each side, and graphing the bars since the last breach.
This basically gives a Bull / Bear energy / momentum
Yellow highlights = zero crossing , not entirely sure this is useful as of yet, but can give an early warning of a change - let me know if you find a genuine use for it !
Gray highlights = extreme reached, this generally signals exhaustion of the trend energy for Bull or Bear (depending on which side is reset obviously)
May develop further ; add bar colour options and more precise highlights, but only if it's of use to anyone.
Enjoy !
Flunkimoku