WIM-[WorldIsMine]An entry index that adds VWMA as an essence to be aware of trading volume in addition to SMA and BB which are valid in all investment markets. With alert.Pine Script® indicatorby ChoixAlamode6
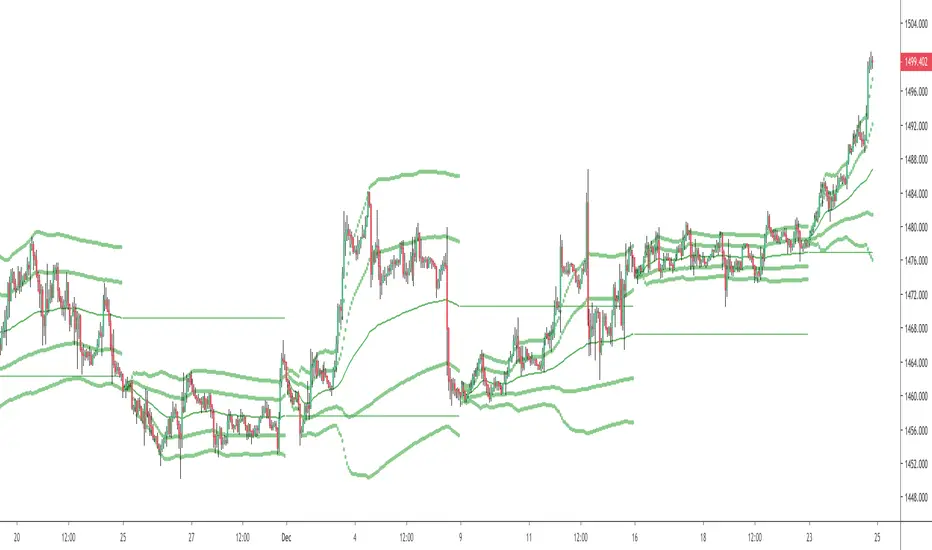
Anchored VWAP w/ Stdev and VWMA CloudThis is a fun little project that allows you to anchor the Volume Weighed Average Price (VWAP) to a specific day and plot up to 4 standard deviations up or down. I've also added a Volume Weighted Moving Average (VWMA) plot and accompanying cloud to more easily visualize how volume-based momentum affects trends. Typically, you'll see price respecting the VWMA Cloud and can expect price bounces off of the VWAP standard deviations. When setting the initial anchor point, it's best to select a day with high volume and volatility. This idea is not 100% original, but I couldn't find 1) a public script combining the ideas and 2) the correct plotting of the standard deviation via accumulation. Happy Trading! FAQ Why is your script Protected? Users like to take my open-source code and charge to use it without my permission. How do I use this to trade? Add it to your chart and see what stacks up with your current setup. I trade Forex, so what looks bad on my charts might look golden on yours. How long have you been doing this? I've been coding for about 8 years and actively trading for 2 years. My degree is in Robotics Engineering and I became obsessed with investing at 22. How do you trade? Hurst + SNR + MESA MAMA + ATR + LSTM + Pure Grid. You can't completely code this setup using Pinescript, but if you learn C++ or Python you're there! Are your returns good? I average 0.68% every weekday or 22.65% monthly, using the method above. Can you build my indicator or strategy? Absolutely! If it hasn't been done before and it improves our community, then consider it done. But can you build an indicator or strategy for me and only me? Citing the house rules, I cannot solicit for any purpose. So saying "PM me" would be a grievous violation of said rules, obviously.Pine Script® indicatorby DasanCUpdated 66409
5 SMA and VWMA indicatorIt shows 5 SMA lines (5,20,50,100,200) and VWMA (volume weighted moving average). VWMA is the best indicator for intraday charts.Pine Script® indicatorby drazen441153
Average Price by Atilla YurtsevenHi Traders, This is one of the most important indicators i have developed and I use it all the time and would like to share it with you. What is Average Price? Average price basically shows you the average of the price for the selected period. Let's say you are analysing in hourly chart and you want to know what is the monthly or weekly average price. This indicator helps you to see the average price of selected period. This is not a VWAP but you can enable VWAP from options. Let's say your favorite period for Average price is 1 month. Average Price indicator will reset at the beginning of the each month and you can still enable volume weighted (I personally don't use VWAP). I have also added deviations of average price. This is very useful option. Works like Bollinger Bands. Optionally, previous period's average price can be plotted onto your charts and they work like support and resistance. Please remember to follow me on TradingView so you will be notified as soon as i share a new script or idea. Disclaimer: This is not financial or investment advice Trade safe, Atilla YurtsevenPine Script® indicatorby AtillaYurtseven44249
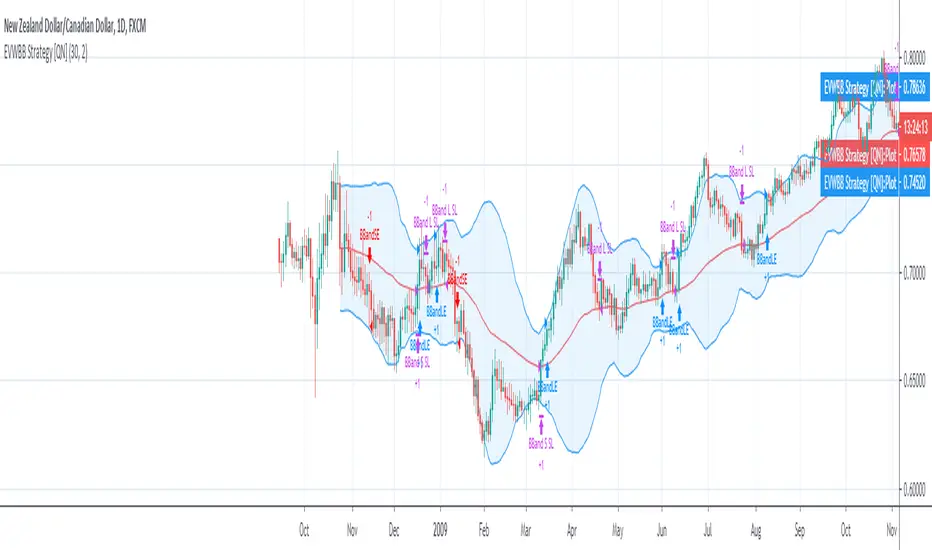
EVWBB Strategy [QuantNomad]It's my new strategy using EVWMA (Elastic Volume Weighted Moving Average). Now I created a Bollinger Bands strategy where basis level is EVWMA. It looks pretty interesting but you have to be careful with the entries/exits on the same bar, I'm using stop orders, so on big moves it happens pretty often. In the next version, I will try to eliminate these issues. Entry for this strategy happens when price crossover upper for long and lower for short. I exit both short and long on basis level. Pine Script® strategyby QuantNomadUpdated 66243
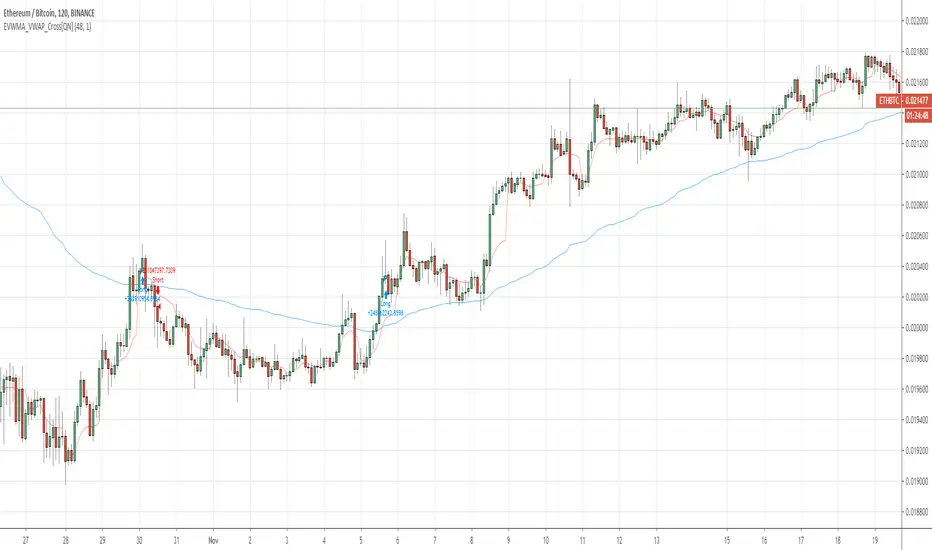
EVWMA VWAP Cross Strategy [QuantNomad]Continue to experiement with VWAP and EVWMA. It seems that just simple crosses between VWAP and EVWMA can be pretty good signals. VWAP is a bit choppy so you can use VWAP smoothing input to smoth it a bit. Here are few other strategies based on EVWMA: EVWMA VWAP MACD Strategy QuantNomad - EVWMA MACD Strategy Pine Script® strategyby QuantNomad66 1.4 K
EVWMA VWAP MACD Alerts [QuantNomad]Study version of EVWMA VWAP MACD Strategy I pulished recently: Pine Script® indicatorby QuantNomad11562
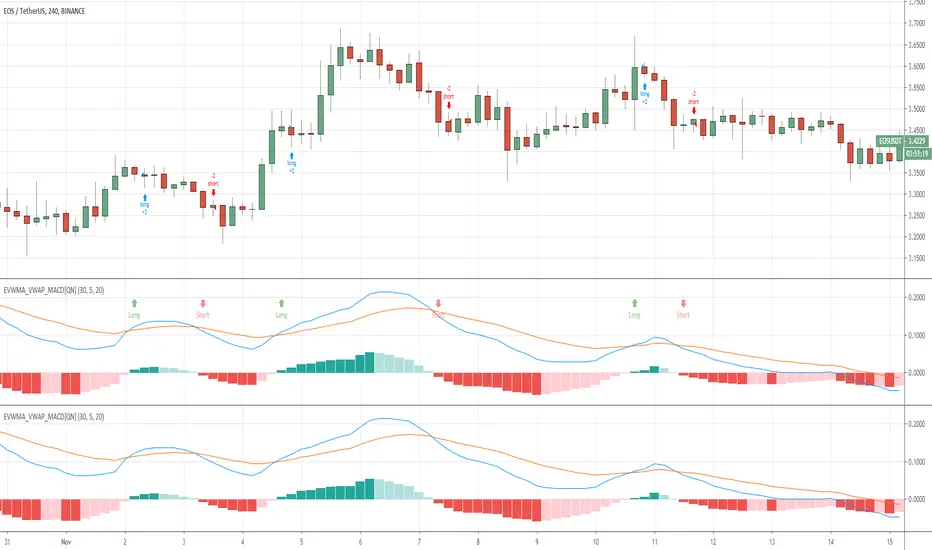
EVWMA VWAP MACD Strategy [QuantNomad]Based on comment of @coondawg71 I tried to compare VWAP and EVWMA. Both are sort of moving averages so I decided to create a MACD based on these 2 indicators. In parameters you can set EVWMA Length and 2 smoothing lengths for "macd" and "signal". Strategy seems to work pretty good at 2h-8h timeframes for crypto. What do you thing about it? Pine Script® strategyby QuantNomad2222 3.5 K
MasterMAThis study demonstrates 15 different common moving averages. SMA, Double SMA, Triple SMA EMA, Double EMA, Triple EMA WMA, Double WMA, Triple WMA VWMA, Double VWMA, Triple VWMA Hull, Double Hull, Triple Hull Buy/Sell alerts are given for crossover/under conditions. Triangles at the bottom, pointing up are buy signals. Triangles at the top, pointing down, are sell signalsPine Script® indicatorby RobertD7723Updated 11148
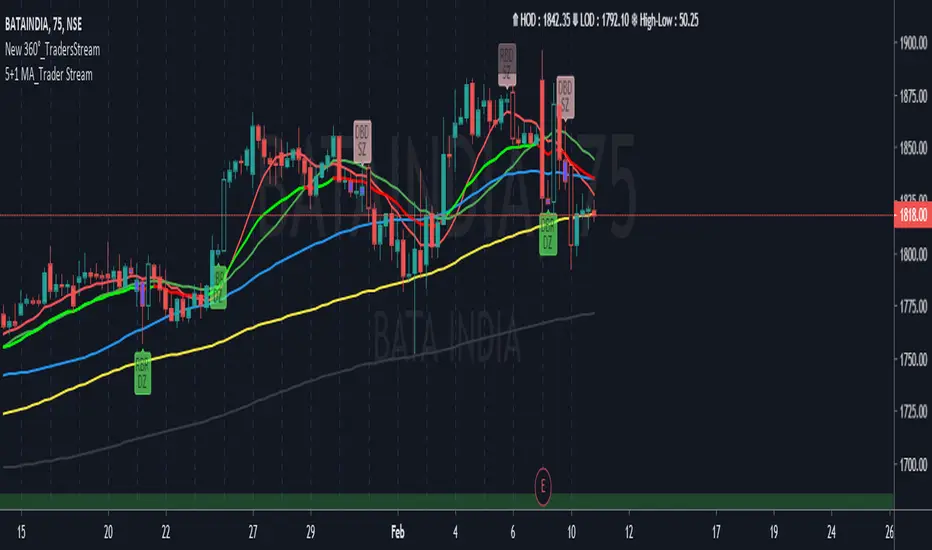
Moving Averages Traders StreamHello Guys this is a new set of Multiple Moving Averages with Bullish and Bearish coloured. Our Tool Includes SMA, EMA, RMA, VMA and VWMA. So if any comments than please.......Pine Script® indicatorby mohsinsait3Updated 1120
QuantNomad - EVWMA MACD StrategyPretty simple EVWMA (Elastic Volume Weighted Moving Average ) MACD Strategy. EVWMA is a quite interesting moving average where the period of the MA is defined from the volume itself. It incorporates volume information in a natural and logical way. The EVWMA can be looked at as an approximation to the average price paid per share. As a volume period, you can use sum of the last x bars volumes. Here are other EVWMA indicators/strategies: EVWMA indicator: EVWMA Cross strategy: Pine Script® strategyby QuantNomad11363
QuantNomad - EVWMA Cross StrategyPretty simple EVWMA (Elastic Volume Weighted Moving Average) Cross Strategy. Long on bullish cross, Short on Bearish Crosss. EVWMA is a quite interesting moving average where period of the MA is defined from volume itself. It incorporates volume information in a natural and logical way. The eVWMA can be looked at as an approximation to the average price paid per share. As a volume period you can use sum of the last x bars volumes. Here is EVWMA as an indicator: Pine Script® strategyby QuantNomad22282
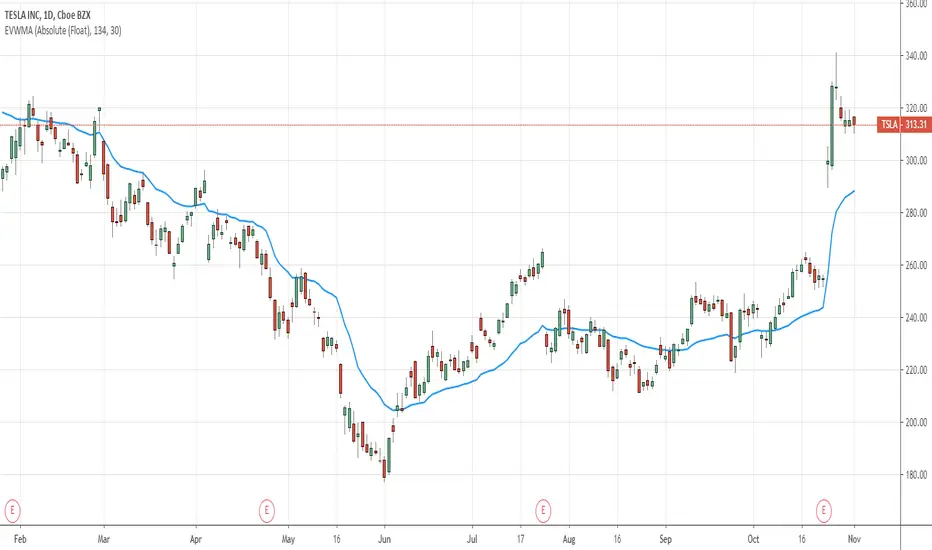
QuantNomad - Elastic Volume Weighted Moving AverageEVWMA is a quite interesting moving average where period of the MA is defined from volume itself. It incorporates volume information in a natural and logical way. The eVWMA can be looked at as an approximation to the average price paid per share. As a volume period you can use: - Absolute volume value, for example floating number of shares. 134M for Tesla for example. - Sum of the last x bars volumes. Indicator was developer by Christian P. Fries, Ph.D. Pine Script® indicatorby QuantNomad55184
Chop FilterIt is common knowledge that most traders lose money by leaving trends too early and not letting profits run. Chop Filter attempts to paint over wrong-colored candles which might psychologically cause traders to bail off the trend. It also tries to detect potential trend reversals (experimental). How it works. Chop Filter highlights wicks with a shaded background based on close relative to a volume-weighted moving average (vwma). If it closes up, or if there are higher lows, it shades the background blue. If it closes down, or there are lower highs, it colors the background red. Finally, it shows a big arrow indicating the direction prices are headed, based on the vwma. The arrow helps me to consider where prices might go, and play out different scenarios, rather than being a true prediction. In fact, it is often wrong when there is a lot of volatility, which can also be a good thing. I find the shaded background has a calming effect that reduces stress. It also helps identify trends in the wicks that are otherwise difficult to see. There are some other options to play with, such as highlighting narrowing or widening price action in yellow or optionally showing the vwma . Have fun!Pine Script® indicatorby Hellork55317
True Strength V2True strength using two stochastic's and a VWMA , can use for cycle indication as well Pine Script® indicatorby Wayne-oUpdated 192
VWMA Trend FilterHere's a simple tool for determining long term trend direction using two Volume Weighted Moving Averages (VWMA). The VWMA's emphasis on volume often makes it a better measurement for trend direction than the more popular Exponential Moving Average (EMA). Trend direction is determined by comparing a fast and slow VWMA. The default length for the fast VWMA is 50 periods, while the slow uses a default length of 200. Both of these lengths can be modified in the input options menu. The default source for the VWMA's is HLC3((high + low + close) / 3). If the fast VWMA is greater than the slow VWMA, then the trend is bullish and the background color is green. If the fast VWMA is less than the slow VWMA, then it is bearish and the background color is red. We included an option to change the candle color based on whether the VWMA's indicate a bullish or bearish trend as well. Overall, this is one of those utility tools that we like to use as an overlay over the main price chart and in conjunction with other signal generating indicators. Its purpose isn't to generate buy and sell signals, but it works well as a visual confirmation tool to help traders gauge trend direction. Pine Script® indicatorby ProfitProgrammers22420
Sinyal GhoibLeading Signal!!! Long entry while long signal appears. Short entry while short signal appears. This signal only effective on BitMex | 5m | XBTUSD. Take profit: 0,6% from entry price Stop loss: 0,6% from entry price Leverage: 10x - 50x For donation BTC: 3E7rUPX7upS8iTj42JdLt7keJVbJLfvMoH ETH: 0x094ed88e4c5a9b225e936586cbc2d61f4a027f68 BitMex Referral: P81ZCO Thank you & happy trading!Pine Script® indicatorby rifkyali22131
The WaveRunner Multiple Moving AveragesThe WaveRunner consists of a Triple Exponential Moving Average (or TEMA). This study first calculates the exponential moving average(EMA) of the security. It then finds the EMA of that first EMA and then finally calculates a third EMA based on the second EMA. Then, we added in a volume weighted moving average, allowing us to place greater emphasis on periods with higher volume. Due to its minimal lag, the triple exponential moving average is a good tool for trend identification and volatility measurement. Adding in a VWMA further improves its accuracy as it provides another way to check the strength of a trend. The first EMA is shown as the green line of circles. The EMA of that line is then plotted as the middle yellow line. Finally, the third EMA is the red line of circles. When the first EMA is greater than the third, it indicates a sustained positive trend and the area between the two lines is filled green. On the other hand, when the third EMA is greater than the first EMA, it indicates a negative trend and the area between the two lines is filled red. Finally, the VWMA is shown as the darker green and red areas both below and above the first EMA. This indicator is best used for trend identification and confirmation, filtering out volatility. Reduced lag allows traders to interpret sharp price fluctuations. Pine Script® indicatorby ProfitProgrammers3329
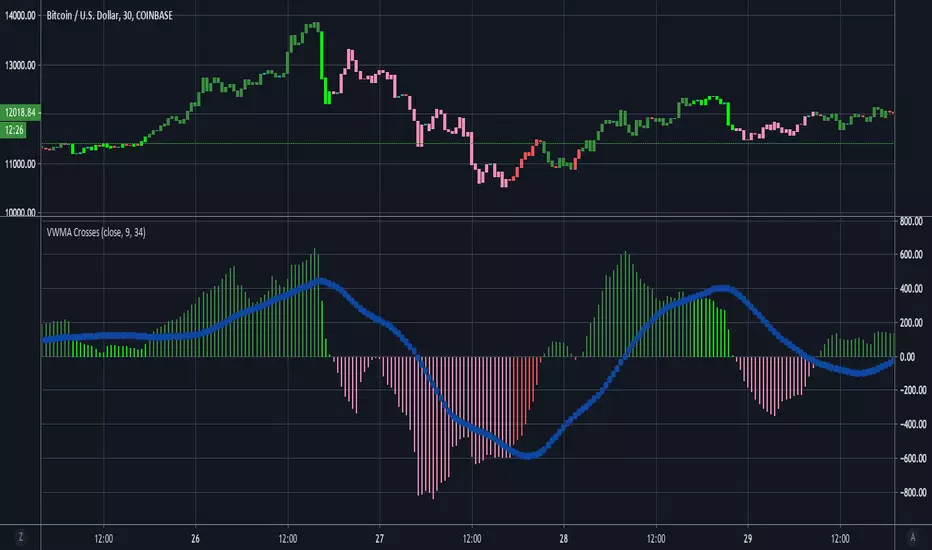
VWMA CrossesThis is a simple tool that gives traders a simple visual representation of Volume-Weighted Moving Average ( VWMA ) crossovers that is pretty similar to the MACD . We don't typically trade solely based on the VWMA , but it is definitely one of our go-to tools when combining multiple indicators. When trading with VWMA's, it is common to enter a position when the fast VWMA crosses over the slow VWMA . In other words, the fast VWMA was previously less than the slow VWMA and is now greater in value than the slow VWMA . Conversely, traders often exit their positions when the fast VWMA crosses under the slow VWMA . This tool plots the absolute value of the difference between the fast and slow VWMA's as a histogram. When the difference between the fast and slow VWMA's is greater than zero (meaning fast > slow), then the bars are green. The bars then turn red when the fast VWMA is less than the slow VWMA . The blue circle-line is a Simple Moving Average of the difference between the two lines. Here's a quick guide to interpreting the chart: if (fast VWMA > slow VWMA ) and (difference < sma of differences) then color = lime green if (fast VWMA > slow VWMA ) and (difference > sma of differences) then color = dark green if (fast VWMA < slow VWMA ) and (difference < sma of differences) then color = light red if (fast VWMA < slow VWMA ) and (difference > sma of differences) then color = dark red ~Happy Trading~Pine Script® indicatorby ProfitProgrammers55817
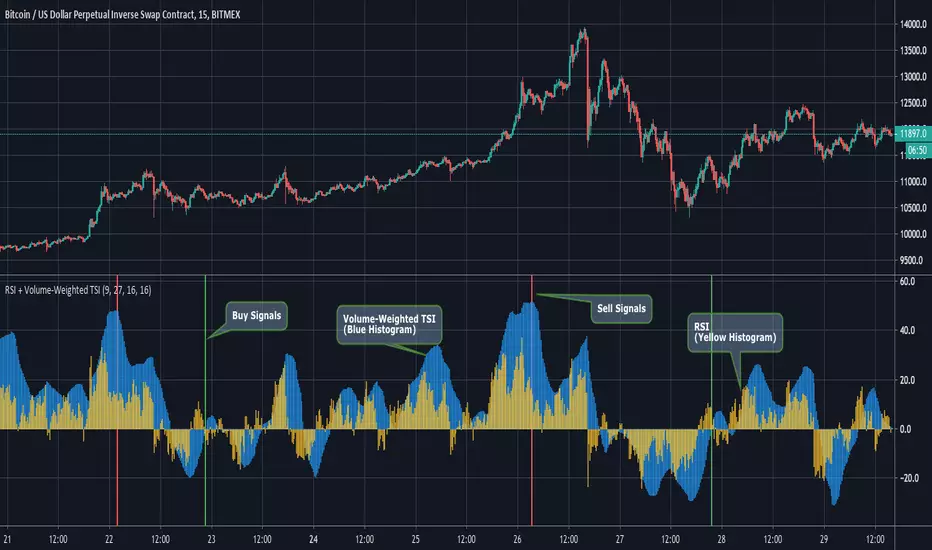
RSI + Volume-Weighted TSIThis indicator combines a standard RSI with a modified TSI. Although a double smoothing process is already used in calculating the normal TSI, we decided to apply a volume weighted moving average of length (length_of_slow_TSI_EMA // 2) to it. This resulted in a smoother TSI that picked up on large-scale swings very nicely. Entry Signals are generated when the Volume-Weighted TSI crosses above zero from negative into positive territory. Exit signals are generated when the TSI is above 40 and then begins its downward fall, along with a declining RSI value. The Graph: The Volume-Weighted TSI is plotted as the blue histogram, wile the RSI is plotted as the yellow histogram. We definitely wanted to go the simplicity route on this one's graphics, since the RSI and TSI are both classic and reliable indicators. The green background highlights indicate an entry signal and red highlights signify an exit signal. Input Options: -length of Slow EMA for TSI -length of Fast EMA for TSI -Length of Volume Weighted MA of TSI. -Length of RSI. ~Happy Trading~Pine Script® indicatorby ProfitProgrammers44180
Double KAMA + VWMAThis study combines a fast and slow Kaufman Adaptive Moving Averages (KAMA) with a fast and slow Volume-Weighted Moving Average(VWMA). The KAMA is definitely one of our favorite moving averages because it takes into account volatility and filters out false signals during periods of insignificant or horizontal price movement. This results in more patient, less impulsive trading. At its most basic, the KAMA's value remains relatively close in value to the price when volatility is low then lags slightly behind it during highly volatile movements and larger trends. We've plotted two Kaufman's Adaptive Moving Averages: -The first KAMA is the slow KAMA, which we use as a trend filter. It is shown on the graph as the thicker solid line that alternates between green and red. When the trend filter KAMA is bullish, the line turns green. It then turns red when bearish. Users can adjust the lengths of the fast and slow EMA for the KAMA's calculation in the input option menu, but it is important to remember that the number of periods should remain high in comparison to the fast KAMA as this allows it to track long-term price movements and trends. -We then include a fast KAMA which has shorter EMA Lengths to focus in on movements within a smaller timeframe. NOTE: The fast KAMA is only plotted when the trend filter KAMA is generating bullish signals. It is shown as the alternating pink and teal line above the main green line. When the fast KAMA is increasing, its line and the area between it and the slow KAMA are filled teal. When the fast KAMA is falling, its line and the area between the fast and slow KAMA lines are colored pink. This helps with timing exits. Lastly, we've included a fast and slow VWMA to time long entries. These are only plotted when the Trend Filter KAMA is bearish. The fast VWMA is the teal solid line under the trend filter KAMA and the slow VWMA is the pink line. Optimal entries will occur when the fast VWMA crosses above the slow VWMA. When the slow VWMA is greater than the fast VWMA, the area between the two lines is filled red, while the same area is filled teal when the fast VWMA is greater than the slow. I've included entry signals (shown on the screenshot as the lime green background highlights), but this is the basic version of the indicator. If you're interested in taking a look at the full version with alerts and entry + exit signals, feel free to send us a message! Pine Script® indicatorby ProfitProgrammers11156
VWMA/SMA Breakout and Divergence DetectorThis indicator compares four different values : -Fast Simple Moving Average(SMA) -Fast Volume Weighted Moving Average(VWMA) -Slow SMA -Slow VWMA Comparing SMA's and VWMA's of the same length is a common trading tactic. Since volume is not taken into consideration when calculating Simple Moving Averages, we can gain valuable insights from the difference between the two lines. Since volume should be increasing along with an upwards price movement, the VWMA should be greater than the SMA during a volume-supported uptrend. Thus, we can confirm an uptrend if the VWMA remains greater than the SMA. If the VWMA falls under the SMA in the midst of an upwards price movement, however, that indicates bearish divergence. The opposite is true for downtrends. If price is decreasing and volume is decreasing at the same time (as it should), then we can confirm the downtrend. Interpreting the Graph: If the slow SMA is greater than the slow VWMA, then the area representing the difference between the two lines is filled in red. If the slow VWMA is greater than the slow SMA, however, the area between the two is filled green. If the fast SMA is greater than the fast VWMA, then the area between the two dotted lines is filled in red. On the other hand, the area will be filled green if the fast VWMA is greater than the slow SMA. In addition to spotting divergences and confirming trends, the four lines can be used to spot breakouts. Typically, a VWMA crossover will precede the SMA crossover. When the fast VWMA crosses over the slow VWMA and then a SMA crossover follows shortly after, then it is a hint that a bullish trend is beginning to form. Pine Script® indicatorby ProfitProgrammers1414 1.8 K