Demand Supply Indicator With AlertsThe Demand Supply Zone indicator with Alerts helps in identifying the Demand Supply zones on chart by pinpointing them.
The indicator looks for Demand Zone patterns, Drop-Base-Rally or Rally-Base-Rally , when such pattern is identified the indicator marks it on the chart. Likewise, if the indicator identifies Supply Zone patterns, Rally-Base-Drop or Drop-Base-Drop the indicator marks it as Supply Zone. The basing candles are changed to Blue color and the Legout candles are changed to Black color by default.
Using the Demand Supply Zone Indicator with Alerts you can also set Alerts on your favourite scripts and timeframes, to get notification when Demand Supply Zones are formed.
List of all the features is provided below.
1. You can choose which patterns the indicator should identify.
2. Number of candles in basing from 1 to 6.
3. Strength of the legout.
4. Identify follow-through patterns.
5. Hide Single Legout patterns.
6. Strength of the first legout in follow through pattern.
7. Strength of the second legout in the follow through pattern.
8. Customize Basing Color
9. Customize Legout Color
10. Display Pattern Name
11. Display Proximal and Distal Values
12. Color customization for Demand Supply Zone Labels
13. Set Alerts based on Demand Supply Zone formation
To set Alerts follow the steps provided below.
1. Go to the symbol chart and select the timeframe on which you want to set Alerts.
2. Select Alerts Tab and click on Create Alert, shortcut key Alt+A
3. In Condition Select, Demand Supply Indicator With Alerts
4. In Options, select Once Per Bar Close
5. Select expiry as per your preference or keep it open-ended
6. Select Alerts Actions as per your preference
7. Alert name is optional
8. Default message is “Zone Alert” and can be modified
9. Click on Create and in the warning window select Continue Anyway
Once you have active alert, you will keep getting notification whenever a Demand/Supply zone in identified on the symbol and time frame you selected.
Use the link below to obtain access to this indicator.
Zone

CHOP Zone Entry Strategy + DMI/PSAR ExitThis is a Strategy with associated visual indicators and Long/Short and Reverse/Close Position Alerts for the Choppiness Index (CHOP) . It is used to determine if the market is choppy (trading sideways) or not choppy (trading within a trend in either direction). CHOP is not directional, so a DMI script was ported into this strategy to allow for trend confirmation and direction determination; it consists of an Average Directional Index (ADX) , Plus Directional Indicator (+DI) and Minus Directional Indicator (-DI) . In addition, a Parabolic SAR is also included to act as a trailing stop during any strong trends.
Development Notes
---------------------------
This indicator, and most of the descriptions below, were derived largely from the TradingView reference manual. Feedback and suggestions for improvement are more than welcome, as well are recommended Input settings and best practices for use.
www.tradingview.com
www.tradingview.com
www.tradingview.com
Recommend using the below DMI and PSAR indicators in conjunction with this script to fully visualize and understand how entry and exit conditions are chosen. Variable inputs should correlate between the scripts for uniformity and visual compatibility.
THANKS to LazyBear and his Momentum Squeeze script for helping me quickly develop a momentum state model for coloring the Chop line by trend.
Strategy Description
---------------------------
CHOP produces values that determine whether the market is choppy or trending . The closer the value is to 100 , the higher the choppiness levels , while the closer it is to 0 , the stronger the market is trending . Territories for both levels, and their associated upper and lower thresholds, are popularly defined using the Fibonacci Retracements, 61.8 and 38.2.
Basic Use
---------------------------
CHOP is often used to confirm the market condition to help you stay out of sideways markets and only enter when there is movement or imminent explosions. When readings are above the upper threshold, continued sideways movement may be expected, while readings below the lower threshold are typically indicative of a continuing trend. It is also used to anticipate upcoming trendiness changes, with the general belief that extended periods of consolidation (sideways movement) are followed by extended periods of strong, trending, directional movement, and vice versa.
One limitation in this index is that you must be cautious in deciding whether the range or trend will likely continue, or if it will reverse.
Confidence in price action and trend is higher when two or more indicators are in agreement -- while this strategy combines CHOP with both DMI and PSAR, we would still recommend pairing with other indicators to determine entry or exit trade opportunities.
Recommend also choosing 'Once Per Bar Close' when creating alerts.
Inputs
---------------------------
Strategy Direction - an option to only trade Short, Long, Both, or only in the direction of the Trend (Follow Trend is the Default).
Sensitivity - an incremental variable to test whether the past n candles are in the same trend state before triggering a delayed long or short alert (1 is the Default). Can help filter out noise and reduces active alerts.
Show Chop Index - two visual styles are provided for user preference, a visible Chop line with a background overlay, or a compact column and label only view.
Chop Lookback Period - the time period to be used in calculating CHOP (14 is the Default).
Chop Offset - changing this number will move the CHOP either forwards or backwards relative to the current market (0 is the Default).
Smooth Chop Line and Length - if enabled, the entered time period will be used in calculating a smooth average of the index (Enabled and 4 are the Defaults).
Color Line to Trend Direction - toggles whether the index line is colored to visually depict the current trend direction (Enabled is the Default).
Color Background - toggles the visibility of a background color based on the index state (Enabled is the Default).
Enable DMI Option - if enabled, then entry will be confirmed by and dependent on the ADX Key Level, with any close or reversal confirmed by both ADX and +/-DI to determine whether there is a strong trend present or not (Enabled is the Default).
ADX Smoothing - the time period to be used in calculating the ADX which has a smoothing component (14 is the Default).
DI Length - the time period to be used in calculating the DI (14 is the Default).
ADX Key Level - any trade with the ADX above the key level is a strong indicator that it is trending (23 to 25 is the suggested setting).
Enable PSAR Option - enables trailing stop loss orders (Enabled is the Default).
PSAR Start - the starting value for the Acceleration Force (0.015 is our chosen Default, 0.02 is more common).
PSAR Increment - the increment in which the Acceleration Force will move (0.001 is our chosen Default, 0.02 is more common).
PSAR Max Value - the maximum value of the Acceleration Factor (0.2 is the Default).
Color Candles Option - an option to transpose the CHOP condition levels to the main candle bars. Note that the outer red and green border will still be distinguished by whether each individual candle is bearish or bullish during the specified timeframe.
Note too that if both DMI and PSAR are deselected, then close determinations will default to a CHOP reversal strategy (e.g., close long when below 38.2 and close short when above 61.8). Though if either DMI or PSAR are enabled, then the CHOP reversal for close determination will automatically be disabled.
Indicator Visuals
---------------------------
For the candle colors, black indicates tight chop (45 to 55), yellow is loose chop (38.2 to 45 and 55 to 61.8), dark purple is trending down (< 38.2), and dark blue is trending up (> 61.8).
The background color has additional shades to differentiate a wider range of more levels…
• < 30 is dark purple
• 30 to 38.2 is purple
• 38.2 to 45 is light purple
• 45 to 55 is black
• 55 to 61.8 is light blue
• 61.8 to 70 is blue
• > 70 is dark blue
Long, Short, Close, and Reverse labels are plotted on the Chop line, which itself can be colored based on the trend. The chop line can also be hidden for a clean and compact, columnar view, which is my preferred option (see example image below).
Visual cues are intended to improve analysis and decrease interpretation time during trading, as well as to aid in understanding the purpose of this strategy and how its inclusion can benefit a comprehensive trading plan.
DMI and Trend Strength
---------------------------
To analyze trend strength, the focus should be on the ADX line and not the +DI or -DI lines. An ADX reading above 25 indicates a strong trend , while a reading below 20 indicates a weak or non-existent trend . A reading between those two values would be considered indeterminable. Though what is truly a strong trend or a weak trend depends on the financial instrument being examined; historical analysis can assist in determining appropriate values.
DMI exits trade when ADX is below the user selected key level (e.g., default is 25) and when the +/- DI lines cross (e.g., -DI > +DI exits long position and +DI > -DI exits short position).
PSAR and Trailing Stop
---------------------------
PSAR is a time and price based indicator that excels at measuring direction and duration, though not the actual strength of a trend, which is why we use this in conjunction with DMI. It is also included in this script as a trailing stop option to maximize gains during strong trends and to mitigate any false ADX strengthening signals.
This creates a parabola that is located below the candle during a Bullish trend and above during a Bearish trend. A buy or reversal is signaled when the price crosses above or below the Parabolic SAR.
Long/Short Entry
---------------------------
1. CHOP must be over 61.8 (long) or under 38.2 (short).
2. If DMI is enabled, then the ADX signal line must be above the user selected Key Level (default is 25).
3. If Sensitivity is selected, then that past candle must meet the criteria in step 1, as well as all the intermediate candles in between.
4. If "Follow Trend" is selected and PSAR is enabled, then a long position can only open when the momentum and PSAR are in an uptrend, or short when both are in a downtrend, to include all intermediate candles if the Sensitivity option is set on a past candle.
Close/Reverse
---------------------------
1. If DMI is enabled, then a close flag will be raised when the ADX signal drops below the Key Level (of 25), and -DI crosses over +DI (if long), or +DI crosses over -DI (if short).
2. If PSAR is enabled, then a close flag will be raised when the current trend state is opposite the last state.
3. If both DMI and PSAR are disabled, then a close flag will be raised if the Chop line drops under 38.2 (if long) or goes over 61.8 (if short).
4. If a Long or Short Entry is triggered on the same candle as any of the above close flags, then the position will be reversed, else the position will be closed.
Strategy Alerts
---------------------------
1. Long Entry
2. Short Entry
3. Reverse
4. Close
The provided backtest result is based on a position sizing of 10% equity with 100k initial capital. When testing SPX, disabling the DMI performed the best, but EURUSD performed poorly without it enabled, and TSLA had a small reduction in net profit. Timeframe likewise differed between commodities with TSLA performing best at 30M, SPX at 15M, and EURUSD at 4H. I do not plan on using this as a standalone strategy, but I also was expecting better results with the inclusion of EMI and PSAR to compliment the CHOP. Key elements of this script will likely be included in future, more holistic strategies.
Disclaimer
---------------------------
Past performance may not be indicative of future results. Due to various factors, including changing market conditions, the strategy may no longer perform as well as in historical backtesting. This post and the script are not intended to provide any financial advice. Trade at your own risk.
No known repainting, though there may be if an offset is introduced in the Inputs. I did my best not to code any other variables that repaint, but cannot fully attest to this fact.

Automatic FibonacciFibonacci retracements are popular among technical traders. In technical analysis, a Fibonacci retracement is created by taking two extreme points (usually a peak and a trough) on a stock chart and dividing the vertical distance by the key Fibonacci ratios of 23.6%, 38.2%, 50%, 61.8%, and 100%. Basic fibo levels are often known to be 14.6%, 23.6%, 38.2%, 50%, 61.8%, 76.4%, 88.6% and 100%.
This indicator will draw the fibonacci levels automatically. Once these levels are identified, horizontal lines are drawn and used to identify possible support and resistance levels including zones. The fibo levels on this indicator gives you the option to use basic fibo or new paradigm fibo levels. New paradigm fibo levels may be new to most traders, however, the application of new paradigm fibo does allow one to trade with least risk due to the precision of the price action surrounding the fibo levels and zones.
One of the most efficient and great ways to apply this auto fibo indicator and the new paradigm fibo is by only leaving the fibo levels that do have hits and un-selecting the fibo levels that do not have any. You can further remove any other levels so you can trade the zones that these fibo levels create.
In addition, you can also switch the timeframe of the fibo from 1D to different number of days to 1W.

Love.Gunfire - Giant All For One 巨人VIPGiant is All For One , the Last special version for all markets, optimized by Love.Gunfire from Gann. Each one contains natural numbers. If you want to know the recent support. resistance and trends, read on.
Only disciples who have learned "Giant Weapons" can select VIPs to use and the version will be continuously updated.
There the usage settings:
Enable/Disable signals on chart
Enable/Disable XTV based on trend
Enable/Disable label code to smart trade
How does it work?
Basic usage
After the small/medium giant appears BUY, and above T line, may be you can consider the operation of buying
After the small/medium giant appears SELL, and below T line, may be you can consider the operation of selling
What are the signals?
Advanced usage
The small/medium giant cooperates with the giant weapon operation to confirm the upward trend and consider buying
The small/medium giant cooperates with the giant weapon operation to confirm the downward trend and consider selling
For giants to operate, no matter how to make any transaction, they must have the mind of "continuing to stop making profits is the emperor's way, and strictly guarding against erosion is a virtue."
Want to get this indicator today!
For access, please DM us or visit the link/Telegram below in our Signature.
Contact: Love.Gunfire
US30 CURRENCYCOM:US30
GOLD OANDA:XAUUSD
HKEX:700
FX:EURUSD
BINANCE:BTCUSDT
--------------------------------------------------------------------------------------------
巨人是結合天地為一。特別的版本可以應用全球商品,是由彥暉從江恩中使用八多年來優化而來,每一個都含有自然的數字,如果想知道近來的支持、阻力和趨勢,一定不可錯過。
更新設定方法 :
開啟/關閉 訊號
開啟/關閉 XTV趨勢
開啟/關閉 數字
如何使用?
基本使用方法 :
待小/中巨人出現BUY後配合T線以上 ,可考慮買入的操作動作。
待小/中巨人出現SELL後配合T線以下,可考慮沽空的操作動作。
訊號是什麼?
進階使用方法 :
小/中巨人配合巨人兵器操作,確認向上的趨勢可考慮買入。
小/中巨人配合巨人兵器操作,確認向下的趨勢可考慮沽空。
暫時只開放給「巨人兵器」的弟子和特選VIP使用,版本會持續更新。
巨人操作,無論做任何交易,必須要有「不斷止賺是皇道,嚴守止蝕是美德。」的心思。
立刻行動,良機勿失 !
想獲取權限,請給本族訊息或訪問Telegram,本族簽名中的以下鏈接。
請聯絡 : Love.Gunfire
US30 CURRENCYCOM:US30
GOLD OANDA:XAUUSD
HKEX:700
FX:EURUSD
BINANCE:BTCUSDT

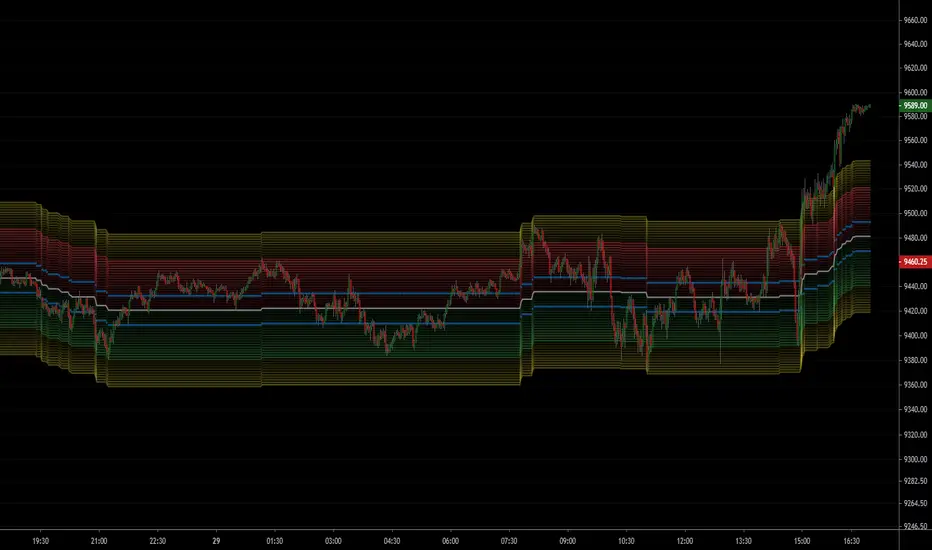
Chop Zone 9000 Chop Zone 9000 is based off Chop Zone by E.W Dreiss. Unlike the original Chop Zone, the main use for this iteration is support and resistance. There are 5 bars and each one represents a line of resistance. There will be areas where all red bars seem to clear up magically— this is due to gap ups or breakouts. The greatest benefit from this indicator is the ability to see if breakout attempts are successful. If the indicator sinks back into the red, then it is obvious that the trade should be abandoned.
I have implemented several alerts in this script. The most important alerts are the level 5 break, where the 5th bar is blue. It is common for price to stagnate if only the first few rows are blue. Therefore, I suggest it is certainly valuable to simply wait for all levels to clear before entering a trade.

[Trend] Support- & Resistance Levels/Zones (Expo)- Trend - Support & Resistance Levels/Zones (Expo) automatically identifies and displays support and resistance levels based on the direction of the trend.
Levels/Zones are displayed where there is a high probability that price will find Support in positive trends and Resistance in negative trends.
Trend Cloud and Trend Detection Line can be enabled.
The indicator can be used standalone or as a part of your current trading strategy.
Real-time
No repainting
Works on any market
HOW TO USE
1. Use the indicator to identify where the price can find support and resistance Levels/Zones in trends.
2. Use the indicator to identify the trend direction.
INDICATOR IN ACTION
4 hour chart
I hope you find this indicator useful , and please comment or contact me if you like the script or have any questions/suggestions for future improvements. Thanks!
I will continually work on this indicator, so please share your experience and feedback as it will enable me to make even better improvements. Thanks to everyone that has already contacted me regarding my scripts. Your feedback is valuable for future developments!
ACCESS THE INDICATOR
• Contact me on TradingView or use the links below
-----------------
Disclaimer
Copyright by Zeiierman.
The information contained in my scripts/indicators/ideas does not constitute financial advice or a solicitation to buy or sell any securities of any type. I will not accept liability for any loss or damage, including without limitation any loss of profit, which may arise directly or indirectly from the use of or reliance on such information.
All investments involve risk, and the past performance of a security, industry, sector, market, financial product, trading strategy, or individual’s trading does not guarantee future results or returns. Investors are fully responsible for any investment decisions they make. Such decisions should be based solely on an evaluation of their financial circumstances, investment objectives, risk tolerance, and liquidity needs.
My scripts/indicators/ideas are only for educational purposes!

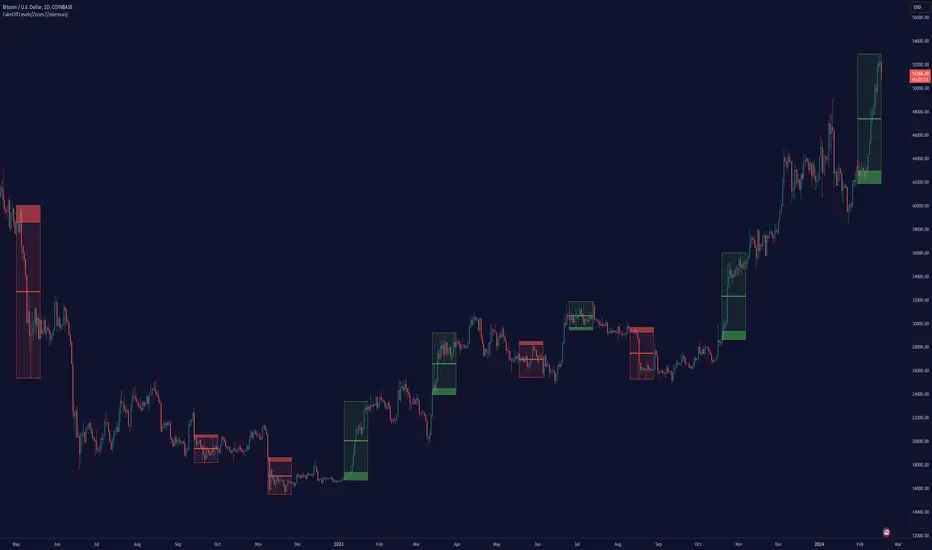
TakeOff Levels/Zones (Expo)TakeOff Levels/Zones (Expo) automatically identifies and displays support and resistance levels based on momentum.
Levels/Zones are displayed where there is a high probability that price can takeoff. Traders should look for breakouts from the Level/Zone.
If the price doesn't breakouts from the SR level/zone there's a chance that the market has topped or bottomed out.
The indicator can be used standalone or as a part of your current trading strategy.
Real-time
No repainting
Works on any market
HOW TO USE
1. Use the indicator to identify where the price can takeoff.
2. Use the indicator to identify potential breakouts.
3. Use the indicator to identify potential reversal points.
INDICATOR IN ACTION
1 min chart
I hope you find this indicator useful , and please comment or contact me if you like the script or have any questions/suggestions for future improvements. Thanks!
I will continually work on this indicator, so please share your experience and feedback as it will enable me to make even better improvements. Thanks to everyone that has already contacted me regarding my scripts. Your feedback is valuable for future developments!
ACCESS THE INDICATOR
• Contact me on TradingView or use the links below
-----------------
Disclaimer
Copyright by Zeiierman.
The information contained in my scripts/indicators/ideas does not constitute financial advice or a solicitation to buy or sell any securities of any type. I will not accept liability for any loss or damage, including without limitation any loss of profit, which may arise directly or indirectly from the use of or reliance on such information.
All investments involve risk, and the past performance of a security, industry, sector, market, financial product, trading strategy, or individual’s trading does not guarantee future results or returns. Investors are fully responsible for any investment decisions they make. Such decisions should be based solely on an evaluation of their financial circumstances, investment objectives, risk tolerance, and liquidity needs.
My scripts/indicators/ideas are only for educational purposes!
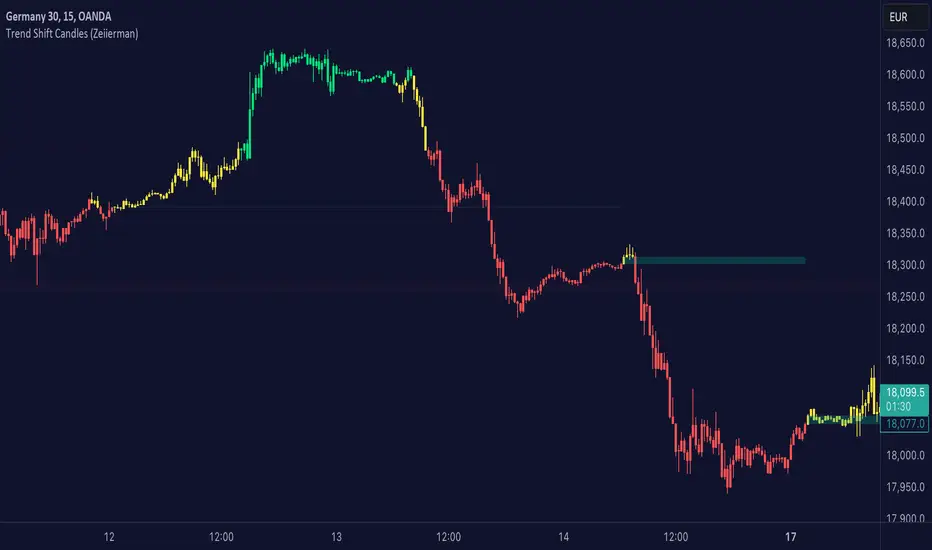
Trend shift Candles (Expo)Trend shift Candles (Expo) identifies where the market characteristics change. Trend shifts often occur in these areas. This is visualized with white candlesticks and Zones.
-> When the market enters a positive trend the candlesticks become green and when the market enters a negative trend the candlesticks become red.
-> The user can choose which timeframe to use. Vwap can be enabled as an input source instead of using price.
-> Please play around with the settings, I haven't set them to any specific values.
HOW TO USE
1. Use the indicator to identify the direction of the trend.
2. Use the indicator to identify trend changes.
-> Visual Order should be set to "Bring to Front" in order to see the color of the candles.
INDICATOR IN ACTION
4 hour chart
The indicator work on Heikin Ashi, Candles, Bars, Renko, Line Break, Kagi, and Point & Figure chart.
I hope you find this indicator useful , and please comment or contact me if you like the script or have any questions/suggestions for future improvements. Thanks!
I will continually work on this indicator, so please share your experience and feedback as it will enable me to make even better improvements. Thanks to everyone that has already contacted me regarding my scripts. Your feedback is valuable for future developments!
ACCESS THE INDICATOR
• Contact me on TradingView or use the links below
-----------------
Disclaimer
Copyright by Zeiierman.
The information contained in my scripts/indicators/ideas does not constitute financial advice or a solicitation to buy or sell any securities of any type. I will not accept liability for any loss or damage, including without limitation any loss of profit, which may arise directly or indirectly from the use of or reliance on such information.
All investments involve risk, and the past performance of a security, industry, sector, market, financial product, trading strategy, or individual’s trading does not guarantee future results or returns. Investors are fully responsible for any investment decisions they make. Such decisions should be based solely on an evaluation of their financial circumstances, investment objectives, risk tolerance, and liquidity needs.
My scripts/indicators/ideas are only for educational purposes
NSDT ES Midline Zones**DESIGNED FOR ES/MES** This script provides an easy visualization of potential reversion zones to take trades back to the intraday midline. A common use would be to enter a position once price reached the outer yellow zones and retreats to either the red zone (for a short toward the midline) or a green zone (for a long back to the midline).

NSDT NQ Midline Zones**DESIGNED FOR NQ/MNQ** This script provides an easy visualization of potential reversion zones to take trades back to the intraday midline. A common use would be to enter a position once price reached the outer yellow zones and retreats to either the red zone (for a short toward the midline) or a green zone (for a long back to the midline).
NSDT Triple KeltnerA different spin on Keltner Channels. Using 3 channels of varying widths provides a good visual for potential entries off of extremes. Normal channel is center, green and red "zones" could be used as potential entry/exit areas, and the outside yellow zones may be viewed as extremes (signifying potential breakouts or strong reversal areas).

NSDT Daily Gap RangeSimple script that plots the range between the previous day close and the current day open. This makes it easier to reference the gap up or gap down zone throughout the day.

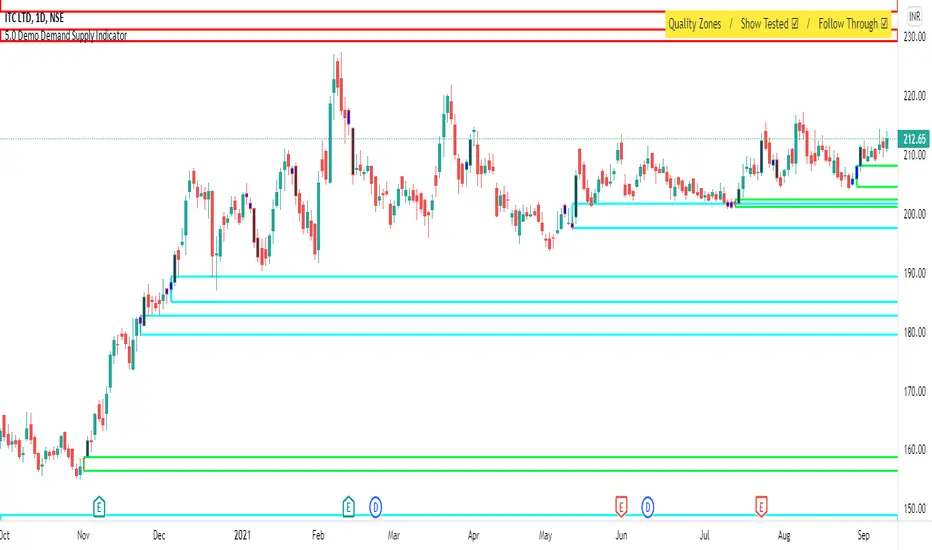
Demo - Demand Supply Zone IndicatorDemand Supply Zone indicator automatically pin points the demand and supply zone on the charts. The demo version will only identify zones on daily timeframe.
Sideways Money - Bitcoin BeatsHello, Hello, Hello,
And welcome back to Bitcoin Beats.
This is another version of my previous script, "Range Indicator - Bitcoin Beats".
Designed initially for breakouts but shows adaptive ranges and consolidation in XBTUSD(Haven't tested other assets but should do the same thing).
If we are consolidating (which is most of the time) a good strategy to trade would be to trade ranges. However, as soon as you spot the range it can feel like the range has changed so you lose out on making the monies.
This indicator plots out the average range in a consolidation.
It also shows you when the range has broken in a direction that it previously hasn't broken in. This essentially signifies the the trend changing and gives warning that trading the range may no longer be valid.
There are a few ways to trade this indicator and I will explain 2 of them here.
PLEASE TRADE AT YOUR OWN RISK. YOUR FUNDS ARE YOUR RESPONSIBILITY.
IF YOU TRADE WITH THESE STRATEGIES, YOU ARE TO BLAME FOR YOUR OWN LOSSES.
BY USING THIS INDICATOR YOU AGREE THAT I WILL NOT BE HELD LIABLE IN THE CASE OF YOU LOSING FUNDS.
Strategy 1:
- Have 2 bitmex accounts open.
- Use on the 30m, 1h, 3h or 12h.
- Long AND Short on both accounts when we hit the middle area. This is called the "Reload Zone".
- When we hit the edge of each side of the plotted range, close the positions in profit.
- You will then have 1 trade underwater.
- If the range is solid, the price will move back to the Reload Zone in which you reload you position that you took profit with.
- You then have both a Long AND Short open after 1 profitable trade.
- Rinse and repeat until you get the "STRATEGY CAUTION" message signifying that the range will most likely break soon.
Strategy 2(least profitable):
- When the "STRATEGY CAUTION" Message appears, you can long or short depending on which side it breaks toward.
- If we break down, short.
- If we break up, Long.
I wouldn't advise this second strategy if you are a beginner as the results are inconclusive and it's more of a hybrid trading strategy, meaning you have to know how to trade with price action flowing.
Usually if it is appearing volatile, you can go to a higher time frame and find the exact range it's catering to, adjusting your strategy accordingly.
See you soon,
Goodbye, from Bitcoin Beats.

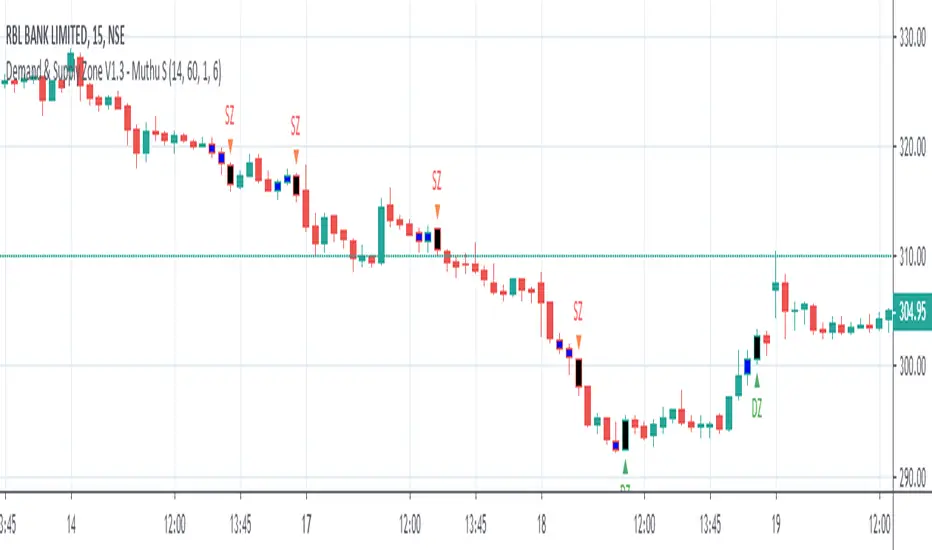
Demand & Supply Zone - Muthu SThis indicator marks Demand and Supply Zone on the chart based on various inputs. It also marks Boring candle in Blue colour & Explosive Candle in Black colour.
Prior knowledge of Demand and Supply Zone is mandatory to use this indicator effectively.
Kindly do your own math (based on your experience & knowledge) to identify the zones along with this indicator.
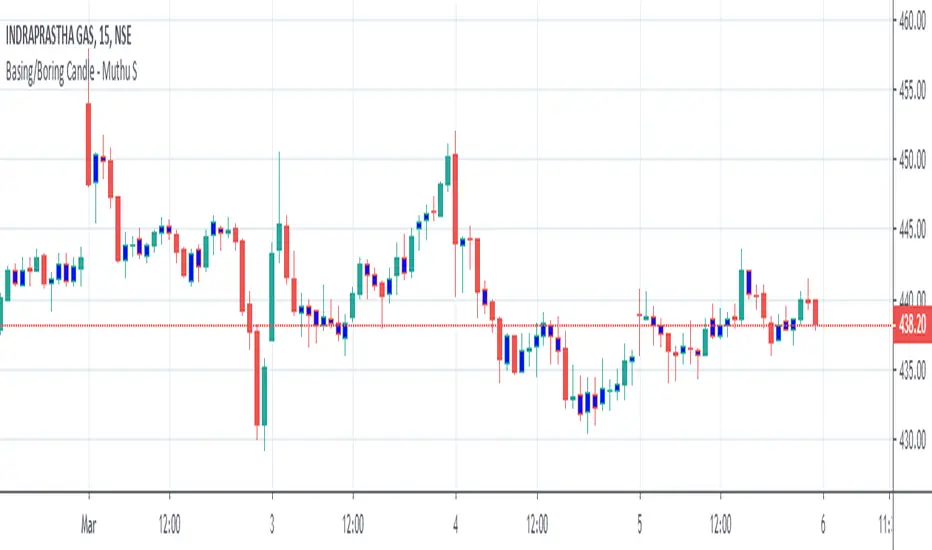
Boring Candle - Muthu SThis Indicator marks Boring Candle on the chart based on the input ATR Range.
Adaptive Price Zone Backtest The adaptive price zone (APZ) is a volatility-based technical indicator that helps investors
identify possible market turning points, which can be especially useful in a sideways-moving
market. It was created by technical analyst Lee Leibfarth in the article “Identify the
Turning Point: Trading With An Adaptive Price Zone,” which appeared in the September 2006 issue
of the journal Technical Analysis of Stocks and Commodities.
This indicator attempts to signal significant price movements by using a set of bands based on
short-term, double-smoothed exponential moving averages that lag only slightly behind price changes.
It can help short-term investors and day traders profit in volatile markets by signaling price
reversal points, which can indicate potentially lucrative times to buy or sell. The APZ can be
implemented as part of an automated trading system and can be applied to the charts of all tradeable assets.
WARNING:
- For purpose educate only
- This script to change bars colors.
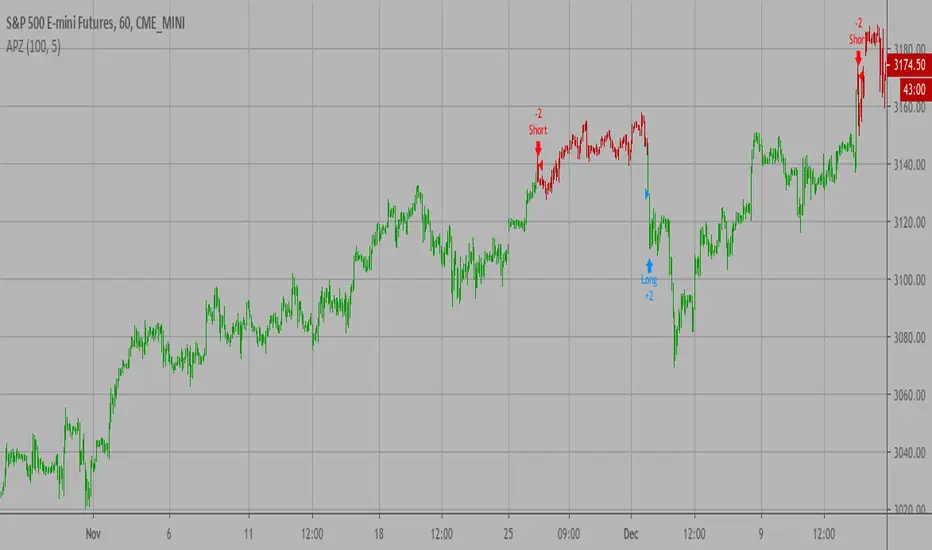
Adaptive Price Zone Strategy The adaptive price zone (APZ) is a volatility-based technical indicator that helps investors
identify possible market turning points, which can be especially useful in a sideways-moving
market. It was created by technical analyst Lee Leibfarth in the article “Identify the
Turning Point: Trading With An Adaptive Price Zone,” which appeared in the September 2006 issue
of the journal Technical Analysis of Stocks and Commodities.
This indicator attempts to signal significant price movements by using a set of bands based on
short-term, double-smoothed exponential moving averages that lag only slightly behind price changes.
It can help short-term investors and day traders profit in volatile markets by signaling price
reversal points, which can indicate potentially lucrative times to buy or sell. The APZ can be
implemented as part of an automated trading system and can be applied to the charts of all tradeable assets.
Green color is long.
Red color is short.
WARNING:
- For purpose educate only
- This script to change bars colors.

Adaptive Price Zone Indicator The adaptive price zone (APZ) is a volatility-based technical indicator that helps investors
identify possible market turning points, which can be especially useful in a sideways-moving
market. It was created by technical analyst Lee Leibfarth in the article “Identify the
Turning Point: Trading With An Adaptive Price Zone,” which appeared in the September 2006 issue
of the journal Technical Analysis of Stocks and Commodities.
This indicator attempts to signal significant price movements by using a set of bands based on
short-term, double-smoothed exponential moving averages that lag only slightly behind price changes.
It can help short-term investors and day traders profit in volatile markets by signaling price
reversal points, which can indicate potentially lucrative times to buy or sell. The APZ can be
implemented as part of an automated trading system and can be applied to the charts of all tradeable assets.

Zone Moving Average Color Direction Detection This indicator generates a zone for a moving average by means of the high and low source of the same average, the moving average should be worked as zones not as a line, by default a simple average of 200 periods is configured, the indicator has direction detection and represents it by the green and red colors, it also has padding with the same characteristic, it is possible to configure the following:
- Type: SMA, EMA, WMA, VWMA, SMMA, DEMA, THEME, HULLMA, ZEMA, TMA, SSMA
- Period / Length
- Source
- Color Direction Detection
Release Notes: Add a field to change the reaction in the change of color and direction of the Media, set to 1 is the fastest, a larger number filters the address better but is slower, 3 is set by default.

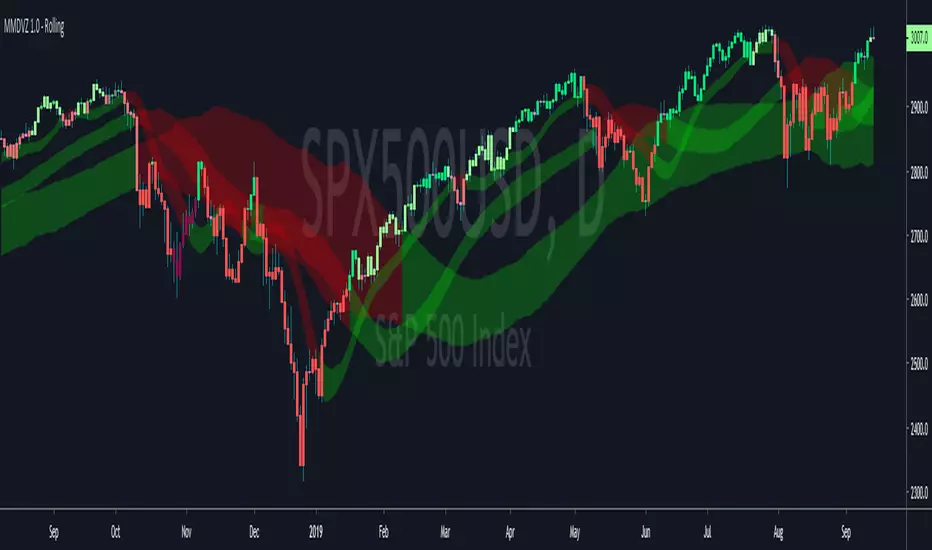
MMDVZ 1.0 (Rolling) - Moving Multi-Day VWAP Zones Rolling version of the MMDVZ script .
The bands do not reset at a fixed interval in this version and are instead bar based.
Volatility adjusted moving multi-day VWAP zones
Directionality, trend and support/resistance levels at a glance
Useful for trading practically all kinds of stocks and futures .
Works well with many timeframes.
More updates to come, stay tuned
MMDVZ 1.0 - Moving Multi-Day VWAP ZonesVolatility adjusted moving multi-day VWAP zones
Directionality, trend and support/resistance levels at a glance
Useful for trading practically all kinds of stocks and futures.
Works well with many timeframes.
More updates to come, stay tuned

