Gann Square
Application
The Gann Square is one of the best known technical analysis tools created by WD Gann along with the Gann Fan and Gann Box. It is considered a cornerstone of his trading technique that is based on time and price symmetry. The Gann Square is an advanced tool and using it properly requires a base level of knowledge about Gann theory and some experience with charting. Please note that the chart needs to be scaled properly to ensure the market has a square relationship. The tool uses the Gann Wheel as a basis for its patterns of price and time. It can be used in a variety of ways.
One way is to start at the previous major pivot point (normally the end of the last 5 wave sequence) and draw it so that the 1 X 1 line follows the current market support areas to a good degree. Another way is to highlight geometric formations that can forecast key support and resistance levels by counting forward from the all-time low or all-time high.
When working with Gann's drawings, it is important to use the proper scale ratio, so that a unit of price would correspond a unit of time.
The simplest way to determine a scale for an unknown market is to take the difference between the main points: from top to top and from the bottom to the bottom. After that, it is necessary to divide the obtained value by the time spent by the market on moving from the top to the top or, respectively, from the bottom to the bottom.
Style
In Style property dialog it is possible to change the appearance and configuration of a Gann Square:
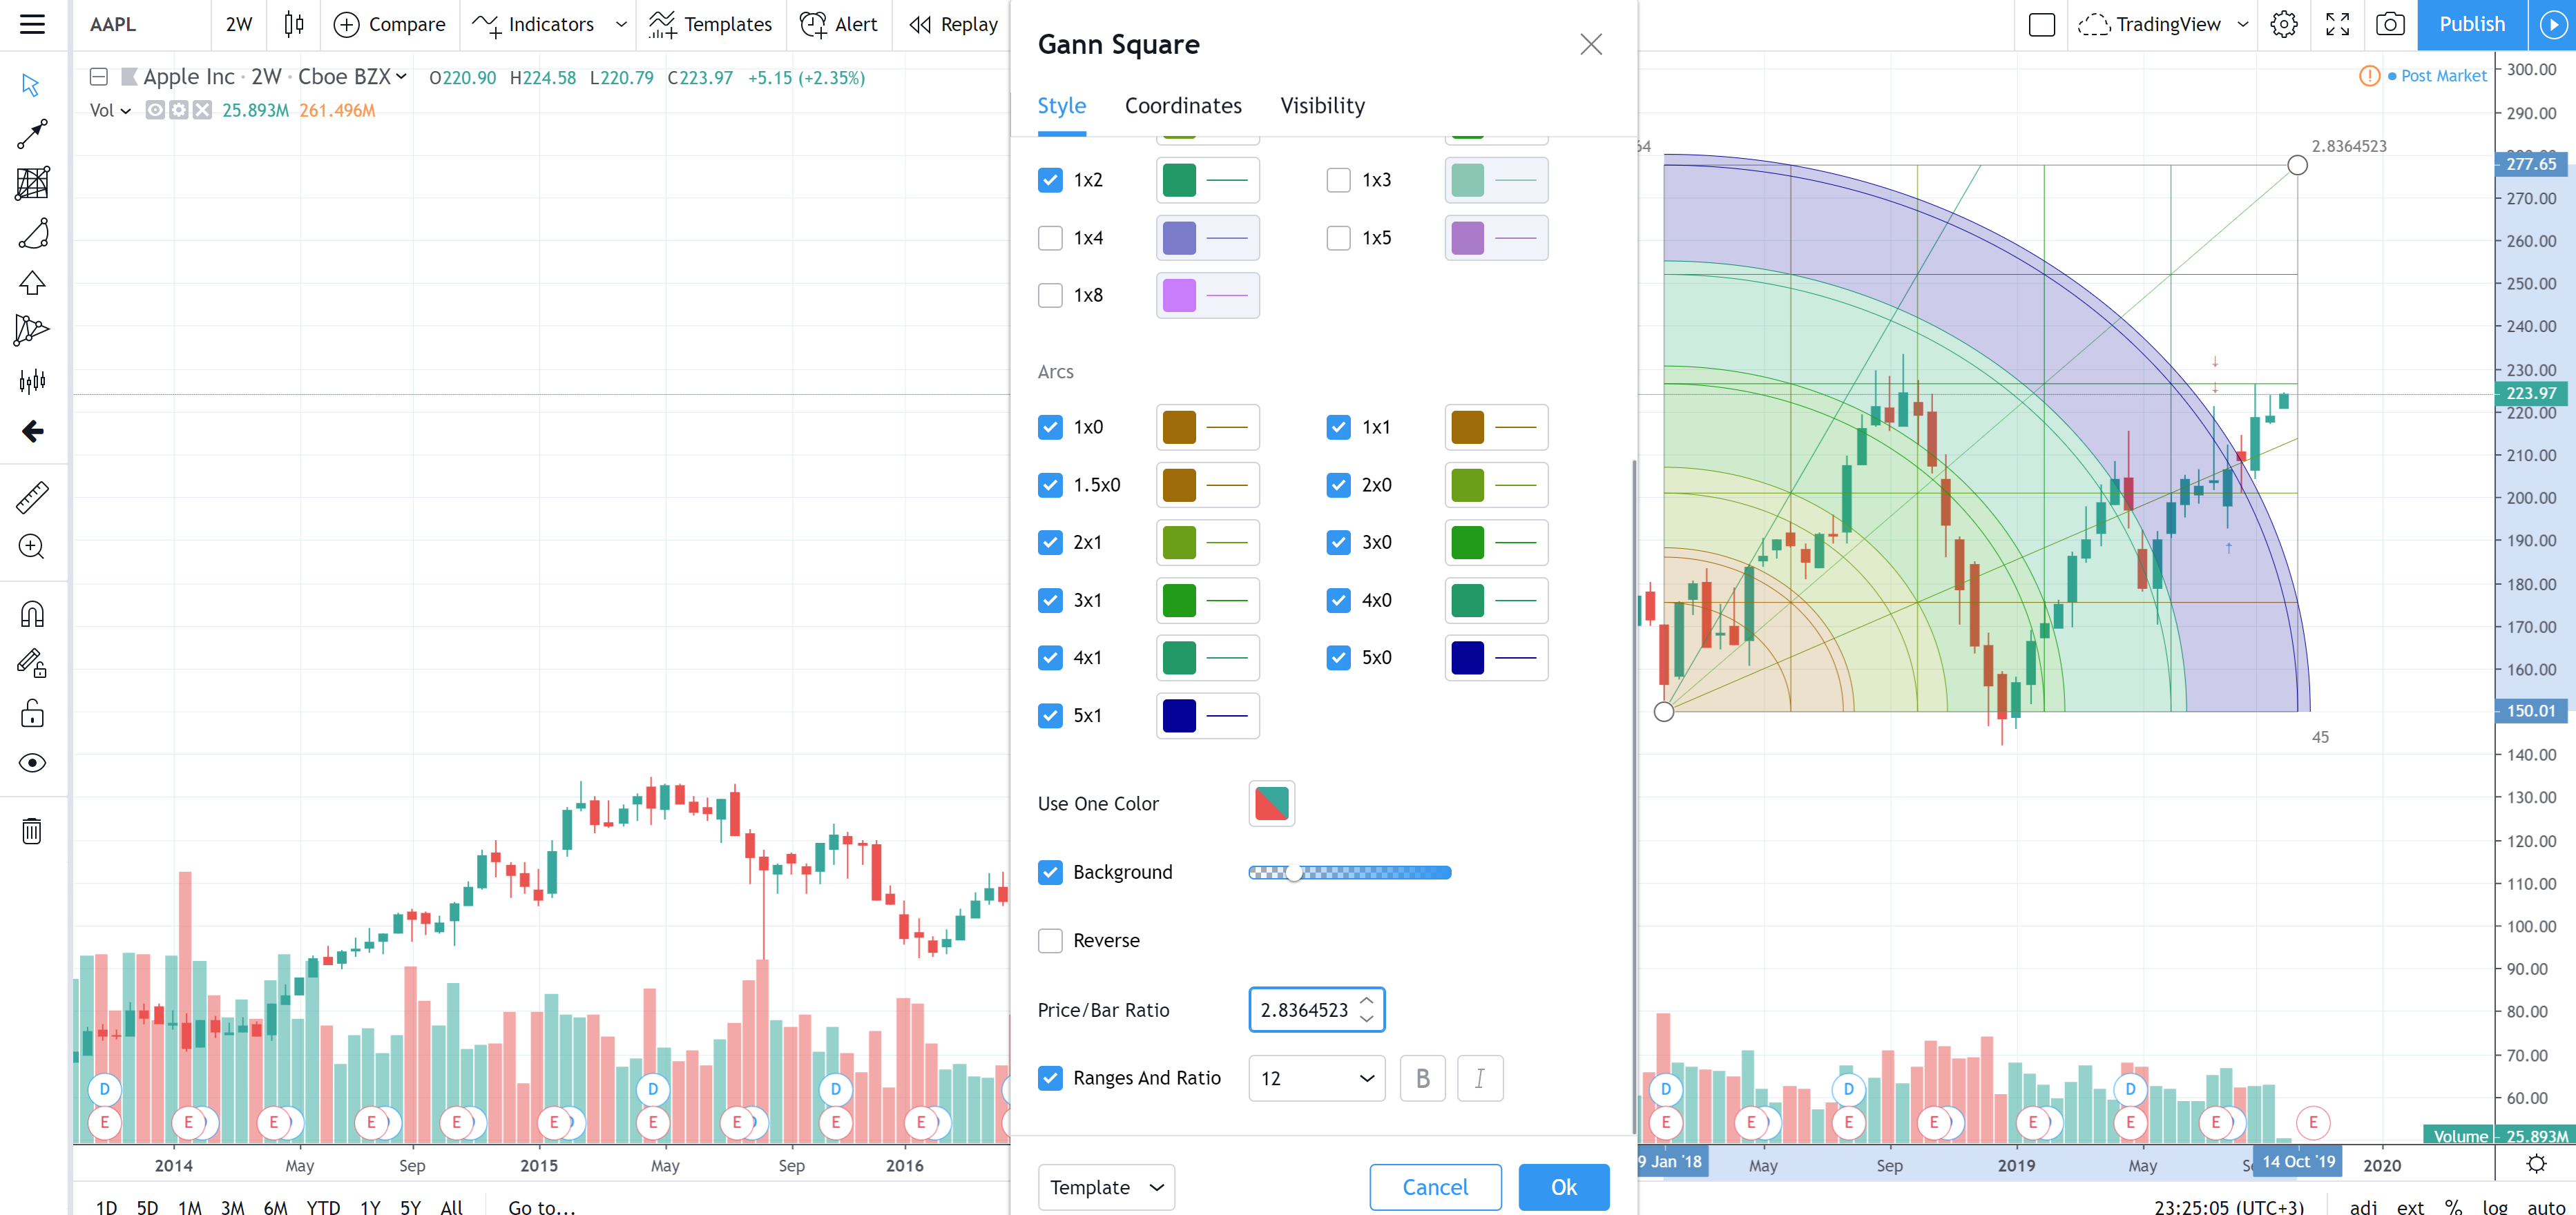
Levels, Fan, Arcs
Checkboxes on the left toggle the visibility of additional lines of the Gann Square. Toggles to the right of them set the lines' color, opacity and thickness.
Use one color
Use this drop-down to select one color for all the lines and the background of the Gann Square.
Background
This checkbox toggles the visibility of the Gann Square's background and the slider beside adjusts its opacity.
Reverse
The Reverse checkbox rotates the drawing around its main points (reflects it diagonally).
Price/Bar Ratio
When moving the anchors of the Gann Square you can save its ratio. Click on the anchor and hold Shift to do that. Simply move the anchor and the ratio will be saved automatically.
Ranges And Ratio
This checkbox toggles visibility of the Gann Square Measurement metrics (Time and Price Ranges and Ratio) at the Square's corners. Use drop-downs to the right to set the font, size, to make bold or italicize this text.
Coordinates
In Coordinates properties dialog you can set precisely the position of the Gann Square end points on the price scale (by setting the price) and the time scale (by setting the bar number):
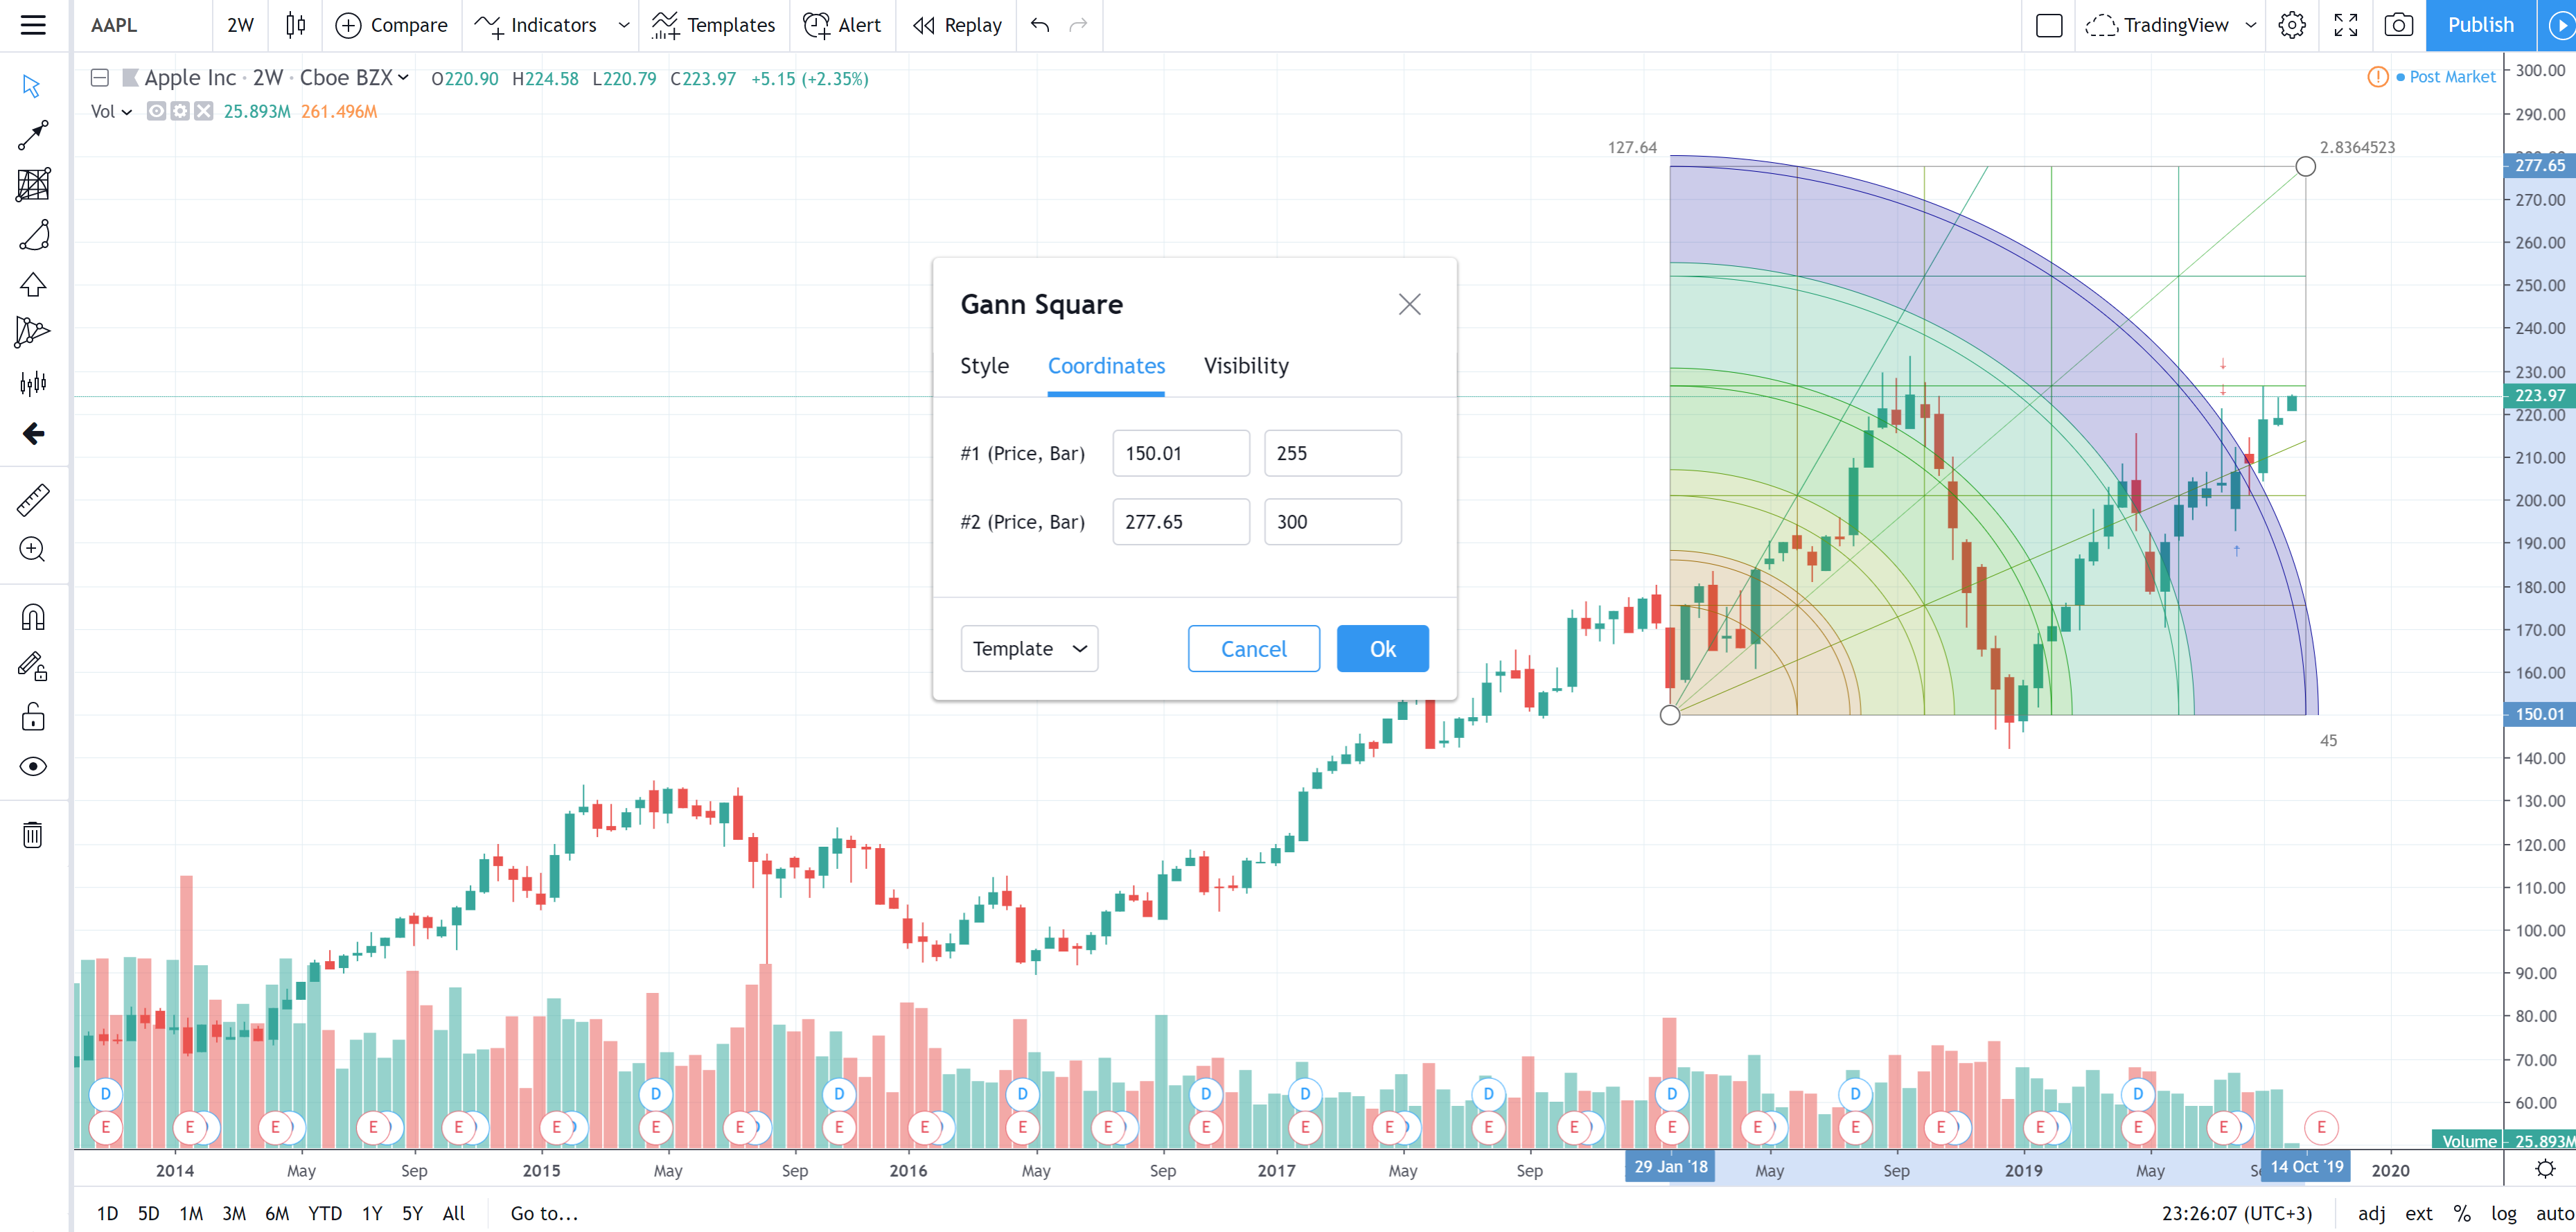
Price 1
Allows for the precise placement of the Gann Square's first point (Price 1) using a bar number and price.
Price 2
Allows for the precise placement of the Gann Square's second point (Price 2) using a bar number and price.
Visibility
In visibility properties dialog you can toggle displaying of the Gann Square on charts of different timeframes.
Allows to configure a drawing to be displayed on particular intraday and daily timeframes on chart. For any timeframe you can select either to show it, or to hide.
