Natural Gas MCX Future Analysis for 29.11.2023 (Options Also)
Levels By: Trading Marcos
Instrument: Natural Gas MCX Future
Contract Month: December Future
Intraday Levels For: 29.11.2023
Day Range : 9.10 Points
Range Trigger Point: 243.00
Buy At 246.92
Add Position 245.85
Buy Target 1 248.62
Buy Target 2 252.10
Standard SL 245.42
Preferred SL 243.28
Sale At 244.78
Sale Target 1 237.38
Sale Target 2 233.90
Standard SL 246.28
Preferred SL 248.42
📣 Disclaimer: Trading involves risk. These levels are for informational purposes only and not financial advice. Always trade responsibly and consider risk management.
📈 Follow @TradingMarcos for daily levels and instrument insights.
Trade ideas

natural gas to start upside trend MCX:NATURALGAS1! natural gas to move upside if gives green closing today, 3 possible targets as market on the chart , as long as natural gas stays above 235, dont short.

Natural Gas Future Prediction - 23.11.2023🔥 Natural Gas MCX Future Intraday Levels - 23.11.2023 📈
Ignite your trading strategy with precision! Trading Marcos presents intraday levels for Natural Gas MCX Future.
🚀 Here's the breakdown:
Instrument: Natural Gas MCX Future
Contract Month: November Future
Day Range: 7.40 Points
Trigger Point: 240.40
Buy Strategy:
Buy At: 240.27
Add Position: 239.40
Buy Target 1: 244.97
Buy Target 2: 247.80
Standard SL: 238.77
Preferred SL: 237.03
Sale Strategy:
Sale At: 238.53
Sale Target 1: 235.83
Sale Target 2: 233.00
Standard SL: 240.03
Preferred SL: 241.77
📊 Trading Marcos shares these levels for educational purposes. Remember to conduct your analysis and implement risk management strategies before making any trading decisions. 💡
📚 Trade wisely and harness the power of the energy markets! 💨
📈 #NaturalGasMCX #IntradayTrading #TradingLevels #RiskManagement #TradingMarcos

NaturalGas Future Prediction - 22.11.2023📈 Intraday NaturalGas Levels Update - 22.11.2023📉
📊 Levels By Trading Marcos
🛢️ Instrument: Natural Gas MCX Future
📅 Contract Month: November Future
📈 Intraday Levels for 22.11.2023:
📉 Day Range: 6.50
🎯 Trigger Point: 238.70
📈 Buy At: 241.72
🔄 Add Position: 240.95
🎯 Buy Target 1: 242.72
🎯 Buy Target 2: 245.20
🛑 Standard SL: 240.22
🛑 Preferred SL: 238.68
📉 Sale At: 240.18
🎯 Sale Target 1: 234.68
🎯 Sale Target 2: 232.20
🛑 Standard SL: 241.68
🛑 Preferred SL: 243.22
🚨 Disclaimer: For educational purposes only. Take paper trades to practice. Trade responsibly.
📲 Join my Instant Messenger channels for daily updates! Let's learn and grow together.
🌐 #NaturalGasTrading #IntradayLevels #TradingMarcos #CommodityMarket #LearnAndEarn #MCXFuture #TradingEducation

NaturalGas Future Prediction for 21.11.2023 - Trading Marcos Lev🔥 Natural Gas MCX Future Analysis - 21.11.2023 📉
📊 Levels By: Trading Marcos
📅 Contract Month: November Future
📈 Intraday Levels For: 21.11.2023
📏 Day Range: 7.40 Points
🎯 Trigger Point: 241.80
📈 Buy Setup:
Buy At: 243.77
Add Position: 242.90
Buy Target 1: 246.37
Buy Target 2: 249.20
🛑 Standard SL: 242.27
🚀 Preferred SL: 240.53
📉 Sale Setup:
Sale At: 242.03
Sale Target 1: 237.23
Sale Target 2: 234.40
🛑 Standard SL: 243.53
🚀 Preferred SL: 245.27
🚨 Disclaimer: Trading involves risks. These levels are for educational purposes. Do your research and manage your risk.
💬 Join my instant messenger channels for real-time updates and discussions!
#NaturalGasMCX #MCXTrading #IntradayAnalysis #CommodityTrading #TradingLevels

Natural Gas MCX Future Intraday Prediction - 20.11.2023📈 Trading Marcos Intraday Levels: Natural Gas - November Future
📊 Intraday Insights:
Instrument: Natural Gas
Contract Month: November Future
Intraday Date: 20.11.2023
Day Range: 18.90
Trigger Point: 254.50
📈 Buy Strategy:
Buy At: 252.38
Add Position: 250.15
Buy Target 1: 266.18
Buy Target 2: 273.40
Standard SL: 249.50
Preferred SL: 246.42
💹 Sell Strategy:
Sale At: 247.92
Sale Target 1: 242.82
Sale Target 2: 235.60
Standard SL: 249.42
Preferred SL: 250.88
🚀 Trading Plan:
Initiate a buy position at 252.38, with an option to add at 250.15.
Buy targets set at 266.18 and 273.40.
For selling, execute positions at 247.92 with targets at 242.82 and 235.60.
Manage risk using standard and preferred stop-loss levels.
📆 Day Range:
Anticipating a day range of 18.90 points, providing traders with potential opportunities within the specified levels.
📉📈 Risk Management:
Utilize stop-loss orders for effective risk management.
Stay updated on market conditions for informed decision-making.
🔄 Disclaimer:
Trading involves risks, and past performance may not predict future results. It's recommended to conduct thorough research or consult with a financial advisor before making trading decisions.
Happy Trading! 📊💡💰 #NaturalGas #IntradayTrading #NovemberFuture #StockMarket #TradingMarcos

Natural gas Natural gas chart analysis
Long : 270
Sl : below 268 lvl. 15 min. Candle close
Target : 274
Enjoy

Natural Gas Important Levels to watch !Natural Gas important levels to watch are as follows
#Support: 282.1
Sell below: 282.1 only on 15 minute candle closure below the level.
Target 1: 279.1
Target 2: 276.9
Target 3: 274.2
#Resistance: 287
Buy Above: 287 only on 15 minute candle closure Above the level.
Target 1: 290
Target 2: 294.9
Target 3: 301.9
=> # Remember each level will act as a support and resistance individually so there is a probability of reversal and a pullback on either side so its better to make an habit to book profits at each targets and re-enter again after a breakout from the same with a proper stoploss as per your own risk appetite.
=> # Please do your own research before initiating any trade. Always use stoploss in order to protect your capital.
=> #If you are Unable to trade properly and dissatisfied with your manual trading results due to psychological disadvantages or busy schedule or "Fear & Greed" emotions, then Algorithmic trading can be the most useful solution to overcome such problems. Kindly follow us and join us using details mentioned below the idea.
=> # Please refer our swing based support and resistance indicator if you find it useful give it a like.
=> # Follow us for more such information and educational ideas and Indicators. Give it a like if you appreciate the idea. Queries will be answered in comment section.
#Disclaimer: This is just a view and published here only for educational purpose, this should not be considered as a buy or sell signal. Trading in stock market may involve financial risk therefore, do your own research before taking any position.

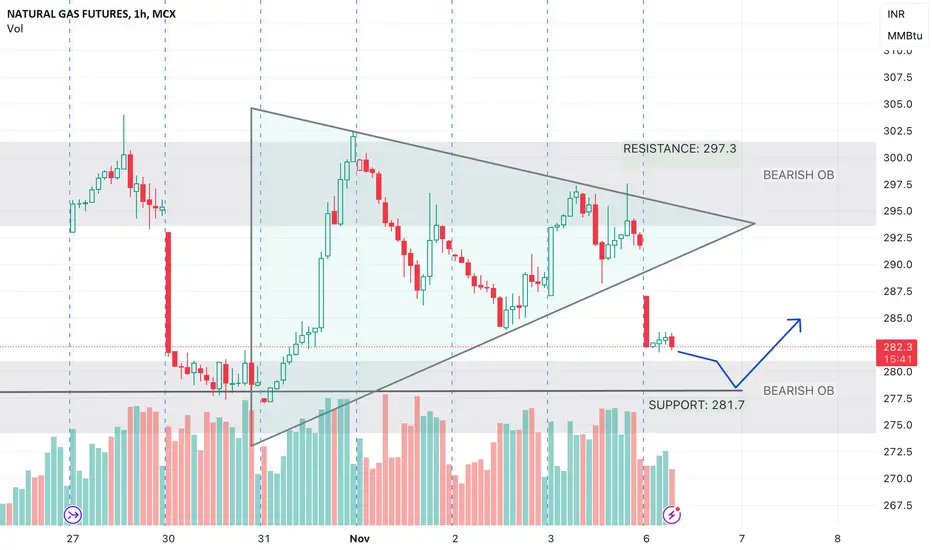
NATURAL GAS - Technical Analysis
US oil prices are facing headwinds in the near term, as storage levels remain elevated and weather forecasts are bearish. This could lead to a test of support at 281.7 per barrel. However, if prices can hold above this level, there is potential for a rebound to resistance at 297.3 per barrel.
*Key Technical Levels*
Resistance: 297.3
Support: 281.7
*Technical Factors to Watch*
US oil storage levels: Storage levels remain elevated, which is putting pressure on oil prices.
Weather forecasts: Bearish weather forecasts could lead to a decrease in demand for oil.
Price action: A break below 281.7 would be a bearish signal, while a break above 297.3 would be a bullish signal.
Natural Gas important levels to watch !Natural Gas important levels to watch are as follows
#Support: 247.6
Sell below: 247.6 only on 15 minute candle closure below the level.
Target 1: 246
Target 2: 243
#Resistance: 250.5
Buy Above: 250.5 only on 15 minute candle closure Above the level.
Target 1: 252.3
Target 2: 255.2
Target 3: 258.6
=> # Remember each level will act as a support and resistance individually so there is a probability of reversal and a pullback on either side so its better to make an habit to book profits at each targets and re-enter again after a breakout from the same with a proper stoploss as per your own risk appetite.
=> # Please do your own research before initiating any trade. Always use stoploss in order to protect your capital.
=> #If you are Unable to trade properly and dissatisfied with your manual trading results due to psychological disadvantages or busy schedule or "Fear & Greed" emotions, then Algorithmic trading can be the most useful solution to overcome such problems. Kindly follow us and join us using details mentioned below the idea.
=> # Please refer our swing based support and resistance indicator if you find it useful give it a like.
=> # Follow us for more such information and educational ideas and Indicators. Give it a like if you appreciate the idea. Queries will be answered in comment section.
#Disclaimer: This is just a view and published here only for educational purpose, this should not be considered as a buy or sell signal. Trading in stock market may involve financial risk therefore, do your own research before taking any position.

NATURAL GAS TRIANGLE BREAKOUTNATURAL GAS MCX
cmp 228
PURE POSITIONAL TRADE SETUP
FORMATION OF ASCENDING TRIANGLE PATTERN
Resistance Zone 230---240
If sustains above it for 2 days it will be considered a BREAKOUT....
Short Term Targets 250 / 257 / 263 / 272 / 279 / 286 / 295
Positional Targets 300 / 315 / 330 / 345 / 360 / 375 / 390
-------------------------------------------------------------------------------------------
Support at 215 / 205
Below it Natural Gas will be weak again for 195 / 180 / 175 / 160
-------------------------------------------------------------------------------------------
Regards...
Keshav...
20/09/2023
Disclaimer. I am not a SEBI registered advisor. All views shared on this channel and group are my personal opinions shared for educational purposes .. Good Luck 😉


natural gas overview blw tutorial purpose----natural gas 229.60@ or come 301 looks sl 303.50 tgt 296--290+++ or bw 288 thna sharp dwn fall epxect till 278--65+++++

NATURAL GAS MCX Entering strong demand zone and trading close to rising trendline entry in 210-215 range on correction .If holds 200 on day closing bases can show strong upwards momentum towards august month highs of 250 and then towards 280 in next 5-7 weeks .

Update on $MCX:NATURALGAS1!Dear Followers,
I hope this message finds you well. I wanted to provide you with an update on the current state of the MCX:NATURALGAS1! market.
As of 14-Oct-2023 , natural gas prices are trading at 270-272 , .
The market has been influenced by factors such as factors like supply and demand, weather conditions, geopolitical events.
Upside Resistance - 285-290
Downside Can Be Seen - 260-250
Support Level - 245-250
Potential Short Term Upside Trend - 310-320
It's important to note that natural gas prices can be volatile, and it's crucial to stay informed and make trading decisions based on your specific goals and risk tolerance. If you have any questions or would like more detailed information, please don't hesitate to reach out
Best regards,

NatGas Creeping BullishHi friends, it's a daily chart of commodity Natural gas as we can see after a long consolidation in parallel channel finally it breakout channel resistance and currently trading above that resistance, so if price will close above we can see above marked target can arrive in coming sessions, Price has come here so far by making higher lows and now trading above from last swing high so we can assume it is starting of trend reversal in it, one Triangle breakout also occured inside the parallel channel.
I don't think there is any need to write a long description because charts have their own language, you just have to understand it.
This is not and trade or investment advice. This idea is meant for learning only.
Best Regards happy trading- Amit

#NATURALGAS Update 📆 26th October Bullish Momentum Alert 🔼
If it holds above 255.2 current levels, we might see further upside movement. 🚀

MCX Mrtal and Energy Analysis Crudeoil , Natural Gas and Silver, Its a general analysis on the basis of simple price action

NATURAL GAS 1 Hr. Natural gas form selling sturcture comings downside expect tgt upto 225 below & exact tgt 220

Natural Gas Important Levels to watch !Natural Gas important levels to watch are as follows
#Support: 244
Sell below: 244 only on 15 minute candle closure below the level.
Target 1: 242
Target 2: 239
#Resistance: 247
Buy Above: 247 only on 15 minute candle closure Above the level.
Target 1: 249
Target 2: 252
=> # Remember each level will act as a support and resistance individually so there is a probability of reversal and a pullback on either side so its better to make an habit to book profits at each targets and re-enter again after a breakout from the same with a proper stoploss as per your own risk appetite.
=> # Please do your own research before initiating any trade. Always use stoploss in order to protect your capital.
=> #If you are Unable to trade properly and dissatisfied with your manual trading results due to psychological disadvantages or busy schedule or "Fear & Greed" emotions, then Algorithmic trading can be the most useful solution to overcome such problems. Kindly follow us and join us using details mentioned below the idea.
=> # Please refer our swing based support and resistance indicator if you find it useful give it a like.
=> # Follow us for more such information and educational ideas and Indicators. Give it a like if you appreciate the idea. Queries will be answered in comment section.
#Disclaimer: This is just a view and published here only for educational purpose, this should not be considered as a buy or sell signal. Trading in stock market may involve financial risk therefore, do your own research before taking any position.

NATURAL GAS UPDATE - WEEKLY
If sustained above 244.5 then we can see upside levels in the coming week
If breaks 244, NaturalGas enters the bearish zone
Let me know if there are any questions for Natural gas!

ng stya blw 260 sell on rise looks 253--45ng stya blw 260 sell on rise looks 253--45 sell on rise tight sl 267 looks gap dwn trend continue blw 3$ in nymex spot looks dwn 2.90+++

NATURALGAS - EXPECTED LEVELS THIS WEEK (16 -20 OCT)Natural gas After falling 3.2% last week. Where pull back from 9 months high,
Crude oil expected range this week: 276.60- 263.60
Support at 263.60
Resistance at 276.50
Sell Below only 269.60
