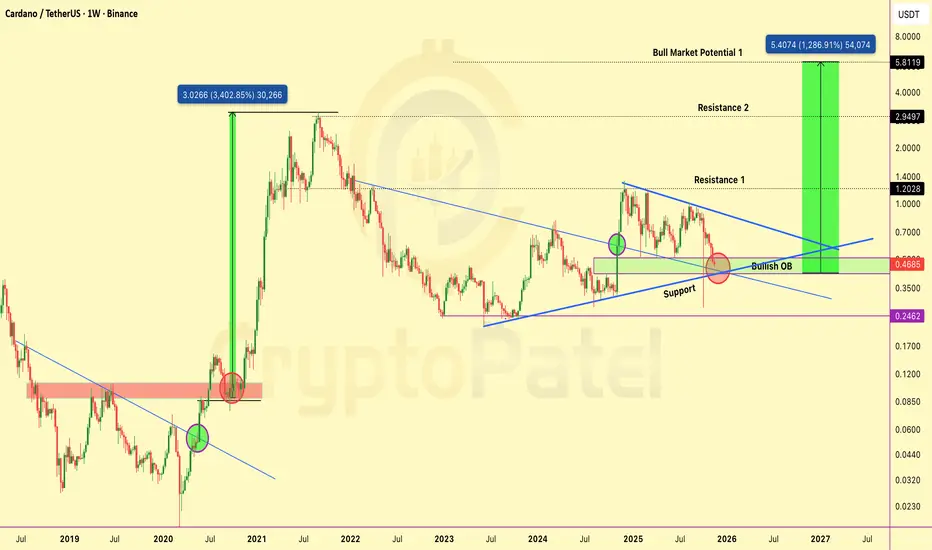
$ADA ALTSEASON SETUP | 4,500%+ EXPANSION IF SUPPORT HOLDSCRYPTOCAP:ADA ALTSEASON SETUP | 4,500%+ EXPANSION IF SUPPORT HOLDS
#ADA Is Trading Inside A HTF Bullish OB After A ~93% Corrective Move From Its Local Macro High, Positioning Price At A Critical Accumulation Vs Invalidation Zone.
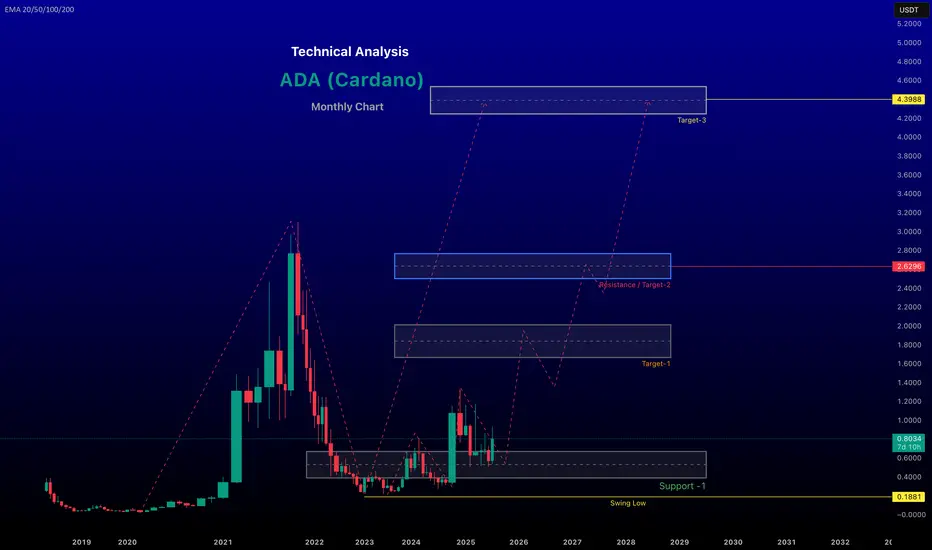
Technical Structure
✅ Previous Cycle ATH At $3.1 (+1,300% Expansion)
✅ BIG Correction PHASE: −78% From $1 Local High Within Last 6 Months
✅ Multi-Year Strong Support Holding Above $0.24 Level
✅ HTF Bullish OB Active At $0.18–$0.13
✅ Structure Remains Bullish As Long As $0.13 Holds (HTF Close)
✅ Strict STOP LOSS For High Risky Trader: $0.0755 (HTF Close)
Historical Context:
2021 Bull Run: +3,400% Expansion To $3.10
2021-2026 Correction: -92.89% Decline Into Accumulation Phase
HTF Demand Zone: $0.18–$0.13 (Accumulation & Liquidity Absorption)
Reclaim Zone: $0.4374 (Trend Confirmation Area)
Bull Market Expansion Targets: $1.20 → $3 → $5 → $10+ (Full Cycle Expansion Projection)
This $0.18–$0.13 Zone May Be The Last Accumulation Opportunity For ADA Bulls Before The Next Parabolic Phase.
Invalidation: Weekly Close Below $0.13
Disclaimer: This Is TA Only. Not Financial Advice. Always Do Your Own Research And Manage Risk.
What traders are saying

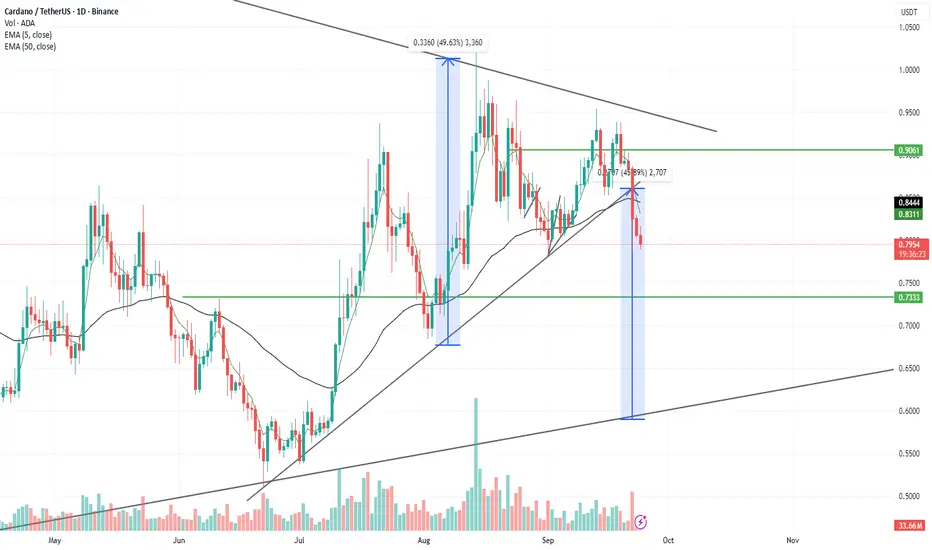
$ADA is still trading under pressure after the sharp sell-off CRYPTOCAP:ADA is still trading under pressure after the sharp sell-off from the 0.36 region, followed by a deep flush toward 0.268. That low marked a temporary bottom, but the recovery since then has been weak and corrective, not impulsive.
On the rebound, price formed two clear lower highs around 0.304–0.306 (Top 1 & Top 2 on the chart). This confirms sellers are defending the upside aggressively. The rising trendline support has already been tested once and lost momentum.
Right now, #ADA is hovering near 0.298–0.300, but structure-wise, this is still a distribution range, not a breakout base.
If price fails to reclaim and hold above 0.306, downside risk remains active. A breakdown below the 0.285 support box would likely open continuation toward the 0.268 low again.
Only a clean break and acceptance above 0.306–0.31 would shift short-term bias.
Resistance: 0.306–0.31
Support: 0.280 → 0.285

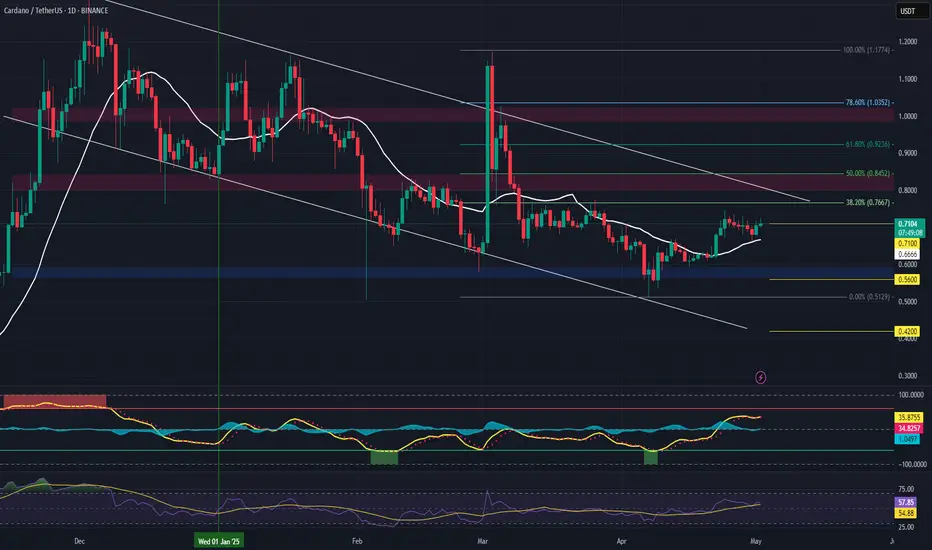
ADA/USDT Multi-Timeframe Analysis MONTHLY (1M) - Macro Trend
Status: Bearish with Recovery Attempt
Long-term trend: Downtrend established from May 2021 peak (~$3.1)
Support levels: $0.36 (current), $0.26-0.28 (historical support)
Volume profile: Declining volume suggests weakness
Outlook for Feb: Watch for stabilization or further downside to $0.26
WEEKLY (1W) - Intermediate Trend
Status: Neutral to Weak
Current price action: Trading in consolidation zone ($0.36-0.40)
Key support: $0.36 (green horizontal line visible)
Key resistance: $0.42-0.45
Volume: Contracting, suggesting indecision
Status: Bearish Bias
Current pattern: Lower highs, choppy action
Support: $0.3451, $0.33 zone
Resistance: $0.4341 (red zone resistance)
Momentum: Weak, RSI likely in lower zones
Trading range: $0.33-0.435
February 2025 Trading Scenarios
Bullish Scenario :
[Condition: Daily close above $0.40 with volume
Target: $0.50, then $0.55
Stop: Below $0.36
Probability: 35% (weak fundamentals suggest lower probability)
Bearish Scenario :
Condition: Daily close below $0.325
Target: $0.28, then $0.26
Stop: Above $0.385
Probability: 55% (trend remains down)
ADA is in a critical consolidation zone with weak momentum. The month will likely test whether this is a reversal pattern or continuation of the downtrend. Hold above $0.36 for bullish hopes; break below $0.325 confirms further downside to $0.26.
Disclaimer:
The information shared here is for educational and informational purposes only and should not be considered as financial, investment, or trading advice. Trading in stock markets, crypto, forex, or derivatives involves substantial risk, and past performance is not indicative of future results.

ADA longBullish shark pattern. Should see a bounce towards the 0.382-0.5-0.618 if price turns to the upside.

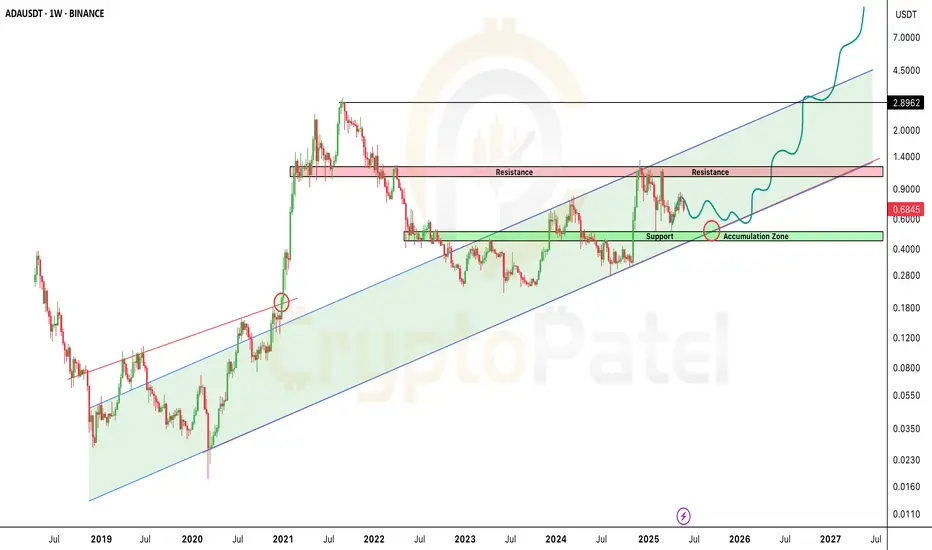
$ADA Retested THE Level That Triggered Its Last Parabolic RunCRYPTOCAP:ADA Just Retested THE Level That Triggered Its Last Parabolic Run: History About to Repeat?
Cardano is again retesting the same multi-year $0.46–$0.35 bullish order block inside the descending wedge that triggered its last explosive cycle. The structure is almost identical, only bigger.
Market Structure:
3+ years of compression tightening toward the apex
Price holding the institutional accumulation zone
Volatility squeeze signaling a high-probability breakout window
Upside Levels: $1.20 → $2.95 → $5.80+
Last time ADA broke this pattern, it didn’t move 30%… it moved 3,000%.
Asymmetric setup. Invalidation below $0.35.
Not financial advice. DYOR.
ADA 1H Technical Snapshot — Short Bias via Cycles, Long Opportun📊 Cycle Structure:
HWC (Higher Wave Cycle): Bearish 🔽
MWC (Middle Wave Cycle): Range 🔁
LWC (Lower Wave Cycle): Bullish 🔼
📌 Overall View: The cycles suggest a short bias, but we take direction from BTC and BTC.D, which opens a potential short-term long opportunity.
📐 Market Context:
BTC is in a strong support zone and BTC.D is currently bearish.
ADA is at the third touch of its trendline and resistance at 0.6844 (which has seen 3 previous touches).
This resistance may react, providing a good entry for a short-term long.
🎯 Trade Plan (Short-term Long):
Long position is taken and will be held until price reacts to the resistance.
Given BTC.D’s status, this is more favorable for altcoins.
Stop-loss and risk management must be applied to control the position in case of a weak reaction or breakout.
📌 If you want a specific coin analyzed, drop a comment and I’ll do it for you.
⚠️ Without proper risk management, you're just a ticking time bomb.
— PXA | Cycle & Structure-Based Trading

ADA Approaching Major Support – Spot Long Setup in ProgressCardano (ADA) is trending down toward a critical support zone at $0.67–$0.70, which could offer a low-risk entry for a laddered spot long position. The broader crypto market remains cautious, and near-term direction is still unclear—so position sizing and disciplined execution are essential.
🎯 Plan of Action:
Entry Zone: $0.67–$0.70 support, with staggered buys to improve cost basis.
Confirmation Required: Wait for signs of stabilization (e.g., bounce, volume support) before adding further.
Avoid chasing rallies if they lack volume follow-through.
📊 Targets & Risk Management:
Take Profits in Tiers:
First zone: $0.74–$0.85
Second zone: $0.95–$1.15
Stop Loss: Just below $0.62, invalidation of the support structure.
Keep allocation modest—ADA is still in a volatile downtrend.
💡 Reminder: This is a technical setup, not a prediction. Let the chart lead the decision, and stay adaptive to market conditions.
Cardano (ADA) – Bulls Regain Control, Eyes on $0.90 BreakoutCardano had a strong week, managing to hold above key support at $0.77 and closing with a bullish weekly candle. This price action signals a shift in momentum, with buyers back in control.
However, ADA now faces a critical test: the $0.90 resistance level. So far, bullish momentum hasn't been strong enough to force a breakout, but with the broader market showing strength, this level may not hold for long.
A confirmed breakout above $0.90 would be significant, opening the path for a potential move above $1 — a level not seen since mid-2022.
Looking forward, October has started with a strong bullish tone across the crypto market. If this continues, Cardano could be positioned for a fresh rally, provided bulls can take out the $0.90 resistance.
📌 Key Levels to Watch:
Support: $0.77
Resistance: $0.90
Target if breakout confirms: $1+
🟢 Bias: Bullish above $0.77
🔴 Risk: Failure at $0.90 could lead to a retest of support
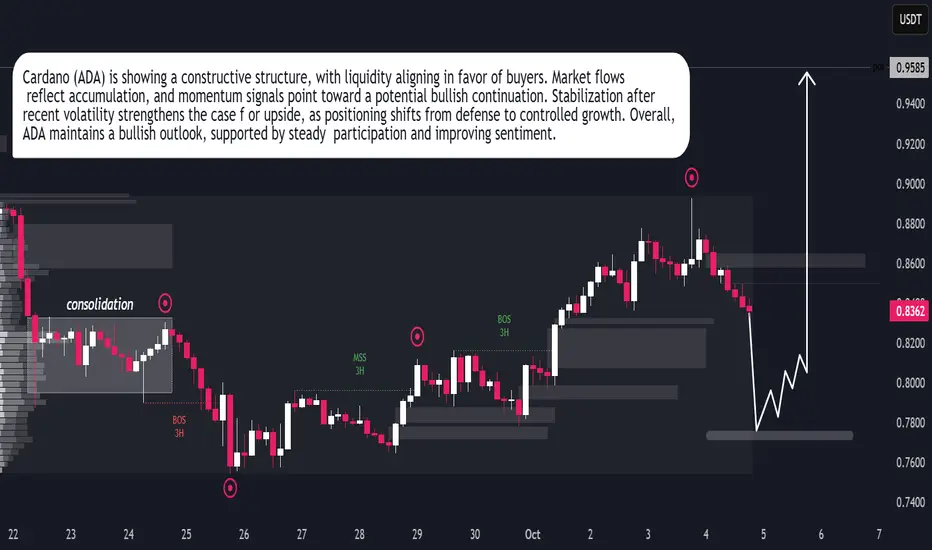
Cardano (ADA) Ready for Bullish ExpansionCardano (ADA) Ready for Bullish Expansion
Cardano (ADA) is building strength as market conditions favor accumulation over distribution. Liquidity behavior shows steady inflows, suggesting participants are positioning for upward continuation. The recent stability reflects confidence, with sentiment gradually tilting toward growth. Momentum indicators align with this view, reinforcing the prospect of a bullish expansion phase. ADA’s structure signals resilience, and the market tone supports the case for sustained upside in the near term.
short correction in ADASince we can see that Ada is no more in momentum and the momentum has broken , now there is a time of short correct which i expect to be till .63 $ , see the analysis , ADA has broken a short term tren downwards in Daily chart and the target is quite equal to the depth measured from the breakdownpoint till the last high
ADA TECHNICALThe current price of Cardano (ADA) in Tether (USDT) is approximately 0.88 USDT, based on recent data from Coinbase. In the last 24 hours, the price has increased by about 3.86%, with a high of 0.89 USDT and a low of 0.83 USDT. Over the past week, the exchange rate has risen by 16.11%, and over the past year, ADA's value has grown by 62.03% against USDT.
Chart For the reference
~~ Disclaimer ~~
This analysis is based on recent technical data and market sentiment from web sources. It is for informational \ educational purposes only and not financial advice. Trading involves high risks, and past performance does not guarantee future results. Always conduct your own research or consult a SEBI-registered advisor before trading.
# Boost and comment will be highly appreciated.

ADA/USDT - Weekly Structure BreakCardano (ADA) has shown a Fractle Structure Break in weekly Time Frame, opening the door for a bullish swing play.
Plan of Action:
Entry 1 (50%) → $0.7668 (on retest)
Entry 2 (25%) → $0.6225 (liquidity pool zone)
Entry 3 (25%) → $0.4490 (deep liquidity sweep)
Stop Loss → $0.2772 (below weekly low)
Target → 1:3 RR
Why scale entries?
Liquidity below $0.5300 remains untouched. ADA could dip to sweep it before resuming bullish momentum. Scaling protects against early invalidation.
📊 Bias: Long
⏳ Timeframe: Weekly (multi-week holding potential)
⚠️ Risk management is key. Enter gradually & let the structure play out.
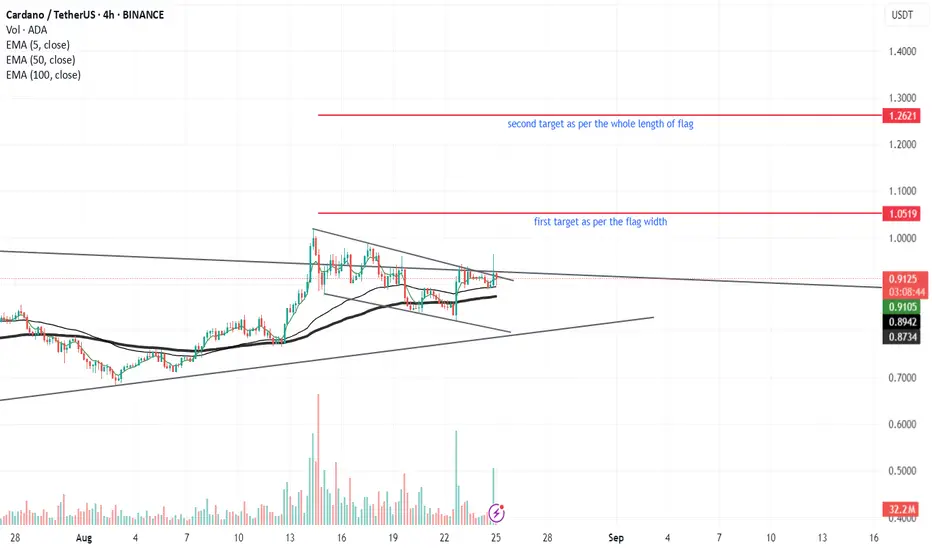
Why #ADA CARDANO is going to skyrocket!!As per the short term objective as well ADA is very bullish token , after the breakout of the flag which is very likely possible as per the chart the 2 near term targets are drawn , its a very good opportunity to Long ADA
renderwithme | ADA Technical Analysis Monthly Chart"Riding the Cardano wave! #ADAUSDT poised for a breakout—targeting $0.81 and beyond! #CryptoTrading"
~ Disclaimer ~~
This analysis is based on recent technical data and market sentiment from web sources. It is for informational \ educational purposes only and not financial advice. Trading involves high risks, and past performance does not guarantee future results. Always conduct your own research or consult a SEBI-registered advisor before trading.
# Boost and comment will be highly appreciated.
renderwithme | ADA Technical Analysis Technical Analysis
Recent technical analyses from web sources and X posts suggest a bullish outlook for ADA in the short to medium term, with specific price levels and patterns noted:Price Trends and Breakouts:As of July 24, 2025, ADA has broken out of a long-term downtrend and is retesting the breakout zone around $0.78. If this support holds, analysts predict a potential rally toward $1.20 or higher.
Earlier analyses (November 2024) indicated ADA was at a critical juncture, with a potential breakout to $1.25 if resistance was cleared, or consolidation into a triangle pattern if rejected.
A macro analysis from February 2025 highlights ADA maintaining a bullish structure above key invalidation levels, supported by its strong community and historical price action, suggesting a strong bullish continuation.
On a 4-hour timeframe, an ascending triangle breakout was observed around $0.777, with targets at $0.83 and $0.86, supported by higher lows and increased volume
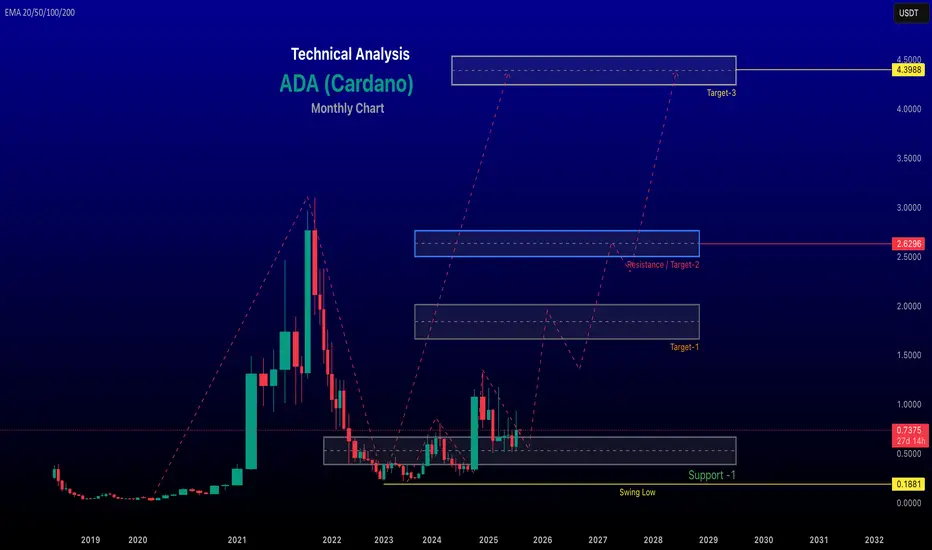
for longer time frame target given in the chart
~~ Disclaimer ~~
This analysis is based on recent technical data and market sentiment from web sources. It is for informational \ educational purposes only and not financial advice. Trading involves high risks, and past performance does not guarantee future results. Always conduct your own research or consult a SEBI-registered advisor before trading.
# Boost and comment will be highly appreciated.
$ADA Bullish Pennant Formation
#ADA is consolidating inside a bullish pennant on the 1-hour chart after a strong rally from $0.56 → $0.77.
🔹The pole is formed by a steep breakout
🔸Price is now tightening within converging trendlines
🔹Classic sign of continuation if breakout occurs to the upside
Breakout Zone:
Watch for a breakout above $0.76–$0.77
If confirmed, next targets = $0.80, $0.83 and $0.88
Invalidation Level:
Breakdown below $0.70 negates the pennant structure
⏳ Tight structure — breakout likely soon

ADA Sitting on Strong Support — Next Big Move Loading?🚨 ADA Sitting on Strong Support — Next Big Move Loading?
Cardano has dropped to around $0.68, but guess what? It's sitting on a major support zone in a long-term bullish channel!
🟩 Accumulation Zone: $0.60–$0.40
This is where smart money enters… historically a STRONG buy zone!
🟥 Next Resistance: $1–$1.20
Break that — and ADA could fly toward $5–$10+ in the coming bull run!
The chart is screaming MEGA RUN ahead — if you're bullish on ADA long-term, this might be your signal.
Not financial advice, but the setup looks Strong.
ADA (Cardano) Short Setup – Rejection from Major ResistanceADA is approaching a key resistance zone around the $0.84 level, which aligns with the 50% Fibonacci retracement and yearly open, showing signs of buyer exhaustion and weak momentum.
🔹 Entry:
$0.84 zone (watch for rejection w/ bearish confirmation candle or failed breakout)
🎯 Take Profit Targets:
🥇 $0.71
🥈 $0.56
🥉 $0.42
🛑 Stop Loss:
$0.92 (above key resistance/invalidates setup)

adaADA-USDT
Cup and handle model, we expect to enter $0.8100 and enter buy 🟢
the goal
$0.9550
loss loss
$0.7570

ADA Bullish ScenarioADA might be following a bullish bat pattern. This will be a good buying setup for ADA.
Stop loss is already provided.

Final Call to buy ADA below the $1 mark!Cardano (ADA) Key levels to look out for the immediate short-term:
1. TGT 1 - 0.9988 ✅
2. TGT 2 - 1.1827
3. TGT 3 - 1.3298
Cardano (ADA), both Short-Term & Long-Term trends looking extremely bullish.
1. Breakout above the parallel channel confirmed ✅
2. Breakout above the Bull Pennant confirmed. ✅
Both breakouts have been with extremely strong candles and also with a decent amount of volume. The latest 4H candle broke through the $0.9988 price range with good volume, which was the immediate resistance level for ADA. A re-test would be good and most likely possible.
This maybe the last time you can buy ADA below the 1$ price mark. This is once in a lifetime opportunity, as we're gonna see ADA skyrocket to 10$ - 20$ - 30$ in the long run, once the entire cryptoverse witnesses the most-awaited and biggest bull run ever!
Keep #HODL-ing guys! It's now or never!

ADAUSTHere is an Analysis of ADAUSDT, please consult your financial Advisor before investing or Trading
