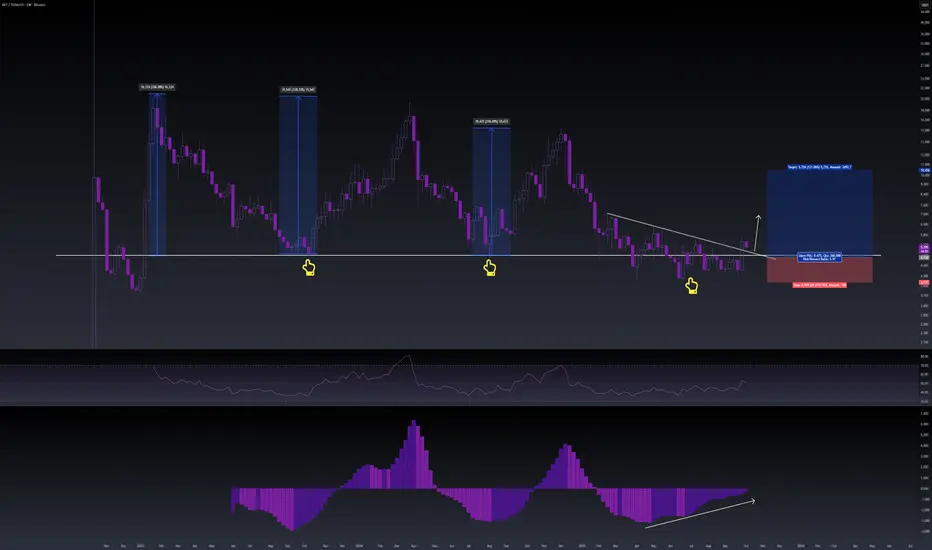
$APT Broke out of Downtrend, AO turning Positive next weekAMEX:APT looks like a strong play for this bull run on Spot and is still in a solid buying range. Historically, it has pumped nearly 300% whenever it consolidated around these levels.
Now with Aptos generating millions in monthly revenue and the #AptosExperience event coming up next week, the setup looks even stronger.
Momentum indicators are also turning positive. We saw a similar pattern with NASDAQ:STRK last week — and you know how that played out this week.
I’ve already stacked a good amount of AMEX:APT and will be adding more if it dips into the 4.5–4.8 zone.
Trade ideas
#APT Bearish Setup And IdeaAPT Is Also In Bearish Structure, Also Its Failing To Hold The Support, We Have A Small Reversal Area Downside, We Can See A Good Momentum In APT From Our Reversal Area, But Until Then There's No Pump (If Market Pumped, This Idea Will Be Invalidate).
Disclaimer -: This Is Not An Financial Advise, This Is An Idea, We Are Not Responsible For Any Profit And Loss You Will Made.

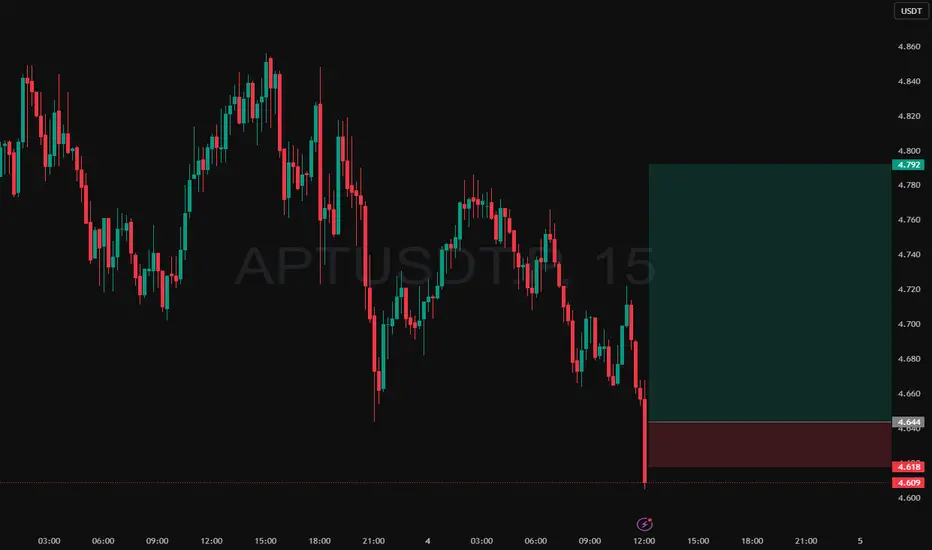
Intraday Long Setup | July 4th 2025 | Valid Until Daily ClosePrice retraced to a strong pivot zone.
Structure remains bullish with potential for continuation after pullback.
Tight risk control.
Watch for price reaction within the red zone. Entry only if confirmation appears
The setup expires at end of the daily candle close.
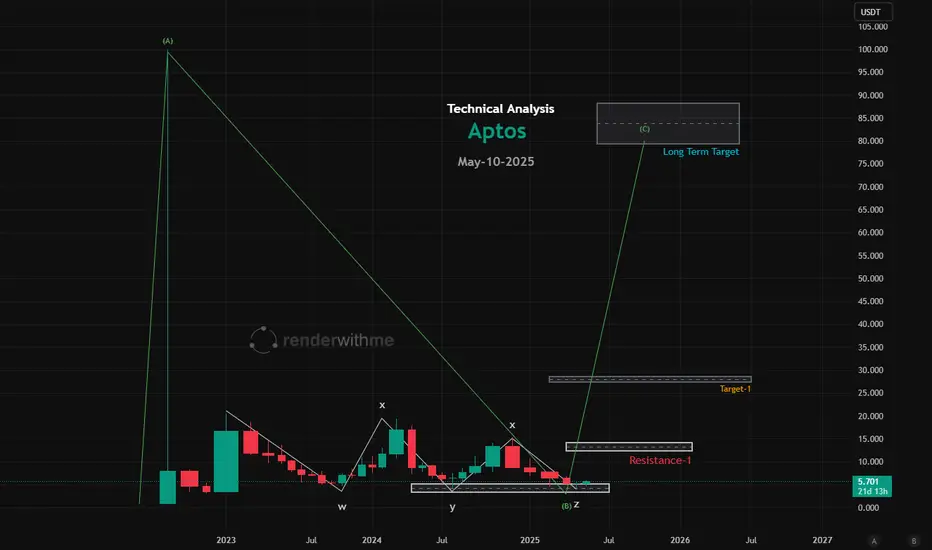
Aptos (APT) Technical Analysis -May10,2025 (READY FOR THE RALLY)#Current Market Overview
Price: As of recent data, Aptos (APT) is trading at approximately $5.76 USD at the time of posting with a 24-hour trading volume of around $224.1 million USD.
Market Cap: Approximately $3.57 billion USD with a circulating supply of 620 million APT.
24-Hour Performance: APT has seen a +4.82% price increase in the last 24 hours, indicating short-term bullish momentum.
7-Day Performance: A +8.70% increase, though underperforming compared to the global crypto market (+10.50%).
In My view Bottom has been made and ready for the Bull Run
Chart for the Reference
APT LOOKING GOOD IN DAILY TFAPT looking great in daily time frame for some good strong upward move. Optimal target 1 would be around 14$. And target 2 would be approx 20$

aptos longconsolidation at the resistance on weekly tf likely to break up with a contingency of btc being stable to bullish at 90k. aptos can give a target of 18$


apt long;;;;;;;;;;;;;;;;;;;;;;;;;;;;;;;;;;;;;;;;;;;;;;;;;;;;
''''''''''''''''''''''''''''''''''''''''''''''''''
;;;;;;;;;;;;;;;;;;;;;;;;;;;;;;;;;;;;;;;;;;;;;;;;;;;;
;;;;;;;;;;;;;;;;;;;;;;;;;;;;;;;;;;;;;;;;;;;;;;;;;;;
---------------------------------
-----------------------------------
=========================
=========================

APTUSDT LONG IDEAFED cut fundrate, It's time to long coin, follow your rule. management your position, time is answer.

APTOS Bullish DiamondWe can see a bullish diamond for APT.
This diamond was broken and it is now in a uptrend.
Since the rate cut last 18/09/24 we will see this bullish pattern performing well.
We could have some stops at $I9, $12, $14, $22.
Good luck with it.
Happy trading.
Raf

APTOS (APT) PRICE ANALYSIS APT is currently approaching upper boundary of descending channel which acts as huge resistance for more than 100 days. Expect a mini pullback first before breakout and then gain momentum.
If breakout is successful then targets could be 7.8, 9.5, 12.
We need to wait for successful breakout, entry zone will be from 7.0 to 8.0

APTOS (APT) SHORT IDEAAPT is showing bearish pattern on hourly and 4h timeframe, BTC has not been good right now. BTC Dominance is pushing Alts down, so downfall in APT is highly expected.

#Aptos Price Analysis: From Symmetrical Triangle to $100 APT/USDT Technical Analysis Update
➡️ Current Situation:
APT price was recently rejected at the resistance level of its previous all-time high. Observations on the higher time frame (HTF) charts indicate the formation of a symmetrical triangle. After a breakout, the price is currently retesting at the support level.
➡️ Key Support Zone:
The strong support zone and recommended entry levels are between $9 and $7.50 (spot trading). This provides a favorable risk-reward setup for potential entries.
➡️ Long-Term Outlook:
In my opinion, Aptos (APT) holds the potential to reach $100 in the long term. This makes my long-term target for APT a solid $100.
➡️ Short-Term Targets:
$18
$30
$48
These targets are set based on current market dynamics and breakout patterns observed in the chart.
➡️ Risk Management - Exit Strategy:
It's crucial to manage risks by setting an exit point. If the price breaks down below the red trend line, currently around $6.50, consider exiting to preserve capital.
➡️ Market Sentiment:
The overall sentiment will need to be monitored closely, particularly how the price reacts at the current support level. Maintaining a flexible approach will be key as market conditions evolve.
➡️ Remember:
Always do your own research (DYOR) and consider your risk tolerance when trading.
Stay Updated:
Follow for more updates and insights on cryptocurrency trading and market analysis.

1 $APT = 1 Apartment
Looking to add some Aptos around $12.0. The noticeable Massive Rounding Bottom pattern on the weekly chart signals a bullish market trend, indicating a big pump in the upcoming months, potentially reaching $50.
- Parallel execution of transactions
- AptosBFT consensus mechanism
- Scalability, security, and reliability
As the alt season is on the horizon, it could be the right opportunity to put your money in AMEX:APT . Let's stride ahead!

APTAPT is ahead of the market
It may go live in the next few days and increase to 2 tp points. The most beautiful entry points with this code have been exhausted

Aptos /APT Trade Idea Swing Setup - Aptos is fundamentally a very solid project
- Technically, IMO we can see Aptos moving above 20-25$
- I have shared my accumulation zones that might help you if you are interested in buying Aptos
- However, if you are holding Aptos then it surely has a lot more to present so it's better if you try holding for longer only if you have done your fundamental research
- If you are capital hungry then keep locking in gains

$APT idea for long setupInvalidation below the red area , it should not cross unless the liquidity grab happens aggressively

Aptos Trade Idea Setup Aptos can easily make your capital go double
- Watch out Aptos this can soon shoot up 20$ or even more
- Aptos can be bought in every dip you see around 10-11$
- Make sure that you hold Aptos if you are already holding it for a long time
- From a Trading Perspective watch out for 12$

Aptos Trade Idea Setup - Aptos carries a very strong potential of outperforming in the bull run
- Aptos can easily be seen at 30-40$
- Aptos needs first to take out its previous high and then you will see it trading above 15$
- IMO Accumulate aptos if you can under 10$ as much as you can

APTUSDT Long: High Timeframe Breakout and RetestLooking for a big push from APT to range highs after a significant breakout and then a flush, forming this retest. This is after a period of long consolidation.
TP1 is set at 10.937 offering a conservative exit at the local highs. TP2 is at higher timeframe resistance and liquidity zone

APT/Aptos Swing Setup Aptos is a Layer 1 Proof-of-Stake (PoS)
- Layer 1 usually moves once you see a decent infusion of money in Major Alts
- Aptos recently spiked up to 10.7$ yielding a gain of 13% in a day
- 9-9.4$ can be the zone where you all can think about accumulating Aptos for long-term
- I am very bullish on Aptos in the long run

APT/APTOS Trade Idea - Aptos is currently compressing a lot.
- From a High Time frame narrative you need to look at the bigger picture
- My Investment Targets for Aptos range from 13.5$-20$
- Do not exit this at a small gain at least aim for 30-50% mid-term
- From a Trading Perspective swings can be attempted here and aim for 13$ soon
- Major Alts are still left to blow up

APT Analysis: Testing Resistance with Bearish Bias
💎 APT is currently testing the resistance trendline of a descending channel. Additionally, a closer look at the candles reveals that red candles are larger than green ones, suggesting a higher likelihood of a bearish trend.
💎The price is also indicating CHoCH, and it's currently at the bearish OB, coinciding with the Fibonacci 0.618 level and the resistance trendline of the descending channel. These factors collectively support a bearish outlook for APT at this level.
💎For confirmation of the bearish scenario, we would ideally need to see a bearish engulfing candlestick pattern. Previous price action has shown bearish reversals following such patterns at every low-high point.
💎However, if the price manages to break above the bearish OB, we may witness a bullish movement. Still, it's important to exercise caution as such moves can be deceptive. Therefore, I would advise against considering bullish scenarios for APTUSD at this juncture.
