#APT Bearish Setup And IdeaAPT Is Also In Bearish Structure, Also Its Failing To Hold The Support, We Have A Small Reversal Area Downside, We Can See A Good Momentum In APT From Our Reversal Area, But Until Then There's No Pump (If Market Pumped, This Idea Will Be Invalidate).
Disclaimer -: This Is Not An Financial Advise,

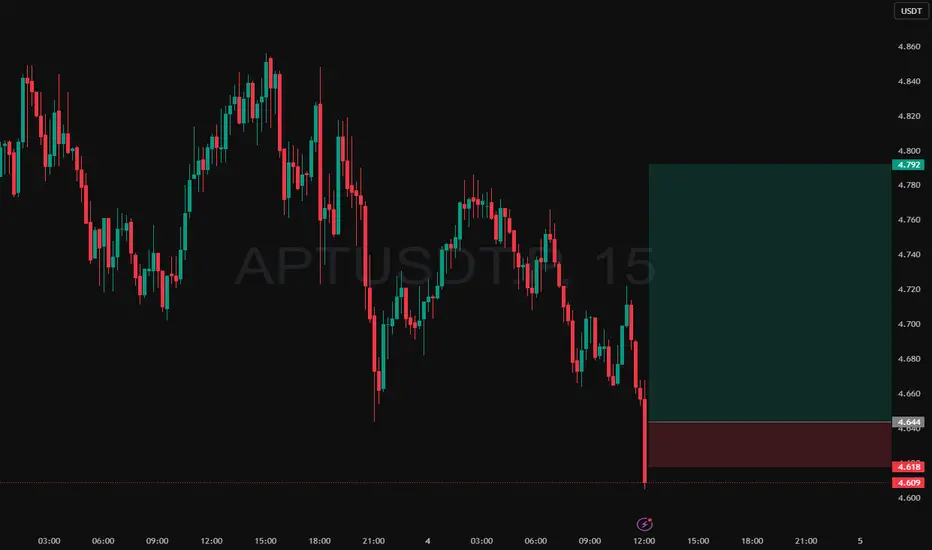
Intraday Long Setup | July 4th 2025 | Valid Until Daily ClosePrice retraced to a strong pivot zone.
Structure remains bullish with potential for continuation after pullback.
Tight risk control.
Watch for price reaction within the red zone. Entry only if confirmation appears
The setup expires at end of the daily candle close.
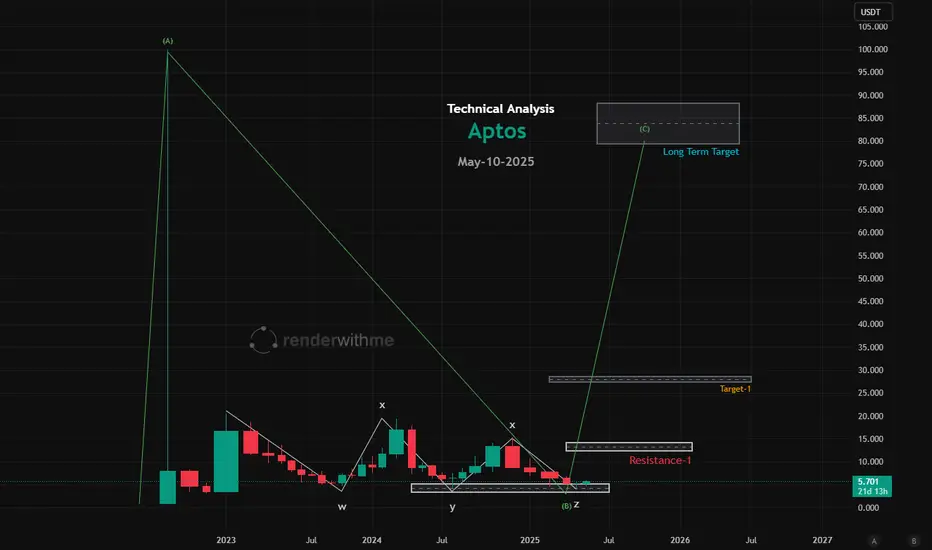
Aptos (APT) Technical Analysis -May10,2025 (READY FOR THE RALLY)#Current Market Overview
Price: As of recent data, Aptos (APT) is trading at approximately $5.76 USD at the time of posting with a 24-hour trading volume of around $224.1 million USD.
Market Cap: Approximately $3.57 billion USD with a circulating supply of 620 million APT.
24-Hour Performance: AP
APT LOOKING GOOD IN DAILY TFAPT looking great in daily time frame for some good strong upward move. Optimal target 1 would be around 14$. And target 2 would be approx 20$

aptos longconsolidation at the resistance on weekly tf likely to break up with a contingency of btc being stable to bullish at 90k. aptos can give a target of 18$


apt long;;;;;;;;;;;;;;;;;;;;;;;;;;;;;;;;;;;;;;;;;;;;;;;;;;;;
''''''''''''''''''''''''''''''''''''''''''''''''''
;;;;;;;;;;;;;;;;;;;;;;;;;;;;;;;;;;;;;;;;;;;;;;;;;;;;
;;;;;;;;;;;;;;;;;;;;;;;;;;;;;;;;;;;;;;;;;;;;;;;;;;;
---------------------------------
-----------------------------------
====================

APTUSDT LONG IDEAFED cut fundrate, It's time to long coin, follow your rule. management your position, time is answer.

APTOS Bullish DiamondWe can see a bullish diamond for APT.
This diamond was broken and it is now in a uptrend.
Since the rate cut last 18/09/24 we will see this bullish pattern performing well.
We could have some stops at $I9, $12, $14, $22.
Good luck with it.
Happy trading.
Raf

APTOS (APT) PRICE ANALYSIS APT is currently approaching upper boundary of descending channel which acts as huge resistance for more than 100 days. Expect a mini pullback first before breakout and then gain momentum.
If breakout is successful then targets could be 7.8, 9.5, 12.
We need to wait for successful breakout, entry

See all ideas
Summarizing what the indicators are suggesting.
Oscillators
Neutral
SellBuy
Strong sellStrong buy
Strong sellSellNeutralBuyStrong buy
Oscillators
Neutral
SellBuy
Strong sellStrong buy
Strong sellSellNeutralBuyStrong buy
Summary
Neutral
SellBuy
Strong sellStrong buy
Strong sellSellNeutralBuyStrong buy
Summary
Neutral
SellBuy
Strong sellStrong buy
Strong sellSellNeutralBuyStrong buy
Summary
Neutral
SellBuy
Strong sellStrong buy
Strong sellSellNeutralBuyStrong buy
Moving Averages
Neutral
SellBuy
Strong sellStrong buy
Strong sellSellNeutralBuyStrong buy
Moving Averages
Neutral
SellBuy
Strong sellStrong buy
Strong sellSellNeutralBuyStrong buy
Displays a symbol's price movements over previous years to identify recurring trends.