Whales loading $ARB – next 10x play in the makingWhales loading AMEX:ARB – next 10x play in the making
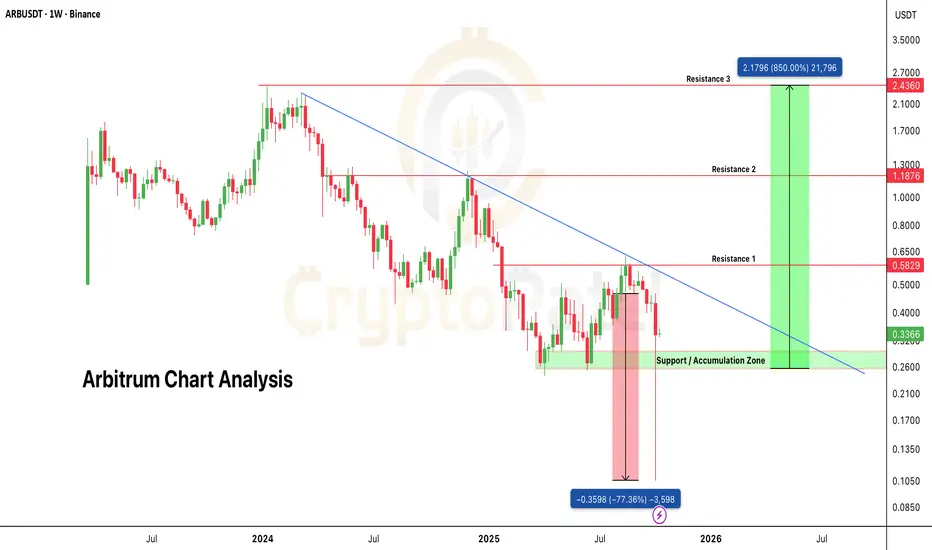
ARB/USDT faced a heavy sell-off during the recent crash, dropping over 77% within hours. But here’s the twist, it bounced back 238% from that low, showing strong market confidence.
What’s even more impressive: price never closed below the key support at $0.25, confirming this zone as a strong accumulation area for the long term.
Technical Overview:
Structure: Higher highs and higher lows forming after reclaiming demand zone
Support Held: $0.25 zone defended multiple times
Momentum: Bullish recovery with strong volume inflow
Bias: Long-term accumulation
Spot Accumulation Zone: $0.30 – $0.25
Targets: $0.58 / $1.18 / $2.43
Long-Term Potential: If the upcoming Altcoin Season kicks in, AMEX:ARB has the strength to deliver up to 10x returns from the current range.
NFA & DYOR
Trade ideas

$ARB Ranging in High R:R Zone – Breakout Targets at $1/$2/$5AMEX:ARB Ranging in High R:R Zone – Breakout Targets at $1/$2/$5
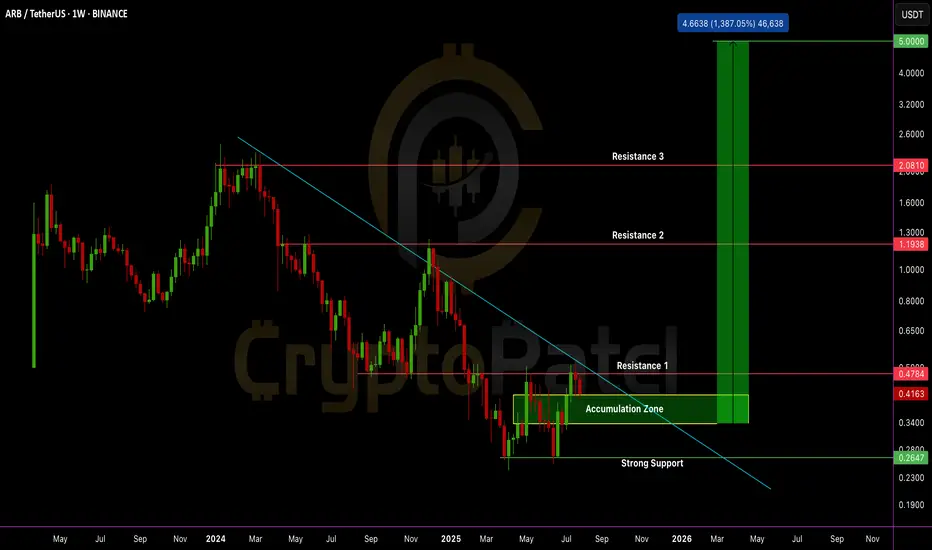
🔹 Trend: Macro downtrend intact, price rejected from descending trendline multiple times.
🔹 Current Drawdown: ~84% from ATH – indicating deep retracement and potential reaccumulation phase.
🔹 Structure: Price consolidating within a defined accumulation range between $0.30–$0.40. Demand is stepping in near range lows with wicks indicating buyer absorption.
Breakout Condition:
→ HTF (weekly) close above $0.48 with strong volume = structural breakout
→ Confirmed breakout above range high + trendline = bullish market structure shift
Upside Targets: $1.00 → $2.00 → $5.00
Invalidation Zone:
→ Clean HTF close below $0.24 = invalidation of accumulation thesis
→ Until then, dips into demand remain buy zones; invalidation only triggered on structural breakdown
R/R Outlook:
→ Wide stop, but multi-x reward setup
→ Favorable for long-term positional entries with defined HTF structure
Accumulation evident in key weekly demand zone. Break above $0.48 = trigger for bullish continuation structure. Until then, watch for HTF sweep + reclaim setups and volume confirmation.
Note: NFA & DYOR
renderwithme | Arbitrum Technical Analysis For next six months~~ Technical Analysis ~~
Current Price Action: ARB is trading within a descending channel or falling wedge pattern, with recent price action showing a bounce off the lower boundary around A key resistance level is near $0.70–$0.80, with the 200-day moving average acting as a dynamic resistance around $0.51.
August 2025 Forecast:Bullish Scenario: If ARB breaks above the $0.38–$0.50 resistance zone, it could target $0.66–$0.80, supported by a potential double-bottom formation and rising RSI momentum (currently neutral at 52–54). A breakout above $0.50 could confirm a trend reversal, with Fibonacci retracement levels suggesting targets at $0.49, $0.56, and $0.66.
Volume: Trading volume has been declining (e.g., $202M–$336M daily), but a surge in volume could accompany a breakout.
Fundamental AnalysisEcosystem Strength: Arbitrum remains the leading Ethereum Layer-2 solution, with a Total Value Locked (TVL) of $2.1B–$13.97B, capturing 34.1% of the L2 market share. It hosts major DeFi platforms like Uniswap and Aave, with 1.35M active wallets and $6.8B in stable coin supply.
Recent Developments: Partnerships with Robinhood and Gemini for on-chain U.S. equity transactions, alongside innovations like custom gas tokens and interest rate derivatives (Rho), enhance Arbitrum’s utility. However, setbacks like Nvidia’s rejection of Arbitrum’s AI ambitions and a proposed wind-down of the Gaming Catalyst Program could dampen sentiment.
Tokenomics: ARB has a circulating supply of ~4.96B out of a total 10B tokens, with a fully diluted valuation of ~$4B. Upcoming token unlocks in July 2025 could increase selling pressure, but long-term holder accumulation (6% wallet growth in three months) suggests confidence.
Market Sentiment: The Fear & Greed Index is at 73 (Greed), but ARB’s sentiment is mixed, with 17 bullish vs. 10 bearish technical signals.
breaking the $0.50 resistance and sustained market momentum.
Key Drivers:Bullish: Increased DeFi adoption, successful protocol upgrades, and a broader crypto market rally (correlated with Ethereum, 0.34; top 100 coins, 0.37).
Bearish: Token unlocks, macroeconomic uncertainty, or failure to break resistance could lead to a dip.
Probability: A breakout above $0.50 is possible if volume and ecosystem adoption increase, but a consolidation between $0.30–$0.60 is more likely given current volatility and mixed sentiment.
Critical ConsiderationsVolatility: ARB has shown 9.65% price volatility over the past 30 days, and its 83% drop from the all-time high ($2.40 in January 2024) indicates high risk.
Market Risks: Regulatory changes, Ethereum’s performance, and competition from other L2s (e.g., Optimism, Polygon) could impact ARB’s trajectory.
Investment Caution: While Arbitrum’s fundamentals are strong, short-term price action is uncertain. Long-term holders may find value near $0.50 – $0.80, but short-term traders should monitor the $0.50 resistance. Always conduct your own research (DYOR) and consider market risks.
Conclusion, Arbitrum’s price is likely to range between $0.30 and $0.70, with $0.35–$0.50 as a realistic average. A breakout above $0.80 could signal a bullish trend toward $1 –$2.80, driven by ecosystem growth and market momentum. However, token unlocks and resistance levels pose risks. Monitor volume, RSI, and key resistances ($0.38, $0.50) for short-term trades, and consider Arbitrum’s strong L2 fundamentals for long-term potential. For real-time updates, check platforms like CoinMarketCap or Arbiscan.
~~ Disclaimer ~~
This analysis is based on recent technical data and market sentiment from web sources. It is for informational \ educational purposes only and not financial advice. Trading involves high risks, and past performance does not guarantee future results. Always conduct your own research or consult a SEBI-registered advisor before trading.
# Boost and comment will be highly appreciated.

Arbitrum Technical Analysis for the year of 2025~~ Arbitrum ( AMEX:ARB ) Technical Analysis ~~
Current Price and Market Context (as of June 11, 2025)
Price: Approximately $0.3649 USD, based on recent data from CoinMarketCap, with a 24-hour trading volume of ~$169.5M.
Market Cap: ~$1.79B, ranking #67 among cryptocurrencies. Circulating supply is 4.9B ARB, with a fully diluted valuation of ~$3.67B if all 10B tokens are in circulation.
Recent Performance:
24 Hours: Up 2.16% to $0.3352 (noted in some sources, though prices vary slightly).
7 Days: Up 1.60%, underperforming the global crypto market (+2.80%).
30 Days: Up 4.54%, showing mild recovery.
1 Year: Down 70.06%, reflecting significant bearish pressure since its all-time high of ~$2.39 (January 2024).
Volatility: Estimated at 3.91% daily, typical for crypto assets
Trend shifted to bullish For Support Resistance and Targets
Chart for your reference
-- Disclaimer --
This analysis is based on recent technical data and market sentiment from web sources. It is for informational purposes only and not financial advice. Trading involves high risks, and past performance does not guarantee future results. Always conduct your own research or consult a SEBI-registered advisor before trading.
#Boost and comment will be highly appreciated

The Next Big L2 Gem? $ARB Is Breaking Out —Why It Could it 10x🚨 The Next Big L2 Gem? AMEX:ARB Is Breaking Out — Here's Why It Could 10x+ 🚨
🔰 What is Arbitrum?
Arbitrum is Ethereum’s top Layer-2 scaling solution using Optimistic Rollups.
It powers faster, cheaper transactions without compromising security.
🔰 Ecosystem Highlights
▶️ Arbitrum One – DeFi & dApps
▶️ Arbitrum Nova – Gaming & Social apps
▶️ Hosts major projects: Uniswap, Aave, GMX
▶️ Among the top L2s by TVL dominance
🔰 Tech & Innovation
▶️ Runs on fraud-proof optimistic rollups
▶️ Nitro upgrade boosted throughput + cut gas fees
▶️ Gives near-Ethereum experience with 10x lower costs
🔰 Tokenomics
▶️ Total Supply: 10B ARB
▶️ Airdrop: 1.162B (11.6%) to users & DAOs
▶️ Remaining: Treasury + future ecosystem rewards
➡️ Small circulating supply = potential supply squeeze on demand surge
🔰 Backers & Partnerships
▶️ Built by Offchain Labs
▶️ Investors: Lightspeed, Pantera, Coinbase Ventures
▶️ Listed on Binance, Coinbase, KuCoin
▶️ Integrated by top Ethereum protocols (Uniswap, etc.)
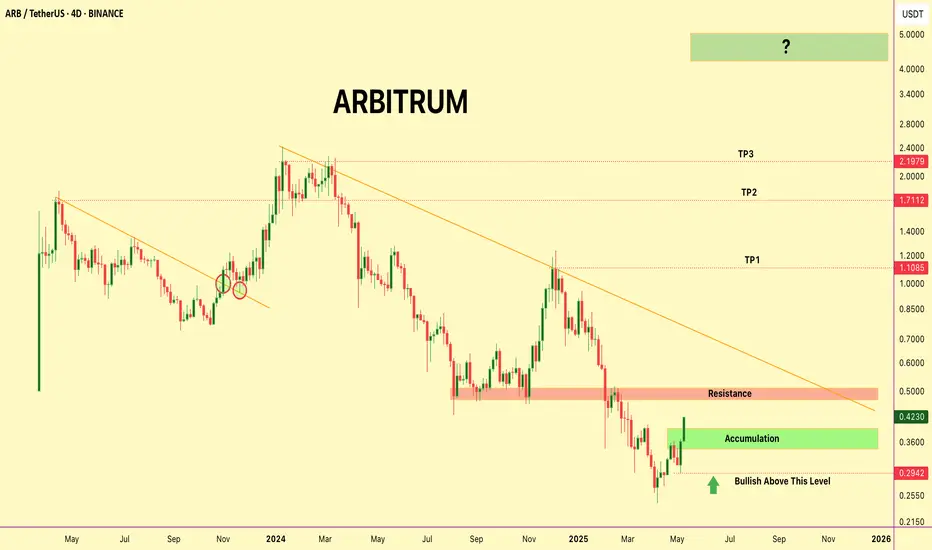
🔰 TECHNICAL BREAKDOWN: ARB/USDT HTF Chart
✅ Accumulation Zone: $0.29–$0.42
▶️ Above $0.4028 = momentum shift zone into Super Bullish
▶️ Next resistance: $0.48–$0.52 (watch for breakout!)
▶️ Targets: $1.10 / $1.71 / $2.19 / $5
⚠️ Hold above $0.2942 to keep setup valid
✅ Strong volume + higher lows = bullish confirmation
▶️ DYOR | NFA
🔰 Why 10x–50x Is Possible
▶️ Top Ethereum L2 by usage
▶️ Real utility, not meme hype
▶️ Limited unlocked supply = buyer advantage
▶️ L2 sector will explode if ETH demand grows
▶️ Could capture a huge chunk of ETH's scaling market
🔰 Final Take
▶️ AMEX:ARB is more than hype — it's infrastructure.
▶️ In a bull market, this is the kind of setup that runs hard.
▶️ Keep it tight on your watchlist.
ARB ready to get sky rocket!ARB is forming mega bullish wedge and getting ready for a large bull cycles.

ARBUSDT: Will This Key Support Hold or Trigger a Reversal?Yello, Paradisers! ARBUSDT has formed a descending triangle pattern accompanied by bullish divergence, and the current price rests within a key support zone, heightening the potential for an upward move.
💎If ARBUSDT shows an I-CHoCH (internal change of character) or develops bullish formations like a W-pattern or inverse head and shoulders from here, the likelihood of an upward move increases significantly.
💎A more secure signal would be a breakout with a candle close above the resistance zone. However, don’t overlook BTC’s price action — it’s crucial for validating any breakout's strength.
💎If the price breaks down and closes a candle below the support zone, it will invalidate this bullish outlook. In that scenario, patience is key; wait for a more favorable structure before making a move.
🎖 Remember, trading smart means adapting to new data and preserving capital. Stay disciplined and vigilant, Paradisers!
MyCryptoParadise
iFeel the success🌴

ARB BREAKING OUT IN 4H TIMEFRAME AMEX:ARB got a breakout alert with strong bullish momentum. Bulls are eyeing a key resistance level at 0.6530, and as long as we hold above 0.50.
If we can maintain this momentum, the first target is around 0.68. Beyond that, look for the next significant resistance at 0.72 and above 0.76.

Arbitrum $5 Potential in Current Bull Market?ARBITRUM (ARB/USDT) Chart Analysis:
➡️ Liquidation Sweep: ARB has recently hit a high liquidation zone, wiping out all longs that were opened near the top. Even those with lower leverage positions have been liquidated, pushing the price into a very deep dip.
➡️ Accumulation Zone: This dip presents a strong accumulation opportunity in the spot market. I'm starting to accumulate ARB between the $0.58-$0.4 range. This area is ideal for long-term investors looking to capitalize on the current market conditions.
➡️ Resistance Levels:
Major Resistance 1: $0.8
Major Resistance 2: $2
Should ARB break through these two key resistance levels, we could potentially see the price rally to $5-$8.
➡️ Investment Strategy: I've initiated my buy orders, and my target is set at $5. After losing the $1.84 support, ARB has dropped by 77%, which marks an 82% decline from its all-time high (ATH).
➡️ Bull Run Expectation: In the current bull run, I am aiming for a potential 10x return on ARB. This could be a prime opportunity to position for significant gains.

ARBUSDT: Could This Be the Next Big Breakout? Yello, Paradisers! Are you ready to catch the next big move in ARBUSDT? Let's break it down!
💎ARBUSDT has formed a falling wedge pattern and has taken liquidity, which increases the probability of a bullish move. However, there are key confirmations we need to watch for:
💎For a bullish trend confirmation, we need a breakout from both the falling wedge and the resistance zone. This will significantly increase the likelihood of a sustained upward move.
💎We can expect a bullish move from the current level, but we need to see an Internal Change of Character (I-CHoCH) and an Internal Break of Structure (I-BOS) toward a bullish market structure. These indicators will improve our chances.
💎If we see a candle closing below the small support level, this would invalidate our entire idea.
If you want to be consistently profitable, you need to be extremely patient and always wait only for the best, highest probability trading opportunities. Stay focused, patient, and disciplined, Paradisers. The market is setting up for a potentially significant move, and we want to be ready! 💪
MyCryptoParadise
iFeel the success🌴

Will ARB Price Fall Below Its All Time Low?Arbitrum has a market cap of $2.6 Billion and is ranked 33rd in the cryptoverse. The volume of the asset price has observed a drop of over 38% in the past 24 hours. ARB token price is currently trading near $0.82 with a drop of 1.29% in the intraday session.
ARB token price is currently forming weak consolidating candles on the daily chart. It is trading below the 50 and 100 Daily Moving Average. The upside trend of ARB can see a halt near the value of $1. Meanwhile, the support for the asset price can be seen near $0.75
The RSI of ARB is near 37 with a weak downside slope in it. The overall sentiment of the RSI is bearish in nature .

Will ARB Price Hit Its All Time Low Of $0.74 Or Go Beyond $2.5?Arbitrum has a market cap of $2.7 Billion and is ranked 40th in the cryptoverse. ARB token price has observed a decline of 21% in the volume while its VM ratio is near 0.1. ARB token price is currently trading near the value of $0.944 with a drop of over 5% in the past one year.
ARB price is currently forming strong bearish candles on the daily chart. It is trading below the 50 and 100 EMA. The upside trend of the asset price can see a halt near $1. Meanwhile the support of the ARB can be observed near $0.85.
The RSI of ARB is currently near 36 with a negative slope in it. The overall sentiment of the indicator is bearish in nature.

ARB Dropped By 7% In Last One Year, Will A Bullish Trend Come SoArbitrum has a market cap of $3.23 Billion and is ranked 32nd in the cryptoverse. The volume of the ARB has seen a drop of 10% in the intraday session. The VM ratio of the ARB token is 0.1 suggesting a consolidation in price. The token price is currently trading near $1.15 with a slight gain in the intraday session.
The asset price is forming a consolidating range of candles on the daily chart. It is trading below the 50 and 100 EMA. The upside momentum of price can see a halt near $1.35. Meanwhile the support price for ARB can be seen near $1
The RSI of ARB token is near 51 with no slope in it. The overall sentiment of the RSI is neutral in nature.

ARB SHORT SET-UP ARB making double top pattern and BTC being sidewise and BTC.D being bullish, sentiments go bearish for ARB.

ARB/USDT Ready for $10 in current bull market ?Arbitrum ( LSE:ARB ) Technical Analysis: Insights for Traders
Short-Term Bearish Trend Analysis
Arbitrum ( LSE:ARB ) is currently exhibiting a bearish trend in the short-term trading window. Traders should monitor for potential declines or stabilization in the market, signaling a possible reversal or continuation of the downtrend.
Key Accumulation Zones Identified
The optimal accumulation zone for LSE:ARB is identified between $1.00 and $0.90. This price range is deemed strategic for traders looking to buy LSE:ARB at a lower price point, potentially capitalizing on future price recoveries.
Projected Long-Term Price Targets
In the long-term perspective, Arbitrum aims for significant price milestones at $5 and even $10. These targets suggest a bullish outlook and represent critical levels for LSE:ARB to achieve substantial growth.
Critical Support and Resistance Levels
The support level at $1.30 is crucial; a breach below this point could lead the price to fall under $1.00, marking a new bearish phase. Conversely, resistance at $2.15 is the immediate hurdle. Overcoming this barrier is essential for LSE:ARB to initiate a stronger bullish momentum.
Conclusion: Importance of Technical Diligence
This analysis does not constitute financial advice but serves as a technical overview based on current chart patterns and market behavior. Traders are encouraged to conduct their own technical analysis (TA) and research diligently before engaging in trading activities.
Stay engaged with market trends and updates to navigate the volatile landscape of cryptocurrency trading effectively.
Follow for more Crypto quality chart analysis.

ARB: Keep an Eye on Breakout Levels and Watch for Confirmation🚀💎Paradisers, #ARBUSDT has recently formed a W pattern within a supportive trendline, signaling a potential reversal after the price dipped below previous lows, likely indicating a shakeout of weak-handed investors.
💎 A breakout above the resistant level, coupled with confirmation of the W pattern, would significantly increase the likelihood of a bullish move. Such a scenario could suggest that the price has absorbed internal range liquidity and is poised to pursue external range liquidity.
💎 In the event of a breakdown below the supportive trendline, traders may anticipate a bounce from the bullish Order Block (OB). However, it's crucial to seek proper confirmation in this scenario, given its relatively lower probability.
💎 Nevertheless, if #ARB descends below the bullish OB, it may be prudent to adopt a wait-and-see approach and refrain from immediate action. Waiting for clearer price action to confirm would be advisable in such instances.

ARBThe beautiful C wave correction zone in frame H4 is forming a temporary peak, which will break as soon as it cuts the upward ichimoku and enters 3 in a large frame with great potential.

Potential Bullish Move for $ARB!🚀 💎 ARB is currently finding support from a supportive trendline, indicating a potential bullish move in the near future.
💎A bullish move is expected above the resistance level, with targets expected to reach until the next resistant levels.
💎In the event of a breakdown below the trendline, the price may find support at the previous resistance level, which could now act as support now. Confirmation via a bullish candlestick pattern would be essential in this scenario.
💎However, if ARBUSDT breaks down below both of these levels, it would be considered bearish. It's advisable to wait for better price action to form in such cases before making any trading decisions.

ARB: Pump will come anytime Hey Guys, Don't forget to hit Boost Button & If you want more such ideas then follow me.
ARB broke pennant pattern, So we may see a good move in the coming times.
See chart for more understanding...!!
Disclaimer: I am not financial Advisor; this is my opinion I am some guy on the Internet...!! Crypto market is highly volatile, do your own research and jump into the trade.

ARB/ Arbitrum Trade Idea - ARB has delivered 1.5x returns post my call-out
- ARB still has the potential to keep growing more
- ARB can first take out the highs grab some liquidity above the wicks and post that retrace back to its origin
- ARB isn't my long-term pick I would prefer swinging my money here and taking it out as soon as possible
- Don't risk more than 10%

Retesting is chance for bullish | Long BiasOn 1h TF
ARB has dropped too strong but closed above Support so that's a good signal continue to go up
I expect ARB will test $1.776 before come back Bullish Race
Time will tell

Arbitrum $10 Potential in Bull Market if Breakout this Resistanc#Arbitrum Hits New All-Time High
LSE:ARB has just reached a new ATH of $1.84, currently trading at the red box resistance.
If it breaks upward, #ARB could experience super bullish growth.
However, if rejected, there may be more dip buying opportunities around $1.30.
In a bull market, we can envision ARB/USDT price reaching $10.
Our long-term outlook remains bullish.
Support: $1.50/$1.30
Resistance: $1.75
Stay tuned for more updates and insights on Arbitrum's performance!
#Crypto #Bitcoin #Bullmarket
