$ASTER PRICE PREDICTION | HTF ACCUMULATION | 2400% MACRO POTENT?SEED_WANDERIN_JIMZIP900:ASTER is currently trading inside a high-timeframe accumulation base after a prolonged downtrend.
Price compression near major demand suggests trend exhaustion and a potential volatility expansion ahead.
Market Structure Overview
✅ Prolonged downtrend → exhaustion phase
✅ HTF accumulation forming
✅ Descending trendline pressure building
✅ Volatility compression → expansion setup
SEED_WANDERIN_JIMZIP900:ASTER is already ~78% down from its September 2025 ATH, significantly improving risk–reward for long-term positioning.
Key Accumulation Zones
Zone 1: $0.70 – $0.60 ✅ (Filled – bounce expected)
Zone 2 (Macro flush scenario): $0.45 – $0.35
→ Strong long-term accumulation zone if broader market weakness persists
Upside Targets (CryptoPatel View)
$1.50 → $2.00 → $5.00 → $10.00 → $20.00
Macro extension: $20 – $30 (long-term, high-risk / high-reward)
Invalidation: Loss of HTF demand structure → High-risk hold
Market Talk
As per public disclosures circulating on 2 Nov 2025, CZ was reportedly exposed to SEED_WANDERIN_JIMZIP900:ASTER below ~$0.91, holding approximately 2.09M ASTER.
While not a signal, this adds sentiment confidence to the long-term accumulation narrative.
Long-Term Thesis
This phase appears to be early accumulation, not confirmation.
If HTF demand holds and structure flips bullish, $5–$10 becomes realistic, with $20+ as a full-cycle expansion scenario.
Disclaimer:
This is technical analysis & market discussion only — not financial advice.
Always manage risk and do your own research.
What traders are saying

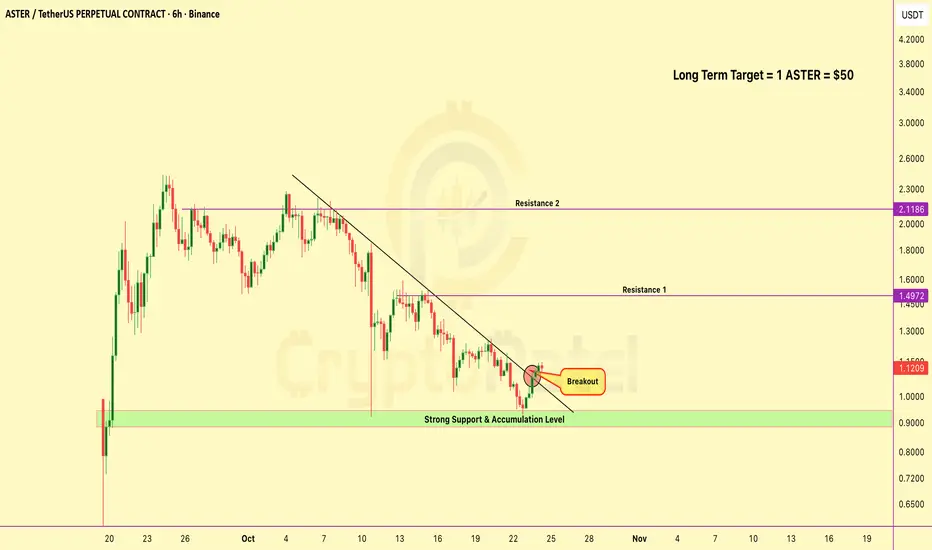
$ASTER PRICE FORECAST | CAN ASTER HIT $10–$15? | ANALYSIS BY CPBINANCE:ASTERUSDT | Breakout Structure From HTF Accumulation | TA By CryptoPatel
ASTER is trading at a high-timeframe accumulation base following a prolonged corrective phase. Price compression near demand indicates trend exhaustion with increasing probability of a bullish expansion.
Technical Structure
Accumulation range holding: 0.65 – 0.75
Descending trendline pressure building
Strong demand reaction inside accumulation zone
Volatility contraction → expansion setup
Key Levels
Bullish While Above: 0.65
Invalidation: Daily close below 0.60
Upside Targets: $1.50/$2.00/$5.00/$10.00/$15.00
If price accepts above the range high, structure supports a multi-leg continuation move.
😄 Fun Note: Market whispers say even CZ might be quietly watching ASTER, accumulation phases tend to attract smart eyes.
Disclaimer: This is technical analysis, not financial advice. Markets are probabilistic. Manage risk accordingly.

ASTER Seeing early signs of a bullish reversal - ASTER is compressing into a make or break zone after a steep selloff and this is where reversals usually start forming.If this wedge resolves upward, the next leg could quickly reclaim major levels.
1. Pattern Overview
We’re trading inside a falling wedge (tightening lower highs + lower lows).
That structure often signals seller exhaustion: bears keep pushing, but each push gets weaker as liquidity dries up. When price breaks the wedge, it’s usually because buyers finally absorb the remaining supply, triggering a squeeze back into prior resistance.
2. Key Levels
Support
- 0.6800 (current pivot) — price is trying to base here; holding this keeps the “reversal attempt” alive
- 0.6540 (invalidation / sweep zone) — lose this and the market is telling you demand failed at the lows
Resistance
- 0.7269 (first decision level) — this is the near-term ceiling; a close above shifts momentum bullish
- 1.0014 (major reclaim level) — prior structure level; if reclaimed, it often flips into support and accelerates continuation
3. Market Outlook
Bias leans cautiously bullish while price holds above 0.6540 and keeps compressing inside the wedge.
Momentum shifts cleanly bullish on a daily close above 0.7269 + successful retest. That’s typically where institutions get involved not on the first spike, but on the confirmation + pullback, when risk is defined.
4. Trade Scenarios
🟢 Bullish Scenario
Entry trigger: Daily close above 0.7269 (or wedge breakout) + retest holding
First target: 1.0014
Second target: 1.3985
Why: Breakout from compression often leads to a fast move back into prior supply zones as shorts unwind and buyers step in.
🔻 Bearish Scenario
Breakdown trigger: Daily close below 0.6540
Target: 0.55 → 0.50 demand zone
Why: Losing the sweep/invalidation level usually means the “base” failed and liquidity below gets targeted next.
- Final Note
Don’t chase the first breakout candle wait for the daily close + retest to keep risk tight.
If you want more clean, level-based breakdowns like this, follow me for daily chart setups.

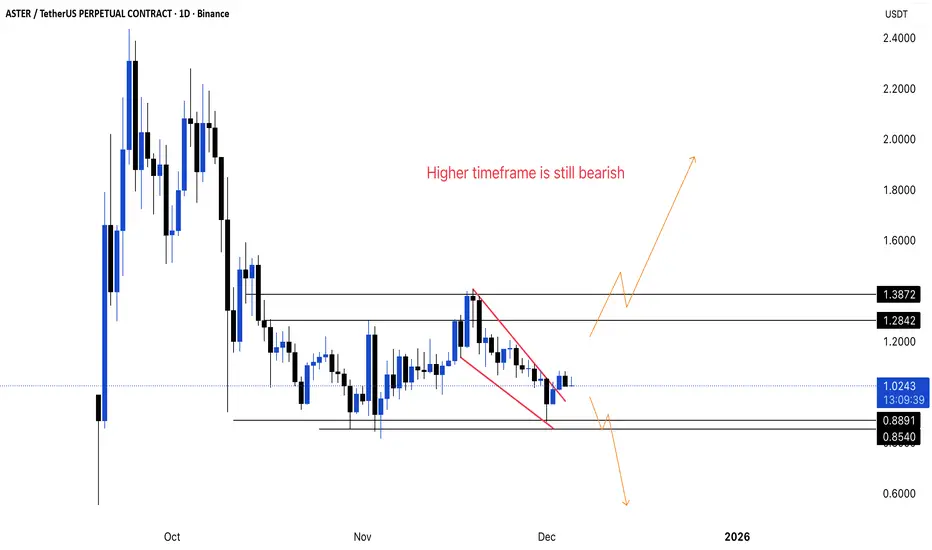
ASTER - what going to happen?📊 ASTER/USDT Update
🔎 Technical Observation:
- The pair is trading within a descending channel/falling wedge pattern, indicating a period of consolidation after a sharp decline.
- Price action shows compression near the apex of this wedge, suggesting imminent volatility.
- The chart explicitly notes that the "Higher timeframe is still bearish," implying the current structure is a pause within a larger downtrend.
⚠️ Key Levels:
- Support: 0.8891, 0.8540
- Resistance: 1.2842, 1.3872
📉 Market Outlook:
- Neutral to Bearish bias technically, but the falling wedge is often a bullish reversal pattern if validated.
- Scenarios: A breakout above the red wedge resistance could trigger a relief rally toward 1.2842. Conversely, rejection here keeps the bearish trend intact, likely testing 0.8891.
💡 Trade Idea:
- The market is at a decisive bifurcation point. The high-probability setup awaits a confirmed candle close outside the wedge. A clean break above the wedge upper trendline validates a long position targeting the imbalance at 1.2842. However, if price fails to break out and loses the wedge bottom, the bearish continuation will swiftly target 0.6000 levels as indicated by the lower projection arrow.
✅ Closing Note:
Wait for the breakout confirmation to avoid chop; manage risk tightly as volatility expands.
Will $ASTER hit $100 in future which is 100x from Current Price?IMO, SEED_WANDERIN_JIMZIP900:ASTER has the potential to become the next CRYPTOCAP:BNB within 4–5 years. I’m gradually accumulating for the long term.
Accumulation zone: around $1 or below, these levels may not return once the market matures.
If fundamentals and adoption grow as expected, a $50–$100 valuation in the future isn’t impossible.
Note: NFA & DYOR
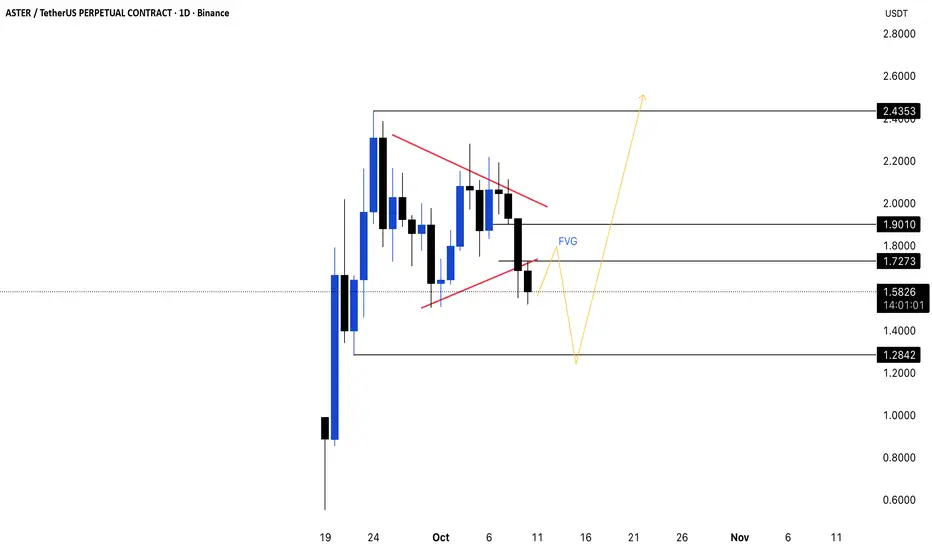
ASTER IS SCAM? FUTURE TARGET !📊 ASTER/USDT 1D Update
🔎 Technical Observation:
- Breakdown from symmetrical triangle, signaling momentum shift.
- Strong bearish impulse candle, price below previous swing low.
- Fair Value Gap (FVG) between $1.73 and $1.90.
⚠️ Key Levels:
- Support: $1.2842
- Resistance: $1.7273, $1.9010, $2.4353
📉 Market Outlook:
- Bearish in the short term after pattern breakdown.
- Likely continuation to test support at $1.2842. Watch for reaction here.
💡 Trade Idea:
- Capitulation drop towards $1.2842 support.
- Anticipate bullish reversal near this zone. Target for reversal: $1.8000 (FVG fill).
- Reclaiming this zone signals bullish momentum towards $2.4353.
✅ Closing Note:
- Reaction at $1.2842 key; look for absorption and reversal signals.