$AVAX is shaping a clear impulsive structure from the recent lowCRYPTOCAP:AVAX is shaping a clear impulsive structure from the recent low near 7.55, and price action is now transitioning from correction → expansion.
What the chart shows clearly:
Wave (1)–(2) formed the base
Strong impulsive wave (3) pushed price higher
Wave (4) completed with a healthy pullback and sideways digestion
Price is now attempting wave (5) expansion
Fibonacci projections for Wave (5):
0.618 extension → ~9.52
1.0 extension → ~9.89
1.618 extension → ~10.50
Current price is hovering around 9.15–9.20, which is a decision zone:
Holding above this region keeps the bullish wave structure intact
This sideways action looks like energy buildup, not distribution
🔼 Bullish continuation
As long as price holds above 8.95–9.00
Expect gradual push toward 9.52 → 9.89
Momentum continuation could extend to 10.50
🔻 Invalidation
A clean loss below 8.85
Would weaken the wave (5) thesis and delay expansion
What traders are saying

Chapter 15 — Confirmation AddictionHow waiting for “more confirmation” creates late entries (and worse trades)
(AVAXUSDT.P — 1H chart reference attached)
Most traders don’t lose because they’re “wrong.”
They lose because they enter after the move has already paid the early participants.
That behavior has a name: Confirmation Addiction.
It sounds responsible (“I’m waiting to be sure”).
In reality, it’s often fear disguised as discipline — and it produces the same outcome again and again:
✅ you feel safe
❌ you enter late
❌ your stop gets wider
❌ your R:R collapses
❌ you get chopped or stopped on the first pullback
What “Confirmation Addiction” looks like on this chart
On your panel, the market is MTF ALIGNED bullish, but not trending cleanly:
H1/H4 Context: Bullish
Daily Context: Neutral
Market Phase: RANGE
ADX ~14.7 (weak trend)
Participation: Weak
Risk Mod: Negative (divergence / internal weakness)
This combination is the perfect trap for late entries:
In a range, price repeatedly does this:
forms a base
pushes up a bit
pulls back and tests
pushes again
then fakes / retests / compresses
A confirmation-addicted trader keeps stacking requirements:
“Let it break the high”
“Wait for candle close”
“Wait for retest”
“Wait for another close”
“Wait for one more push”
By the time all of that happens, you are buying after the best location is gone — usually near the top of the internal range, right before a pullback.
Why “more confirmation” is mathematically worse
Each extra confirmation usually means one of two things:
1) You pay with distance
Your entry moves farther from the invalidation point → your stop must widen → position size shrinks → your upside becomes limited.
2) You pay with timing
The market has already done the displacement. Now you’re entering when mean reversion and pullback probability is highest.
So “more confirmation” often improves emotional comfort but damages:
location
R:R
trade longevity
drawdown tolerance
The real truth
Confirmation is not the edge. Location is the edge.
Confirmation should only answer:
“Is entry permitted here?”
Not: “Can I remove all uncertainty?”
Because uncertainty never disappears — it just gets more expensive.
MARAL Solution: Replace “More Confirmation” with “Entry Permission”
On this chart, you already have the correct framework showing you the truth:
MTF aligned bullish = direction permission exists
Range phase + weak ADX = breakout-chasing is dangerous
Risk mod negative = don’t over-trust pushes; demand clean reaction
Supportive LTF exec = allow precise entries only at good location
So the fix is simple and brutal:
Rule 1 — Define the Earliest Valid Entry (EVE)
Your entry is valid when you have:
HTF permission (aligned bias)
location (discount / range low / protected structure)
reaction (rejection or displacement + micro shift)
Anything beyond that is not “smart.”
It’s often late.
Rule 2 — Use a Two-Step Entry, not a “Perfect Entry”
In range + weak trend environments:
Step A: Probe entry at best location with tight invalidation
Step B: Add only if the move proves itself (structure + continuation)
This keeps you early without being reckless.
Rule 3 — Confirmation should control size, not timing
If you want “extra confirmation,” fine — but don’t delay the entry.
Instead:
Enter with smaller size at EVE
Scale only when the market pays you (acceptance + continuation)
That’s how professionals stay early and controlled.
How to spot Confirmation Addiction in real time (self-audit)
If you catch yourself saying any of these, you’re in it:
“Let me wait for one more candle…”
“I’ll enter after the breakout is confirmed…”
“I missed the first move, I’ll take the next one…” (next one = worst location)
“I need the market to prove it” (translation: I want certainty)
Execution takeaway for this AVAX setup
With MTF bullish but range + weak ADX, your best money is usually made by:
entering at the range base / discount with tight invalidation
not chasing the last confirmation candle near the highs
Trend permission ≠ trend conditions.
That’s why “aligned” can still chop you if you enter late.
A late entry is not a safer entry — it’s a more expensive entry.
Trade uncertainty with rules, not with delay.
(Educational only — not financial advice.)
#Execution #TradingMindset #DayTrading #SwingTrading #CryptoTrading #FuturesTrading #BreakoutTraps #RangeTrading #RRMindset #PositionSizing #TradeManagement #Edge

$AVAX PRICE FORECAST | IS $200 POSSIBLE? | ANALYSIS BY CPCRYPTOCAP:AVAX PRICE FORECAST | IS $200 POSSIBLE? | ANALYSIS BY CRYPTOPATEL
#AVAX Is Holding A Strong High-Timeframe Accumulation Zone On The Weekly Chart After A Deep Multi-Year Correction From The 2021 ATH. Current Structure Suggests Smart Money Re-Accumulation Near Long-Term Demand.
Weekly Technical Structure:
✅ Strong All-Time Support / Accumulation Zone: $11 – $13.80
✅ Multiple Confirmed Reactions From This Zone Since 2022
✅ Macro Descending Trendline From ATH Still Capping Price
✅ Recent Sell-Side Liquidity Sweep Into Demand
✅ Bullish Confirmation Trigger: Weekly Close Above $15
CryptoPatel Targets (HTF Expansion):
🎯 TP1: $32.7
🎯 TP2: $57.9
🎯 TP3: $114.5
🎯 TP4 (Cycle Extension): $200+
As Long As AVAX/USDT Holds Above $11, The Macro Bullish Bias Remains Valid.
This Is A Patience-Based Weekly Setup With Asymmetric Risk-Reward, Best Suited For Spot & Swing Traders Using HTF Confirmation.
Invalidation:
❌ Weekly Close Below $10
TA Only. Markets Are Probabilistic. Always Manage Risk & DYOR.

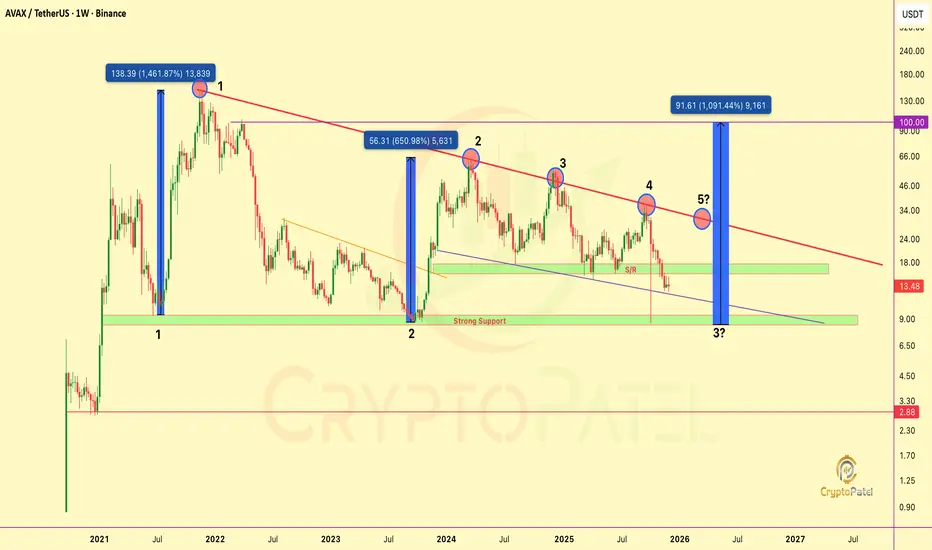
$AVAX on the Edge — $100 Breakout or $3 Crash?CRYPTOCAP:AVAX Is Approaching a Critical Technical Turning Point: Here’s What the Chart Really Shows
#AVAX is currently trading in a bearish market structure, but the chart is setting up for a major decision zone that could define its long-term trajectory.
Major Resistance Pressure Building
AVAX has tapped the Red trendline resistance 4 times, creating a historically strong barrier.
However, repeated tests have weakened the level, and the next approach, the 5th attempt near the $30 region, carries a significantly higher probability of a breakout.
A confirmed breakout here could shift momentum aggressively, opening the path toward the $100 zone.
Bearish Structure Still Dominant
Price has already lost key support and continues to trade below the $16–$17 zone, which has now flipped into resistance.
This is the first structure level bulls must reclaim to regain momentum.
High-Probability Accumulation Zone
The $10–$8 support zone remains the most critical area on the chart:
👉 June 2021: +1461% rally from this zone.
👉 September 2023: +650% rally within six months.
If AVAX revisits this zone again, it would represent the 3rd historical test, which has previously acted as a powerful accumulation region and could offer strong long-term upside potential.
Critical Breakdown Level
A loss of the $8 support would invalidate the bullish structure and expose AVAX to a potential freefall toward $3–$2, where no major historical support exists.
This is a pure technical-analysis view. Not financial advice. Always DYOR.
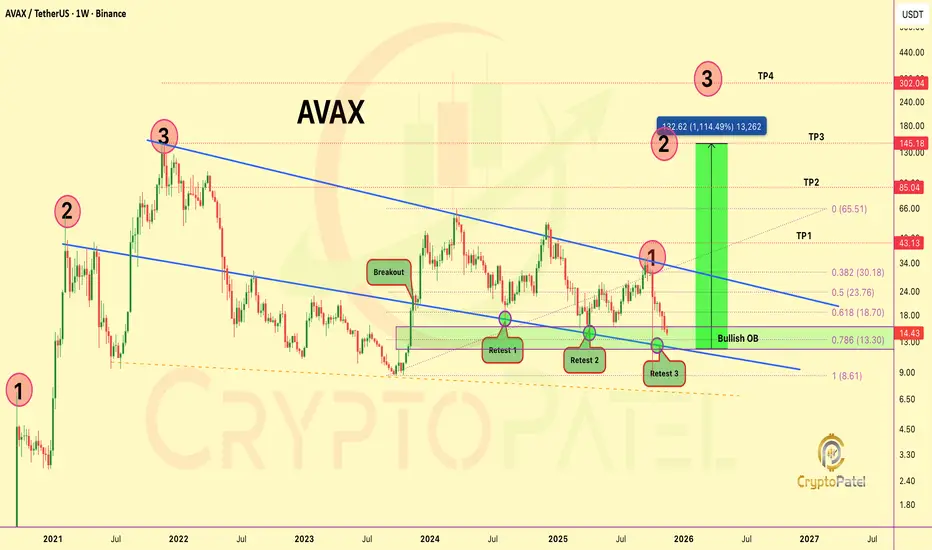
$AVAX IS SITTING ON A MACRO LEVEL YOU CAN’T IGNOREAVAX IS SITTING ON A MACRO LEVEL YOU CAN’T IGNORE
AVAX just Tapped a 4-year Demand Cluster:
Bullish OB + 0.786 Fib + long-term wedge support, the same region that triggered every major reversal since 2021.
This is Retest #3, where high-timeframe structures typically shift from capitulation → accumulation.
Liquidity below the range is cleared. Sellers are exhausted. Volatility is compressed to extremes.
If this Base Holds, the Upside Map is already Defined:
$43 → $85 → $145 → $302 (Full wedge expansion potential: ~1,100%)
This is the kind of level where institutions position quietly while retail exits loudly.
IMO, the Best Long-run Accumulation Range remains $15–$11.
Note: NFa & DYOR
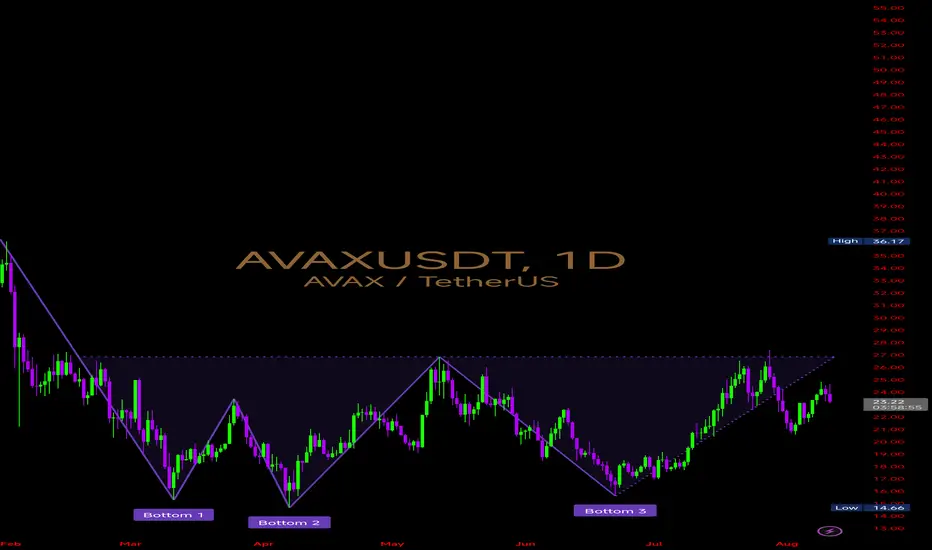
$AVAX – Daily Timeframe Outlook CRYPTOCAP:AVAX – Daily Timeframe Outlook
The chart is displaying a Triple Bottom reversal structure — a bullish formation that often signals trend exhaustion on the downside and the potential for a sustained uptrend if neckline resistance is breached.
🔹Triple Bottom Lows: $14.66 (Bottom 3), $15.20 (Bottom 2), $15.50 (Bottom 1) — strong accumulation zone
🔸Neckline Resistance: ~$25.80 – $26.00 — the key breakout trigger zone
🔹Immediate Support: $21.80 – $22.20 (former swing high support)
🔸Macro Resistance above Neckline: $28.50 – $30.00 zone
The three clean retests of the $14–15 region show strong buyer defense, signaling value accumulation
Current price action is in the mid-range between the neckline and recent support, with momentum recovering after the latest pullback
The pattern height (neckline to bottoms) suggests a sizeable upside potential if a breakout occurs
Volume expansion will be critical — breakouts without it risk turning into bull traps
⚡ Probable Scenarios
1. Bullish Continuation: Daily close above $26.00 with volume could confirm the Triple Bottom breakout, opening the door for a measured move toward the $36–38 zone
2. Range Continuation: Failure to clear $26.00 may keep CRYPTOCAP:AVAX in a sideways range between $22 and $26 until macro sentiment shifts
3. Bearish Breakdown: A close below $21.80 would weaken the setup, potentially dragging price toward the $19.00–$20.00 area for a deeper retest
Conclusion : The structure leans bullish, but the $26 neckline is the key battleground. A decisive reclaim above it could flip the long-term trend, while repeated rejections may keep #AVAX consolidating.
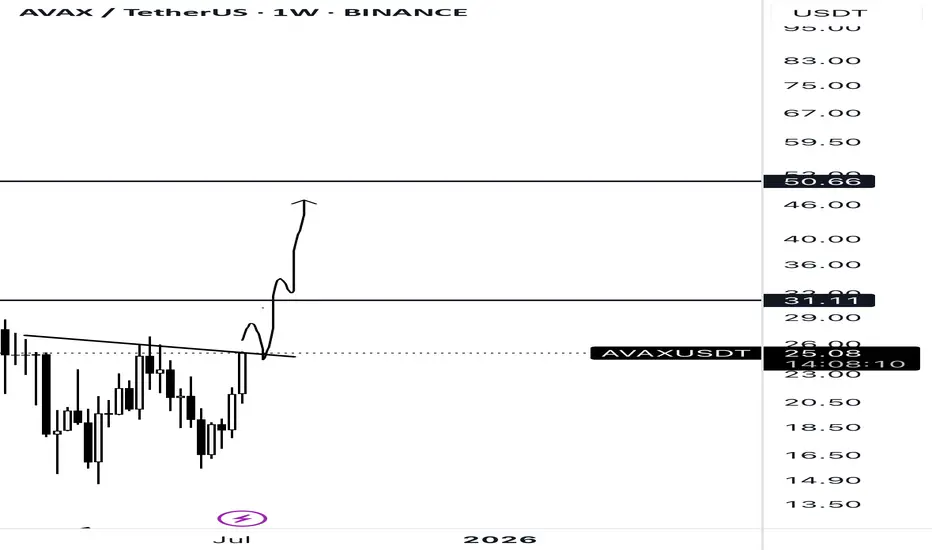
AVAX is about to breakout AVAX is going to breakout from this trend line.
Just follow the chart and make money
avaxBased on my observations, I see a setup for a swing trade with significant potential.
Entry Strategy: I will look for confirmation around the $16.53 support zone. Ideally, wait for a bullish candlestick pattern (such as Hammer, Doji, or Bullish Engulfing) to form on the Daily timeframe as an early signal that buyers are starting to take control.
Stop Loss (Risk Management): This is the most important part. To protect capital if the support fails to hold, I will place a Stop Loss below the support zone, for example around the $14.50 level. A daily candle close below $16.00 will be a strong warning signal and a close below $14.50 will be a complete invalidation of this bullish scenario.
Take Profit: The main target of this setup is the resistance level at $55.54. And has a potential profit of more than +230% from the anticipated entry point.
Conclusion
AVAX/USDT is at a very crucial point. Holding support at $16.53 could be the trigger for a significant rally in the coming months. However, failure to hold this level will open the door for further declines.
With a tight Stop Loss, this setup offers an opportunity with a much greater reward/risk ratio. Let’s take a closer look at the price reaction at this support zone.
Disclaimer: These are my personal views and trading plan. It does not constitute financial advice. Do your own research (DYOR) before making any investment decisions.

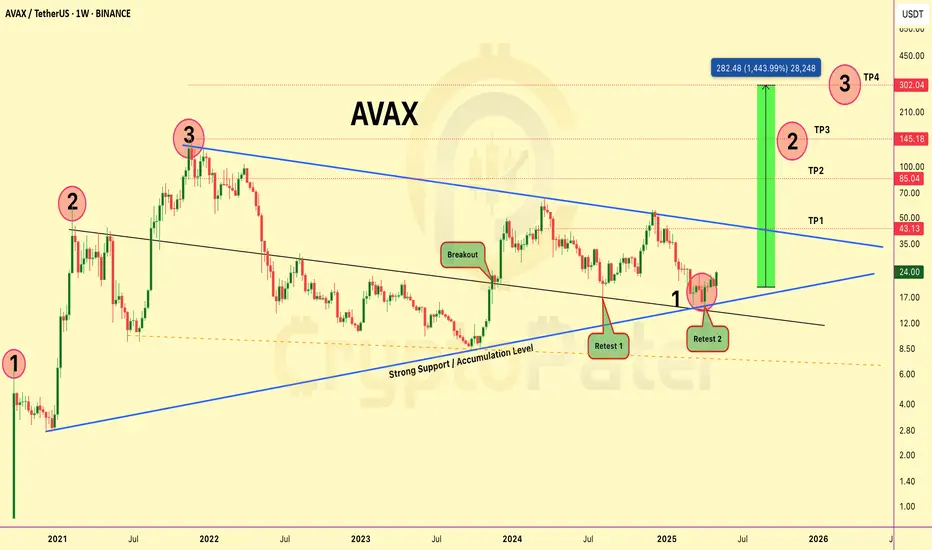
$AVAX Weekly Chart Update – Massive Breakout Brewing!🚨 CRYPTOCAP:AVAX Weekly Chart Update – Massive Breakout Brewing!
#AVAX is showing a textbook falling wedge breakout on the weekly timeframe, and the setup looks 🔥 for a potential 10x+ move!
Here’s what’s happening:
✅ Structure: Multi-year falling wedge since 2021
✅ Breakout: Confirmed in late 2023
✅ Retests: ✅ Retest 1 & ✅ Retest 2 both held perfectly
✅ Support Zone: Strong accumulation by big players
✅ Accumulation Zone: $24-$20 — still in early entry zone!
🔰 Targets: $43/$85/$145/$302+ (Cycle extension target)
▪️ Measured move suggests +1400% upside potential
▪️ This is one of those charts you don’t want to ignore. Accumulation is likely done. Smart money already positioned. Now it’s about patience and trend continuation.
Chart looks ready. Momentum building. Are you riding this AVAX train? 🚀
Range Ending? MWC Correction Might Be Running Out of SteamBINANCE:AVAXUSDT 4H Timeframe Analysis 🔍
🧠 Cycle Breakdown:
• HWC (High Wave Cycle / Higher Timeframe Cycle): Ranging 🔁
• MWC (Medium Wave Cycle / Mid-Timeframe Cycle): Bullish 🔼
• LWC (Low Wave Cycle / Lower Timeframe Cycle): Bearish 🔽
Right now, the HWC has little to no influence, so we focus on the current correction phase of the MWC. That puts us in favor of long positions, as we expect this correction to eventually resolve to the upside.
🔎 Price Structure & Strategy:
Look closely — candles have formed a 15-minute range box. That means a breakout from this box won’t give us a massive move immediately, but it can still offer a decent entry depending on direction.
Since I use a breakout-based strategy, I’ve marked out my key support and resistance levels:
20.20 is a good level to look for long setups.
19.31 is where I’d consider a short, but keep in mind: going short here is against the MWC, so you’ll need tighter risk control.
🎯 Take-Profit (TP) & Reaction Zones:
If price breaks upward:
21.40 is a solid level to partial TP or manage risk.
23.00 is a stronger resistance and has a higher chance of reaction.
⚠️ Important: If price breaks out of the 15-min range box, it’ll count as a valid breakout — but again, expect smaller initial momentum.
Personally, I’ll take partial profits at 21.40, or even fully close the trade, because price might reverse before hitting 23. If not closing, I’ll at least move to breakeven.
📊 Volume Observation:
During the last drop, volume decreased — that’s a typical sign of a correction phase within the MWC, and it aligns with our long bias.
If you'd like me to analyze a specific coin, feel free to drop it in the comments
Without proper risk management, you're just a ticking time bomb ⚠️
— PXA 📊

AVAX Trade Setup – Support Zone Long OpportunityAvalanche (AVAX) has pulled back and is now approaching a key support area, offering a high-reward swing setup if bulls defend the level.
🔹 Entry Zone:
$20.00 – $21.00 (Support Zone)
🎯 Take Profit Targets:
🥇 $22.50 – $24.00
🥈 $27.00 – $29.00
🛑 Stop Loss:
Just below $18.50

AVAX Trade Setup – Waiting for Pullback EntryThe total crypto market has hit a key resistance zone, and many altcoins, including AVAX, are showing signs of exhaustion after recent rallies. AVAX surged from $14.00 to $23.00, and a pullback to support could offer a prime long entry.
📍 Entry Zone:
$20.00 – $21.00 (Area of support)
🎯 Take Profit Targets:
🥇 $22.50 – $24.00
🥈 $27.00 – $29.00
🛑 Stop Loss:
Just below $18.50

AVAX: 2x Potential Multibagger Alts Crypto Coin1. The price structure of the altcoin is looking promising.
2. W-bottom formation can be seen.


Are You Ready for a Major AVAXUSDT Move?Yello Paradisers! 👋 AVAXUSDT is at a critical juncture, and it’s essential to stay focused.
💎Currently, the AVAXUSDT is trading within a descending channel, but we’re seeing the potential formation of a bullish W pattern. This is where things get interesting.
💎If AVAX breaks out and closes a candle above the resistance zone, it will validate the W pattern, significantly increasing the chances of a bullish move. 🚀
💎On the other hand, if we see a pullback, the support zone could give us a double-bottom pattern. But we’ll need confirmation from a Change of Character (CHoCH) toward a bullish market structure to give us confidence in the reversal.
💎However, if the price breaks down and closes a candle below the support zone, our entire bullish scenario will be invalidated.
🎖The key here, Paradisers, is patience and discipline. Remember, only the best, highest-probability trades are worth taking. Stay sharp, follow the price action, and make sure your strategy is in place. That’s how you stay in the winner’s circle.
MyCryptoParadise
iFeel the success🌴

AVAX strong bullish sentimentAVAX moved from 21.00 to around 31.00, a 50% increase. Wedge pattern played out perfectly, and the money flow didnt disappoint.
After the recent drawdown, we found a support. Currently it's forming an ascending channel.

Avax longAvalanche is a decentralized, open-source proof of stake blockchain with smart contract functionality. AVAX is the native cryptocurrency of the platform

AVAX H4 long for sellofffAVAX H4 long for selloff, follow your rule. management your position, time is answer.

Let me know what you thinkTry to make easy to read charts for a big overview what should serv for the next moves

AVAXUSDT: Bullish Breakout or False Hope?Yello, Paradisers! 🌟 Are we about to witness a bullish breakout for AVAXUSDT? Let's dive in and find out!
💎AVAXUSDT has taken liquidity and formed a W pattern, breaking the descending channel. These factors are increasing the probability of a bullish move. However, for confirmation, we need a breakout and candle closing above the resistance zone, which will signal a strong bullish move.
💎While some might consider going long from here from the current price, But it's a low-probability setup. Therefore, it's better to ignore it for now. The overall crypto market has also shown bullish tendencies, but a pullback is expected. So, it's wiser to wait for better opportunities.
💎On the flip side, if there's a breakdown and the candle closes below the bullish order block, it will invalidate our bullish outlook.
🎖Remember, patience and discipline are key in this volatile market. Stay focused and wait for high-probability setups. This is how you make it far in your crypto trading journey. Be a PRO💰
MyCryptoParadise
iFeel the success🌴

#AVAX Ready to Skyrocket: Massive Gains Ahead!Hi everyone! Today, I'd like to highlight another top altcoin: AVAX. It has found strong support at the anchored VWAP and is currently retesting a previous high area. Recently, $AVALANCHE surged to retest the previous support level from 2021, around the $65 zone, which acted as resistance. Now, it's finding support from previous highs.
The VWAP is a highly regarded indicator, often used by institutional investors. Given this, it might be an excellent time to buy AVAX, as it appears ready to soar from its current range of $20 to $22. If it retests its all-time high of $148, we could potentially see returns of up to 500% from this point.

Will AVAX Price Test $100 In 2024?Avalanche protocol has a market cap of $14.1 Billion and is ranked 12th in the CMC. The volume of the AVAX has observed a surge of over 66% in the past 24 hours. It has a total supply of 442,544,533 in which 54.9% is circulating in the market. AVAX is currently trading near the value of $36 with a gain of 1.74% in the intraday session.
AVAX price is currently forming small consolidating candles on the daily chart. It is trading below the 50 and 100 EMA. The upside trend of AVAX can see a halt near the value of $40. Meanwhile the support of the asset price can be observed near $30.
The RSI of AVAX is near 47 with no slope in it suggesting its presence in the neutral zone. The overall momentum of the RSI is consolidating in nature.

AVAX TRADE ANALYSIS AVALANCHE (AVAX) is trading just above the trendline of the symmetrical descending triangle. A successful breakout above 39.02 could lead to a significant upward movement targeting above 54. Conversely a breakdown below 29.65 could result in further downfall.
