ICICIBANK - Inverted Head & Shoulder suggests 1450ICICI Bank has completed a clean Inverted Head and Shoulders pattern on the 4H chart, signalling a possible trend reversal after the recent downtrend. The left shoulder formed near 1360 , the head at 1317 , and the right shoulder at 1354 . All three points reflect stronger structure and consistent buying interest on dips. The stock has now crossed the neckline around 1387–1390 , a zone where it faced repeated rejection earlier. This breakout shows that buyers have finally taken control.
If the price continues to hold above the neckline, momentum is likely to push it toward the projected target of 1440–1450 , which matches the “final destination” zone shown on your chart. The breakout would lose strength only if the price falls back below 1387 , but unless that happens, the pattern suggests the move still has room to extend higher.
Trade ideas

ICICI Bank — 200-DMA Rejection Keeps the Downtrend IntactMarket Context
ICICI Bank continues to trade inside a broad descending channel that has governed price since the 1500 peak. Every counter-trend rally has been corrective so far, and the recent recovery has shown the same character — overlapping candles, choppy subdivisions, and clear respect for channel resistance.
Key Technical Drivers
1. Rejection at the 200-DMA
The rally stalled exactly at the 200-Day Moving Average. This is the same zone where price lost momentum earlier, reinforcing that the long-term bias remains downward. A failed attempt to reclaim the 200-DMA in a corrective environment typically signals trend continuation rather than reversal.
2. Channel Resistance Still Untouched
Even though momentum carried the stock above short-term levels, the broader upper channel boundary continues to act as the main ceiling. Price behaviour near this level is corrective, not impulsive — another sign that the move is still part of a larger complex structure.
3. Structure Supports a Triple Zigzag (W-X-Y-X-Z)
This entire decline is best interpreted as a higher-degree W-X-Y-X-Z correction.
W bottomed at 1342.60
X rallied to 1445
Y bottomed at 1317.40
The ongoing rally fits well as the second X wave
Wave (c) of this X leg may be close to completion, but the subwaves allow room for a marginal push to retest the channel top before turning lower. Nothing in the current leg looks impulsive enough to suggest a larger trend reversal.
Trading Plan
Direction: Expect the next leg to unfold downward as Wave Z begins.
Target Zone: Break below 1317.40 is likely, with measured support near 1280–1300 at the lower boundary.
Invalidation: A sustained break above 1411.90 invalidates the bearish Z-wave view and opens the door for a trend reassessment.
Conclusion
The failed 200-DMA retest, corrective price structure, and channel resistance all point to the current recovery nearing exhaustion. Whether Wave X makes one more marginal high or not, the broader path remains lower toward the Wave Z terminal zone.
Disclaimer: This analysis is for educational purposes only and does not constitute investment advice. Please conduct your own research before taking any trading decisions.

Steps Involved in Executing a Trade1. Identifying the Trading Opportunity
The trade execution process begins long before clicking the buy or sell button. The first step is identifying a valid opportunity. Traders use various methods based on their style—technical analysis, fundamental analysis, or a combination of both.
Technical traders look for chart patterns, indicators, trends, support/resistance zones, or momentum signals.
Fundamental traders analyze earnings, macroeconomic news, sector trends, and company performance.
Algorithmic systems scan markets automatically based on coded rules.
A good opportunity must meet specific criteria defined in the trader’s strategy. This ensures you follow a systematic approach rather than making impulsive decisions.
2. Conducting Market Analysis and Confirmation
Once an opportunity is spotted, the next step is to confirm the trade. This involves deeper analysis to avoid false signals or emotional trades.
Technical Confirmation
Checking multiple timeframes
Validating trends
Reading candlestick patterns
Confirming indicator signals (RSI, MACD, moving averages)
Fundamental Confirmation
Monitoring economic releases
Checking for earnings announcements
Evaluating sector strength
Understanding market sentiment
Without confirmation, traders risk entering low-quality trades.
3. Determining Entry and Exit Levels
Before placing the trade, traders clearly define:
Entry Point
The exact price level where the trade should be opened. Professional traders do not “guess” entry—they plan it.
Stop-Loss Level
This is the maximum acceptable loss. Setting a stop-loss:
Protects capital
Removes emotional decision-making
Prevents large unexpected losses
Target or Take-Profit Level
A predetermined price at which the trader will exit with profit. Having targets:
Encourages disciplined exits
Helps calculate risk-reward ratio
Avoids holding too long
For example:
If you risk ₹10 to make ₹30, your risk-reward is 1:3—an excellent setup.
4. Calculating Position Size
This step separates professionals from amateurs. Position sizing ensures the trader does not over-expose their capital.
Factors considered:
Account size
Maximum risk per trade (usually 1%–2%)
Stop-loss distance
Volatility of the asset
Proper position sizing ensures survival in the long run. A trader who risks a small percentage of capital per trade can withstand market fluctuations without blowing up the account.
5. Choosing the Right Order Type
Execution depends heavily on the order type used. Different orders serve different purposes:
Market Order
Executes immediately at the current market price. Ideal for:
Fast-moving markets
When speed matters more than exact price
Limit Order
Executes only at a specific price or better. Best for:
Precise entries
Avoiding slippage
Stop-Loss Order
Automatically exits the trade at a set price to limit losses.
Stop-Limit Order
Combines stop and limit conditions. Useful when traders want price control with conditional execution.
Understanding order types helps avoid mistakes like entering at a wrong price or missing an important exit.
6. Executing the Trade
At this stage, the order is sent to the broker or exchange for execution. Key points include:
Ensuring no network delay or order mismatch
Double-checking quantity and price
Watching for slippage in volatile markets
Using fast execution for intraday or scalping traders
For algorithmic traders, execution is automated, but still depends on server speed, order routing, and liquidity.
7. Monitoring the Trade After Execution
Once the trade is live, monitoring becomes essential. Traders watch:
Price action
Volume changes
Market reactions to news
Key support or resistance levels
Active monitoring ensures quick decision-making if the market moves unexpectedly. Many traders adjust their stop-loss to breakeven once the trade moves in their favor—a technique called trailing stop.
8. Managing the Trade
Trade management determines long-term profitability more than entries. It includes:
Adjusting Stop-Loss
As the trade becomes profitable, the stop-loss can be moved closer to lock in gains.
Scaling In
Adding more quantity when the trend strengthens.
Scaling Out
Reducing exposure gradually by taking partial profits.
Exiting Early
If conditions change or the setup becomes invalid, exiting early protects capital.
Managing a trade requires discipline, flexibility, and understanding market behavior.
9. Closing the Trade
The trade is eventually closed at:
Stop-loss
Take-profit
Manual exit
Time-based exit
Closing a trade is not the end—it triggers reflection and learning. A calm and systematic exit reduces regret and emotional pressure.
10. Recording the Trade in a Journal
Successful traders record every trade. A trading journal includes:
Entry and exit price
Stop-loss and target
Reason for trade
Outcome
Emotions during the trade
A properly maintained journal reveals patterns of strengths and weaknesses.
For example:
You may discover you overtrade during volatile news
You may find certain setups work better than others
You may see that trades without stop-loss usually fail
Journaling helps refine strategies and improve decision-making.
11. Reviewing Performance and Optimizing Strategy
After recording the trade, traders review and analyze their performance weekly or monthly. This step focuses on:
Accuracy rate
Risk-reward ratio
Win/loss consistency
Emotional discipline
Strategy adjustments
Continuous improvement is the backbone of long-term trading success. Markets evolve, and traders must adapt to changing conditions.
Conclusion
Executing a trade is not simply buying or selling an asset; it is a disciplined process involving research, planning, risk management, execution, monitoring, and review. Each step—from identifying an opportunity to journaling the result—contributes to consistent profitability. Traders who follow this structured approach remove emotions from trading, make better decisions, and build a strong foundation for long-term success in the financial markets.
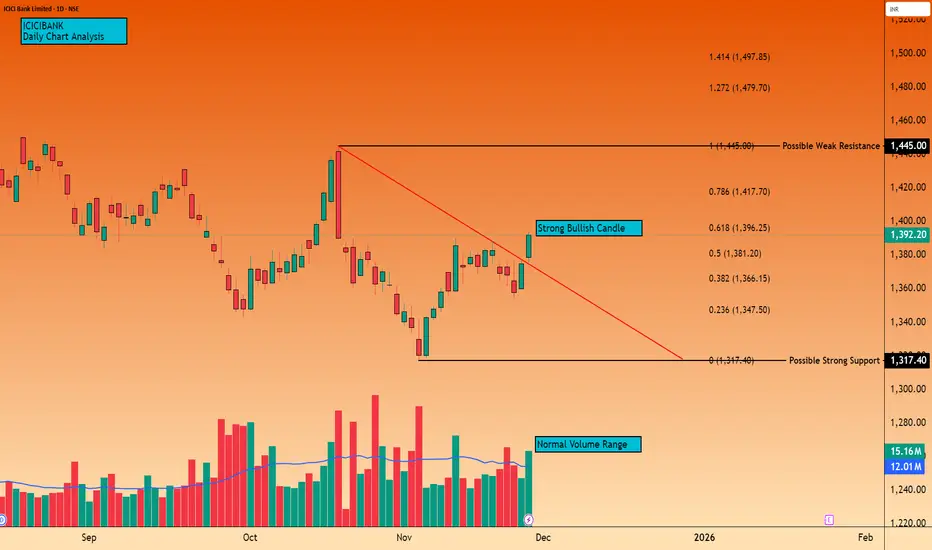
ICICIBANK - Fibonacci Reversal + Trendline Breakout Attempt💹 ICICI Bank Ltd (NSE: ICICIBANK)
Sector: Banking & Financial Services | CMP: 1392.20 | View: Fibonacci Reversal + Trendline Breakout Attempt
Chart Pattern: Descending Trendline Breakout
Candlestick Pattern: Strong Bullish Momentum Candle
Swing High: 1445
Swing Low: 1317.40
STWP Trade Analysis:
Bullish Breakout Level: 1394
Stop Loss: 1353
Momentum: Strong
Volume: High participation buildup
The price has bounced sharply from the 0.382–0.5 Fibonacci retracement pocket, breaking above the descending trendline with a strong bullish candle. Volume expansion confirms active buying interest, signalling institutional accumulation from lower levels. The shift from contraction (falling structure) to expansion (breakout candle) indicates buyers reclaiming dominance and defending higher lows consistently.
Resistances:
1398.9 | 1405.6 | 1417.2
Supports:
1380.6 | 1369 | 1362.3
STWP Stock Analysis:
Final Outlook:
Momentum: Strong | Trend: Bullish Bias Developing | Risk: Moderate | Volume: High
ICICI Bank has rebounded strongly from the Fibonacci retracement structure, reclaiming key levels and breaking above the trendline that previously controlled price action. This confirms the transition from corrective movement into a fresh upward attempt. Volume strength shows that this move is not a random spike but a coordinated push from stronger hands.
RSI has turned upward from the balanced zone, CCI is strengthening above the positive threshold, and MACD is close to a momentum confirmation crossover — all indicating internal strength building behind the price. EMA compression across the last several sessions is easing, suggesting the early stage of a directional move.
The series of controlled declines over the past month resemble VCP-like contractions, followed by today’s momentum expansion candle. Sustaining above the 1381–1366 zone keeps the bullish structure intact and opens the path toward the resistance band at 1398 → 1405 → 1417, with 1445 acting as the extended resistance if momentum continues.
Overall, ICICI Bank stands at the onset of a potential continuation leg, backed by strong volume, clean Fibonacci structure, and a clear breakout from its corrective trendline. Holding the demand zones below will strengthen follow-through possibilities and create additional opportunities for traders on dips.
Traders should watch how the stock behaves on minor dips or pullbacks toward the 1381–1366 demand band. Healthy retests within this zone often provide strong secondary entries in momentum setups.
This document is strictly for educational and informational purposes. This analysis is purely observational and does not qualify as investment research under SEBI regulations. All examples, charts, levels, and structures discussed are illustrative and are not intended as buy, sell, or hold recommendations. STWP does not provide investment advice, trading tips, signals, or personalized financial guidance of any kind, nor is it a SEBI-registered intermediary or research analyst. The analyses and risk–reward structures included here are generic in nature and based on publicly available information, which may change without notice. Financial markets involve significant risk; derivatives in particular carry the potential for substantial losses. Readers are solely responsible for their trading decisions, capital management, and risk assessment.
Always consult a SEBI-registered investment advisor before making any financial decisions. STWP and its team shall not be liable for any direct or indirect losses arising from the use of this material. Historical patterns never guarantee future outcomes.
Position Status: No active position in ICICIBANK at the time of analysis.
Data Source: TradingView & NSE India.
💬 Found this useful?
🔼 Boost this post to support structured learning
✍️ Share your thoughts or questions in the comments
🔁 Forward this to traders who value clean technical studies
👉 Follow for disciplined, structured, STWP-style analysis
🚀 Stay Calm. Stay Clean. Trade With Patience.
Trade Smart | Learn Zones | Be Self-Reliant 📊
Part 8 Trading Master Class With ExpertsStrike Price
The strike price is the pre-decided level at which a call or put buyer can buy or sell the asset.
Example: If Nifty is trading at 22,000, you may choose from strikes like 21900, 22000, 22100, etc.
Expiry
Every option has a validity period. After that, it expires.
In India:
Index options (Nifty, Bank Nifty) have weekly expiries.
Stock options have monthly expiries.

Best Trading Strategies Used by Traders in Financial Markets1. Trend Following Strategy
The trend following strategy is based on the principle that prices tend to move in sustained trends rather than randomly. Traders using this approach attempt to enter trades in the direction of the prevailing trend and ride the movement until signs of reversal appear.
Key tools: Moving averages (SMA, EMA), trendlines, MACD, ADX.
How it works: Traders identify a strong uptrend or downtrend. For example, in an uptrend, they look for price pullbacks to enter long positions. Conversely, in a downtrend, they short sell during price rallies.
Advantages: Works well in trending markets and allows traders to capture significant portions of price moves.
Challenges: Can produce false signals in sideways or choppy markets. Patience is required to let trends develop.
2. Swing Trading
Swing trading focuses on capturing medium-term price movements, typically lasting from a few days to several weeks. Swing traders aim to profit from price “swings” within a broader trend, combining technical analysis with market sentiment insights.
Key tools: Candlestick patterns, support and resistance levels, RSI, Fibonacci retracement.
How it works: Traders identify potential reversals at key support or resistance zones and enter trades aligned with the expected swing. For example, after a stock bounces from a support level, a swing trader may go long anticipating a short-term upward movement.
Advantages: Less time-intensive than intraday trading; allows participation in significant market moves.
Challenges: Overnight risk and exposure to market gaps can affect positions; requires solid risk management.
3. Intraday or Day Trading
Day trading involves buying and selling financial instruments within the same trading day. The goal is to profit from short-term price fluctuations while avoiding overnight market risk.
Key tools: Real-time charts, volume analysis, VWAP, Bollinger Bands, Level II quotes.
How it works: Traders identify high-probability trades based on intraday trends, price patterns, or news. Trades are opened and closed within hours or minutes.
Advantages: Immediate results and no overnight risk. Allows traders to capitalize on volatility.
Challenges: Requires constant monitoring, discipline, and quick decision-making. Transaction costs and emotional stress can be high.
4. Scalping Strategy
Scalping is an ultra-short-term trading strategy aimed at taking advantage of small price movements multiple times during the day. Scalpers execute dozens or even hundreds of trades in a single session.
Key tools: Tick charts, Level II data, order flow analysis.
How it works: Traders enter positions for just a few seconds or minutes to capture minor price changes. High leverage is often used to amplify small gains.
Advantages: Small, frequent profits can accumulate quickly; less exposure to market risk due to short holding periods.
Challenges: Demands extreme focus, rapid execution, and low-latency platforms. High transaction costs can reduce profitability.
5. Breakout Strategy
Breakout trading seeks to capitalize on price movements when an asset breaks through a key support, resistance, or consolidation range. Breakouts often indicate strong momentum and potential trend continuation.
Key tools: Horizontal support/resistance levels, Bollinger Bands, volume indicators.
How it works: Traders monitor consolidation zones and place trades when the price breaks above resistance (long) or below support (short). Volume confirmation is crucial to avoid false breakouts.
Advantages: Can generate large profits if momentum continues; simple to implement with clear entry and exit rules.
Challenges: False breakouts can lead to losses; requires careful position sizing and stop-loss placement.
6. Momentum Trading
Momentum traders exploit stocks or assets showing strong directional movement. This strategy assumes that assets with recent strong performance will continue moving in the same direction in the short term.
Key tools: RSI, MACD, moving averages, relative volume.
How it works: Traders identify securities with increasing volume and price momentum, entering trades in the direction of the trend. Exit decisions are based on signs of weakening momentum or overbought/oversold conditions.
Advantages: Profits from strong trends and market sentiment; suitable for volatile markets.
Challenges: Momentum can reverse suddenly; risk management is crucial to protect profits.
7. Mean Reversion Strategy
Mean reversion is based on the idea that prices tend to revert to their historical average over time. Traders using this approach buy undervalued assets and sell overvalued ones relative to their average price.
Key tools: Bollinger Bands, moving averages, RSI.
How it works: When the price deviates significantly from its average, traders enter positions expecting a reversal. For example, if a stock price falls far below its 50-day moving average, it may rebound, presenting a buy opportunity.
Advantages: Effective in range-bound or sideways markets; helps exploit temporary mispricings.
Challenges: Market trends can override mean-reversion signals, causing losses.
8. Position Trading
Position trading is a long-term strategy where traders hold positions for weeks, months, or even years, based on fundamental or technical trends. Unlike swing or intraday trading, position trading is less concerned with short-term fluctuations.
Key tools: Fundamental analysis, macroeconomic indicators, trendlines, moving averages.
How it works: Traders analyze long-term trends, company fundamentals, or macroeconomic data to enter positions with an extended holding period. Stop-losses and risk management are essential to mitigate adverse moves.
Advantages: Less time-intensive; profits from long-term trends.
Challenges: Requires patience and capital; susceptible to market shocks.
9. Algorithmic or Automated Trading
Algorithmic trading uses computer programs to execute trades based on predefined rules and quantitative models. It can include high-frequency trading, arbitrage, and trend-following algorithms.
Key tools: Quantitative models, APIs, machine learning, historical data analysis.
How it works: Algorithms analyze market data in real-time and execute trades automatically when conditions are met. Parameters such as entry price, stop-loss, and take-profit are predefined.
Advantages: Removes emotional bias, ensures fast execution, and can process vast data.
Challenges: High technical expertise required; system failures or market anomalies can result in losses.
10. Risk Management Across Strategies
Regardless of the strategy, risk management is critical. Techniques include:
Stop-loss orders: Automatically exit trades to limit losses.
Position sizing: Adjust trade size based on account size and risk tolerance.
Diversification: Spread risk across assets, sectors, or instruments.
Risk-reward ratio: Target trades where potential profit outweighs potential loss, ideally 2:1 or higher.
Psychological discipline: Avoid overtrading, emotional decision-making, or chasing losses.
Conclusion
There is no single “best” trading strategy suitable for everyone. Success in trading depends on matching a strategy with your personality, time availability, market knowledge, and risk tolerance. Trend-following, swing trading, and breakout strategies suit those who can analyze charts and trends, while day trading and scalping require high focus and rapid decision-making. Momentum and mean-reversion strategies cater to traders exploiting specific market behaviors, whereas position trading and algorithmic trading appeal to those focused on long-term trends or systematic execution.
Ultimately, combining a robust trading strategy with disciplined risk management, continuous learning, and psychological control creates the foundation for sustainable trading success. Traders who adapt their approach to changing market conditions and remain consistent in execution tend to outperform those chasing quick wins without a structured plan.
Part 12 Trading Master ClassKey Tips for Beginners
1. Start with Defined-Risk Strategies
Vertical spreads (bull call, bear put)
Covered calls
Iron condors
These limit losses and prevent account blow-ups.
2. Avoid Selling Naked Options
Beginners should fully avoid selling naked calls/puts because:
Risk can be unlimited
Sharp market movements can cause huge losses
3. Understand Option Greeks
You don’t need to master all, but focus on:
Delta → Direction strength
Theta → Time decay
Vega → Impact of volatility
4. Use Proper Position Sizing
Never use more than:
2–5% of capital on a single trade
10% total exposure to naked buying (calls/puts)
5. Back-test and Paper Trade
Before risking real money:
Test strategies on historical charts
Use virtual trading platforms
Study how premiums behave near expiry
6. Trade with Market Structure + Volume Profile
Since you’re already learning volume profile, combine it with options:
Identify liquidity zones
Sell options at premium zones
Buy options near support/resistance breaks

Part 1 Ride The Big Moves Types of Option Trading Strategies
a. Bullish Strategies
Long Call – Buy CE
Bull Call Spread – Buy CE and Sell higher CE
Cash Secured Put – Sell PE with intention to buy shares
b. Bearish Strategies
Long Put – Buy PE
Bear Put Spread – Buy PE and Sell lower PE
Covered Call – Sell CE while holding shares
c. Neutral Strategies
Straddle – Buy both CE and PE
Strangle – Buy OTM CE and PE
Iron Condor – Sell CE & PE with hedges to capture premium
Butterfly Spread – Low risk, limited profit strategy
Neutral strategies are popular on weekly expiry days when markets stay range-bound.

Part 11 Trading Master Class Why Options Are Popular
Option trading has exploded in popularity due to several advantages:
✔ Lower Capital
You can control a large position with a small premium.
✔ Limited Risk (For Buyers)
You can’t lose more than the premium you paid.
✔ High Reward Potential
Options magnify gains during strong market moves.
✔ Flexibility
You can create strategies for:
bullish markets
bearish markets
range-bound markets
highly volatile markets
extremely calm markets

Mastering Technical Analysis1. What Is Technical Analysis?
Technical analysis is a method of forecasting market movement by studying price charts, trading volume, indicators, and patterns. Unlike fundamental analysis—which focuses on earnings, economic data, and intrinsic value—TA assumes that all information is already reflected in the price.
At its core, technical analysis is built on three key assumptions:
1. Market action discounts everything
Every factor—economic data, news, global events—gets absorbed into price.
2. Prices move in trends
Markets do not move randomly. They follow identifiable patterns: uptrends, downtrends, or sideways ranges.
3. History repeats itself
Human behavior, fear and greed, and market psychology create recurring patterns.
These principles allow traders to anticipate moves with probability, not certainty.
2. Understanding Price Structure
a. Dow Theory Basics
Dow Theory forms the foundation of technical analysis:
Market moves in three trends: primary (major), secondary (pullbacks), and minor (small fluctuations).
Trends stay in effect until clear reversal signals appear.
Volume confirms price movement.
b. Market Trends
A trend is the direction in which prices move.
Uptrend: Higher highs (HH) + higher lows (HL)
Downtrend: Lower highs (LH) + lower lows (LL)
Sideways/Range: Price oscillates between support and resistance.
Identifying trends early is one of the biggest advantages for traders.
3. Key Elements of Technical Analysis
a. Support and Resistance
Support is a price level where buying interest dominates. Resistance is where selling pressure appears.
These levels help traders:
Time entries
Set targets
Place stop losses
Breakouts and breakdowns from these levels often indicate major moves.
b. Trendlines and Channels
Trendlines connect the lows in an uptrend and highs in a downtrend. When combined with parallel lines, they form channels, showing strong directional movement.
A break of a trendline often signals trend reversal.
c. Chart Patterns
Patterns form when price movements create recognizable shapes on charts.
Reversal Patterns:
Head and Shoulders
Inverse Head and Shoulders
Double Top / Double Bottom
Triple Tops / Bottoms
Continuation Patterns:
Flags
Pennants
Triangles
Rectangles
Chart patterns reflect collective market psychology and help forecast future direction.
4. Candlestick Patterns
Candlestick charts reveal the emotional story of buyers and sellers. Some common patterns include:
Bullish Patterns:
Hammer
Bullish Engulfing
Morning Star
Piercing Line
Bearish Patterns:
Shooting Star
Bearish Engulfing
Evening Star
Dark Cloud Cover
Combining candlestick signals with support/resistance improves accuracy.
5. Technical Indicators and Oscillators
Indicators help interpret market momentum, strength, and volatility. Although no indicator is perfect, combining a few well-selected ones enhances decision-making.
a. Moving Averages
They smooth out price movement to reveal trends.
Types:
SMA (Simple Moving Average)
EMA (Exponential Moving Average)
Common strategies:
Golden Cross (50-MA above 200-MA)
Death Cross (50-MA below 200-MA)
EMA-based trend trading
b. RSI (Relative Strength Index)
RSI measures momentum and identifies overbought (>70) and oversold (<30) conditions. It also signals divergences, which often precede reversals.
c. MACD (Moving Average Convergence Divergence)
MACD shows the relationship between two EMAs. Signals include:
Bullish or bearish crossovers
Histogram direction
Divergences
d. Bollinger Bands
These measure volatility. Price touching the upper band suggests overbought conditions; touching the lower band suggests oversold conditions. Squeezes indicate big upcoming moves.
e. Volume Indicators
Volume is essential for confirming trends.
Rising price + rising volume = strong trend
Rising price + low volume = weak trend
6. Multi-Time Frame (MTF) Analysis
Professional traders analyze charts across multiple time frames. For example:
Higher time frames (1D, 1W) show the major trend.
Lower time frames (1H, 15m) show entry opportunities.
A trade is strongest when trends align on multiple time scales.
7. Breakout and Breakdown Trading
Breakouts occur when price moves above resistance with strong volume. Breakdowns occur when price falls below support.
Successful breakout trading requires:
Volume confirmation
Retest of breakout zones
Avoiding false breakouts
8. Risk Management and Position Sizing
Mastering technical analysis is not just about reading charts. The biggest key is managing risk.
Essential rules:
Always use a stop loss
Do not risk more than 1–2% of capital per trade
Use risk-reward ratios (e.g., 1:2 or 1:3)
Trade with discipline, not emotion
Good risk management keeps you in the game long enough to experience compounding success.
9. Trading Psychology
Technical analysis is 30% charts and 70% psychology. Recognize these emotional traps:
Fear of missing out (FOMO)
Overconfidence after profit
Revenge trading after loss
Impatience and overtrading
A disciplined trader follows rules and trusts their strategy.
10. Creating Your Own Trading System
To master technical analysis, create a structured trading system:
Components of a strong system:
Market selection (stocks, indices, crypto)
Time frame (intraday, swing, positional)
Indicators (2–3 maximum)
Entry rules (breakout, pullback, pattern)
Exit rules (target, trailing stop)
Risk-reward ratios
Backtesting to validate performance
A system removes emotional decision-making and boosts consistency.
11. Combining Technical and Fundamental Analysis
While TA is powerful, combining it with fundamental catalysts—earnings, macro trends, sector strength—creates high-probability setups. For example:
Volume breakout + strong quarterly results
Trend continuation + positive economic news
This hybrid approach is used by many successful traders.
12. The Path to Mastery
Technical analysis mastery does not come overnight. It requires:
Chart practice
Backtesting historical data
Studying past cycles
Recording trades in a journal
Reviewing mistakes and refining rules
Over time, patterns become clear, and intuition develops.
Conclusion
Mastering technical analysis is a journey of learning price behavior, practicing chart reading, and developing psychological discipline. By understanding trends, patterns, indicators, and risk management, traders gain the ability to anticipate market moves with greater confidence. TA does not guarantee profits—it improves probabilities. Combined with discipline, patience, and a structured approach, it becomes a powerful skill that can transform your trading performance.

Premium Chart Patterns Introduction: Chart patterns are visual formations on price charts that help traders understand market behaviour. They show how buyers and sellers are interacting and where the price might move next. These patterns repeat over time, so traders use them to predict breakouts, trend reversals, and continuation of trends.
Chart patterns are mainly divided into Reversal Patterns, Continuation Patterns, and Bilateral Patterns.
1. Reversal Chart Patterns
Reversal patterns indicate that the current trend is about to change direction. If the market is going up, a reversal pattern may signal a fall. If the market is falling, it may warn of an upcoming rise.
2. Continuation Chart Patterns
These patterns show that the ongoing trend will continue after a short pause or consolidation.
3. Bilateral Chart Patterns
These patterns indicate a possible breakout in either direction.

Part 1 Intraday Trading Master ClassKey Terms in Option Trading
a) Premium
The cost paid by the buyer to purchase an option contract.
This is the maximum loss for the buyer and the maximum gain for the seller.
b) Strike Price
The fixed price at which a call buyer can buy or a put buyer can sell.
c) Expiry
The date when the option contract expires.
In India:
Indices: Weekly + Monthly expiry
Stocks: Monthly expiry only
d) Lot Size
Options are traded in lots, not single units.
Example: Nifty lot = 50 units.
e) In-the-Money (ITM), At-the-Money (ATM), Out-of-the-Money (OTM)
ITM Call: Spot > Strike
ATM: Spot = Strike
OTM Call: Spot < Strike
Vice-versa for puts.

ICICI BANKLast time ICICI took rejection from 0.618 zone, will it again reject the area which comes around 1400

Who Controls the Trade Market?1. Governments and National Policies
Governments are among the most significant influencers of global trade. They do not directly “control” the entire trade market but shape it through:
a. Trade Policies
Countries impose:
Tariffs
Import/export taxes
Quotas
Subsidies
Sanctions
These tools can encourage or restrict trade. For example, a country may impose tariffs on imported steel to protect its local steel industry, affecting global steel prices and trade flows.
b. Trade Agreements
Nations sign bilateral and multilateral agreements such as:
WTO Agreements
Regional trade blocs (EU, ASEAN, NAFTA/USMCA, MERCOSUR)
Free trade agreements (India–UAE CEPA, EU–Japan EPA)
Such agreements define tariff structures, market access, rules of origin, and dispute mechanisms. They create predictable trade environments that shape global flows.
c. Currency and Monetary Policy
Governments influence their currency through central banks, affecting:
Export competitiveness
Import costs
Balance of payments
For example, a weaker currency makes a country’s exports cheaper globally, increasing trade activity.
2. Central Banks and Interest Rate Policies
Central banks indirectly influence the trade market by controlling:
Interest rates
Foreign exchange reserves
Money supply
Inflation
These factors alter import/export demand, capital flows, and trade financing costs. The U.S. Federal Reserve, ECB, Bank of Japan, and People's Bank of China have an outsized influence because their currencies drive global trade settlements.
3. The World Trade Organization (WTO)
The WTO does not “control” trade but regulates and oversees the global trading system. It:
Sets rules for fair trade
Resolves trade disputes
Ensures nondiscriminatory trade practices
Manages global tariff schedules
When trade conflicts arise—such as U.S.–China tariff disputes—WTO rulings influence the direction of global commerce.
4. Global Corporations and Multinational Companies
Large corporations have enormous power over global trade because they operate massive supply chains that span continents. This includes:
Tech giants like Apple, Samsung, and TSMC
Automotive leaders like Toyota, Volkswagen, and Tesla
Energy majors like ExxonMobil, Saudi Aramco, BP
Retail giants like Amazon, Walmart
These companies determine:
Where factories are located
What resources are needed
How goods move across borders
Because of their sheer scale, multinational companies influence labor markets, commodity demand, transportation networks, and global logistics.
5. Commodity Exchanges and Financial Markets
International exchanges play a key role in price discovery. Examples include:
Chicago Mercantile Exchange (CME) – agriculture, energy, metals
London Metal Exchange (LME) – base metals
New York Stock Exchange (NYSE) – equities
ICE – energy, sugar, cotton
These exchanges:
Set global benchmark prices
Facilitate futures and options trading
Provide hedging tools for buyers and sellers
Thus, financial traders and institutions heavily influence short-term market movements, especially in oil, gold, crops, and currencies.
6. Banks and Financial Institutions
Trade requires financing. Large banks such as:
JPMorgan
HSBC
Citi
Deutsche Bank
Standard Chartered
provide:
Letters of credit
Trade loans
Forex settlement
Risk management tools
Without these institutions, global trade would slow dramatically, especially for developing economies.
7. Geopolitical Powers and Global Politics
Political decisions deeply affect trade. The world’s major power centers—the U.S., China, EU, India, Japan, Russia—shape trade through:
Economic alliances
Trade warfare (tariffs, sanctions)
Military presence near trade routes
Resource control
Investment in foreign infrastructure
Geopolitical tensions such as the Russia–Ukraine war, South China Sea disputes, or Middle Eastern conflicts often disrupt supply chains, shipping lanes, and commodity prices.
8. Cartels and Organized Commodity Groups
Some commodities are influenced by producer groups or cartels. The most powerful example is:
OPEC
The Organization of the Petroleum Exporting Countries coordinates oil production to influence global oil prices.
Although they do not fully control the oil market, their decisions strongly impact:
Crude supply
Energy prices
Inflation globally
Other organized groups exist in diamonds, copper, and certain agricultural sectors, but none are as influential as OPEC.
9. Supply Chain and Logistics Networks
Trade physically moves through:
Shipping companies
Port authorities
Airlines
Freight forwarders
Rail networks
Global shipping giants like Maersk, MSC, and COSCO operate vast fleets and control a significant portion of global container movement. Congestion at a major port can affect trade worldwide.
10. Digital Platforms, E-Commerce, and Technology
In the 21st century, platforms such as Alibaba, Amazon, and Shopify influence global trade patterns by enabling cross-border commerce at scale.
Additionally, digital tools like:
AI forecasting
Blockchain-based trade finance
Real-time logistics tracking
Mobile payments
have increased trade efficiency and reduced barriers.
11. Consumers and Market Demand
Ultimately, consumer behavior controls the direction of trade. Their preferences shape:
What goods are produced
Where they are sourced
How companies market products
For example:
Rising demand for electric vehicles increases global trade in lithium, cobalt, and battery components.
Demand for fast fashion drives textile imports and exports.
Consumers collectively act as a “silent controller” of trade.
12. Conclusion — A System, Not a Single Controller
The trade market is not controlled by any one entity. Instead, it operates as a dynamic ecosystem shaped by:
Governments
Corporations
Financial markets
Regulators
Central banks
Geopolitical forces
Supply chain networks
Consumers
Real Knowledge Premium Charts 🔶 What Are Premium Chart Patterns?
Premium chart patterns are advanced price structures that go beyond basic formations like triangles or flags. They reveal institutional activity, market psychology, and volume–price alignment.
These patterns often indicate major breakouts, reversals, or continuation trends — giving traders an edge when combined with volume profile, market structure, and confirmation indicators.

Part 4 Institutional Trading Risks in Option Trading
While options offer leverage and flexibility, they also carry risks:
Time Decay: Option value reduces as expiry nears.
High Volatility: Can cause large swings in option prices.
Unlimited Loss (for sellers): Writers face potentially infinite risk.
Complexity: Requires understanding of multiple factors like Greeks, volatility, and time.

The Modern Market Explosion1. The Digital Revolution in Financial Markets
The first and most powerful factor behind the modern market explosion is digitalization. In the 1980s and 1990s, trading floors were filled with brokers shouting bids and offers. Today, a vast majority of global trades happen electronically within milliseconds. Platforms like NSE, NASDAQ, and NYSE are now driven by high-speed algorithms and smart order systems.
Technology has democratized investing. Mobile apps and online platforms have made it possible for anyone — from a college student to a retiree — to invest in stocks, ETFs, or cryptocurrencies from their smartphones. This has led to a surge in retail participation across the world.
Moreover, the integration of AI and machine learning has redefined data analysis. Traders can now detect patterns, forecast trends, and execute trades with precision that was once unimaginable. AI-driven bots make split-second decisions based on vast data streams, helping investors capture opportunities faster than ever before.
2. Globalization and Market Interconnectivity
Today’s markets are no longer local — they are interconnected ecosystems. What happens in one corner of the world instantly impacts another. A rate hike in the U.S. can move Asian currencies, while a geopolitical conflict in the Middle East can spike global oil prices and influence stock indices in Europe and India.
This interconnectivity means opportunities are global. Investors can diversify portfolios across geographies — U.S. tech stocks, Indian mid-caps, Japanese bonds, and even African startups. But it also means higher volatility. The same interlinkage that offers diversification can also spread panic during crises — as seen in the 2008 financial meltdown or the 2020 pandemic shock.
However, globalization has also enabled foreign capital inflows into emerging economies, fueling growth and innovation. Markets like India, Indonesia, and Brazil have seen massive foreign institutional investments (FIIs) as global investors search for higher returns.
3. The Rise of Retail Investors and the “Crowd Effect”
One of the most striking features of the modern market explosion is the rise of retail participation. The COVID-19 pandemic accelerated this trend as millions turned to trading apps during lockdowns. Platforms like Zerodha, Robinhood, and Groww brought zero-commission trading, social learning, and user-friendly interfaces — empowering individuals to take control of their financial future.
Retail investors have become a powerful market force. Their collective moves can influence stock trends, as seen in the 2021 “GameStop phenomenon,” where a community of small traders challenged big hedge funds. Social media platforms like Reddit, X (Twitter), and YouTube have become virtual trading floors, where ideas spread faster than news headlines.
This new wave has made markets more dynamic but also more sentiment-driven. Tweets, rumors, or viral posts can trigger price movements — making psychology as important as fundamentals.
4. Explosion of Asset Classes and Financial Instruments
Modern markets are not limited to stocks and bonds anymore. Investors today have access to an explosion of financial instruments — from commodities and derivatives to cryptocurrencies, NFTs, and tokenized assets.
Cryptocurrencies like Bitcoin and Ethereum have introduced decentralized finance (DeFi), where financial transactions occur without intermediaries.
Exchange-Traded Funds (ETFs) offer exposure to entire sectors, themes, or countries in a single trade.
Options and futures allow traders to speculate or hedge against price movements with leverage.
Green finance and ESG investments are attracting investors seeking both profit and sustainability.
This diversity has expanded investment choices but also increased complexity. The new challenge for traders is not lack of opportunity, but knowing where to focus.
5. Speed, Data, and the New Trading Psychology
Markets now operate at machine speed. Algorithmic trading, powered by data analytics, accounts for more than half of global trading volume. Every second, millions of transactions take place across exchanges.
But this speed comes with a psychological shift. Traders must adapt to shorter timeframes and rapid information flow. In such a fast-moving environment, fear and greed amplify quickly. A small piece of negative news can trigger instant sell-offs, while hype can drive unsustainable rallies.
In this high-speed world, success depends on discipline, emotional control, and understanding market structure rather than chasing trends. Smart traders analyze volume profiles, liquidity zones, and institutional footprints to navigate volatility effectively.
6. The Role of Central Banks and Liquidity Waves
Modern markets also respond strongly to monetary policy. Central banks like the U.S. Federal Reserve, European Central Bank, and the Reserve Bank of India play a key role in shaping liquidity conditions.
Over the past decade, low-interest rates and quantitative easing (QE) flooded markets with liquidity, driving asset prices to record highs. However, when rates rise, the same liquidity reversal can cause sharp corrections — as seen in 2022.
The explosion in asset prices, from real estate to equities, has been largely fueled by easy money. This has also raised concerns about bubbles, inequality, and systemic risk. Thus, the modern market is as much about liquidity cycles as it is about fundamentals.
7. ESG, Sustainability, and the Future of Capital
Another major dimension of the modern market explosion is the rise of responsible investing. Environmental, Social, and Governance (ESG) factors are now integral to corporate strategy and investor decisions.
Global investors are demanding transparency, green energy initiatives, and ethical governance. Companies that align with sustainability goals attract more capital and public trust. This trend represents a moral shift — markets are no longer just about profit but purpose.
Renewable energy, electric vehicles, and carbon-credit trading are becoming new frontiers of market growth. In essence, the explosion isn’t just financial — it’s philosophical.
8. Artificial Intelligence and the Next Market Evolution
AI is the backbone of the next stage of market evolution. From predictive analytics to automated risk management, AI systems are reshaping portfolio strategies. Machine learning models analyze historical data, news sentiment, and global indicators to generate trading insights at unmatched speed.
Even retail investors can now use AI-powered tools to optimize strategies or detect anomalies. This levels the playing field, allowing individuals to compete with institutions — provided they understand how to use data intelligently.
However, this also raises questions about market fairness and algorithmic dominance. When machines control large volumes of trades, flash crashes and liquidity spikes become real risks.
9. Challenges in the Modern Market Era
Despite its opportunities, the modern market explosion faces significant challenges:
Volatility: Rapid information flow can cause unpredictable swings.
Regulation: Governments struggle to keep up with innovations like crypto and DeFi.
Cybersecurity: As markets go digital, hacking and data breaches pose serious risks.
Inequality: Wealth gaps may widen as those with access to technology and information dominate returns.
To sustain growth, regulators, investors, and institutions must strike a balance between innovation and stability.
10. Conclusion: The Future is Decentralized, Digital, and Data-Driven
The modern market explosion is not a single event — it’s an ongoing revolution. Every innovation, every new investor, and every data-driven decision adds another spark to this dynamic ecosystem.
We’re witnessing the democratization of finance — where anyone with knowledge, discipline, and internet access can participate in wealth creation. But success will depend on adaptability, continuous learning, and emotional intelligence.
As technology continues to evolve, markets will become more decentralized, transparent, and intelligent. The future belongs to those who understand that this explosion isn’t just about money — it’s about information, connection, and evolution.
Part 2 Identifying Support and ResistanceRisks in Option Trading
While options offer flexibility, they also come with inherent risks:
Time Decay: Option value erodes as expiry nears, especially for buyers.
High Volatility: Sudden volatility spikes can cause unpredictable price swings.
Leverage Risk: Small movements in the underlying can lead to large gains or losses.
Unlimited Loss Potential for Sellers: Option writers face potentially large losses, especially with uncovered (naked) positions.
Liquidity Risk: Some stock options may have wide bid-ask spreads, making entry and exit difficult.
Proper risk management, position sizing, and stop-loss mechanisms are essential for long-term success.

ICICI BankICICI Bank has taken strong support around the 1320 zone. If this level holds move toward 1420 looks possible in the coming days

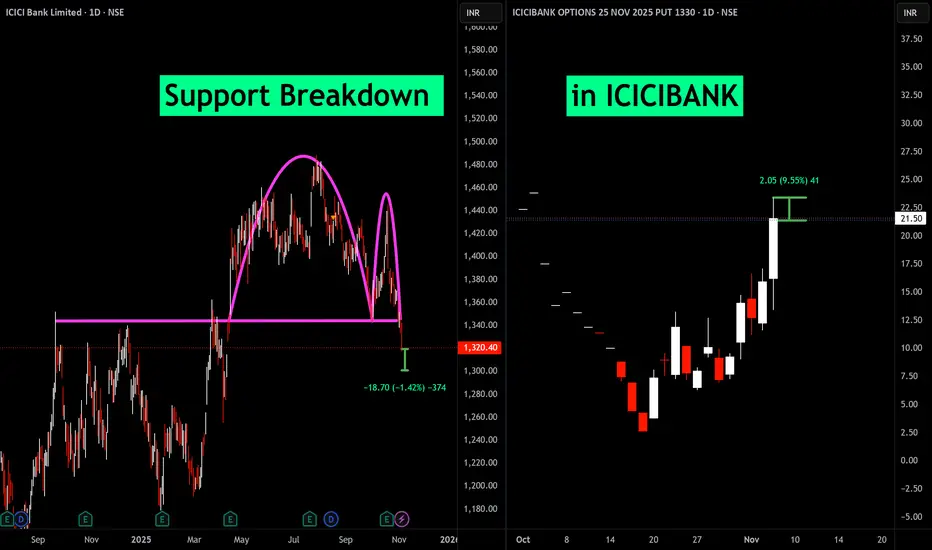
Support Breakdown in ICICIBANKThe breakdown of a key support level typically signals that sellers have gained control over the stock, which often leads to further declines.
The chart shows ICICI Bank's daily price slipping below strong support, which traders watch carefully to time short or protective put option trades.
Buying puts here benefits from the falling stock price causing put premiums to rise.
The suggested profit targets and stop-loss levels are based on technical price levels derived from the previous support turned resistance and the magnitude of the breakdown move.
This trade idea is best suited for traders comfortable with short-term bearish plays using direct short selling or options strategies that capitalize on falling prices.
Small-Cap Index Funds Volatility Explained1. Understanding Small-Cap Index Funds
Small-cap index funds track market indices composed of small-cap stocks—companies typically valued between ₹5,000 crore and ₹20,000 crore in India (or between $300 million and $2 billion globally). Examples include the Nifty Smallcap 100 in India or the Russell 2000 Index in the U.S.
Unlike actively managed funds, index funds do not attempt to pick specific stocks; they simply mirror the performance of a predefined index. This makes them cost-effective and diversified, offering investors exposure to a wide range of small companies in one investment vehicle.
While this diversification helps reduce the risk of individual company failure, it doesn’t eliminate market-level volatility, especially in the small-cap segment.
2. Why Small-Cap Stocks Are Volatile
The key reason behind small-cap fund volatility lies in the nature of the underlying small companies. They are in the growth or expansion phase of their business cycle, which makes their earnings, cash flows, and valuations less stable than those of large, established firms.
Let’s break down the main causes:
a) Limited Financial Resources
Small-cap companies often have restricted access to credit and lower cash reserves. During economic downturns or credit crises, they struggle more than large firms to raise funds or maintain operations, which can cause sharp price declines.
b) Low Liquidity
Shares of small-cap companies are traded less frequently. When investors rush to buy or sell, prices can swing widely because there are fewer buyers or sellers in the market. This low liquidity amplifies short-term price movements.
c) Higher Business Risk
Many small-cap firms operate in niche markets or rely on a limited set of products. This lack of diversification in business models means that any disruption—such as regulatory changes, technological shifts, or a key customer loss—can severely impact their earnings and, consequently, stock prices.
d) Sensitivity to Economic Cycles
Small caps are considered economic barometers. They perform strongly during expansions when demand and growth rise, but they can fall sharply during recessions or when interest rates rise. This cyclical nature adds to their volatility.
e) Market Sentiment
Investor perception plays a significant role in small-cap stock movements. In bullish phases, investors often become overly optimistic, driving prices to unsustainable levels. Conversely, during market corrections, fear can lead to steep declines. Hence, sentiment swings are more pronounced in small-cap segments.
3. Historical Perspective: Volatility Patterns
Looking at historical data, small-cap indices have shown higher annualized volatility compared to large-cap indices. For instance, over long periods, the Nifty Smallcap 100 has displayed greater short-term fluctuations compared to the Nifty 50, though it has also offered higher potential returns over a 10-year horizon.
Periods of extreme volatility often follow market corrections or macroeconomic uncertainty—like the 2008 global financial crisis or the 2020 pandemic. However, in recovery phases, small caps tend to rebound faster and outperform, as investors return to riskier growth opportunities.
4. Measuring Volatility in Small-Cap Funds
Volatility can be measured using several metrics:
a) Standard Deviation
It measures how much a fund’s returns deviate from its average over time. A higher standard deviation indicates greater volatility. Small-cap index funds typically have a higher standard deviation than mid- or large-cap funds.
b) Beta
Beta measures a fund’s sensitivity to the overall market. A beta greater than 1 indicates that the fund is more volatile than the market. Small-cap funds usually have betas ranging from 1.2 to 1.5, meaning they move more sharply in both directions compared to broader market indices.
c) Sharpe Ratio
This metric shows how much excess return a fund provides per unit of risk. Although small-cap funds may have high volatility, if they generate proportionately higher returns, they can still deliver a favorable Sharpe ratio.
5. Short-Term vs Long-Term Volatility
Volatility matters most in the short term. Over days, weeks, or months, small-cap index funds can experience large swings—sometimes 5–10% in a single session during turbulent times.
However, over long investment horizons (5–10 years), these fluctuations tend to average out. Historically, investors who remained invested through multiple market cycles often benefited from the compounding effect of growth in small companies that later became mid- or large-cap giants.
6. Benefits of Volatility: Hidden Opportunities
While volatility often sounds negative, it also presents opportunities for disciplined investors:
Higher Growth Potential: Small companies have more room to grow their earnings, and as their valuations expand, investors benefit from capital appreciation.
Mean Reversion: After sharp sell-offs, small-cap indices often recover quickly, offering attractive entry points.
Diversification Advantage: Adding a small-cap index fund to a portfolio primarily composed of large-cap stocks can improve overall portfolio returns and balance risk.
Thus, for long-term investors who can tolerate fluctuations, volatility can be a friend, not a foe.
7. Managing Volatility: Smart Investment Strategies
To navigate small-cap volatility effectively, investors can adopt several strategies:
a) Long-Term Approach
Holding investments for 7–10 years allows time for small-cap companies to grow and for short-term volatility to even out.
b) Systematic Investment Plan (SIP)
Investing through SIPs helps average out the cost of purchase across market cycles, reducing the impact of volatility.
c) Diversification
Balancing small-cap exposure with mid-cap and large-cap funds creates a more stable portfolio. This helps cushion against sudden declines in the small-cap space.
d) Regular Review
Monitoring fund performance relative to benchmarks ensures that the fund continues to align with your risk tolerance and financial goals.
e) Avoid Market Timing
Trying to predict highs and lows in volatile segments often backfires. Staying invested consistently usually yields better results than frequent trading.
8. Who Should Invest in Small-Cap Index Funds?
Small-cap index funds are not suitable for everyone. They best fit investors who:
Have a high risk tolerance
Seek long-term capital growth
Can withstand temporary market declines
Understand that volatility is part of the journey toward higher returns
For conservative investors or those nearing financial goals, it’s advisable to keep small-cap allocation limited (say 10–15% of the equity portfolio).
9. Real-World Example
Consider the Nifty Smallcap 100 Index. Between March 2020 and November 2021, it surged over 150%, reflecting a massive post-pandemic recovery. Yet, in 2022, the same index dropped around 25% due to global inflation concerns and rate hikes. This wide swing highlights the volatility inherent in small caps—but also their recovery power.
10. Conclusion
Volatility in small-cap index funds is not inherently bad—it’s a reflection of the growth potential and risk embedded in smaller businesses. These funds fluctuate more because they mirror the economic pulse of emerging companies—dynamic, ambitious, and vulnerable.
For patient, informed, and risk-tolerant investors, small-cap index funds can be powerful tools for long-term wealth creation. However, success requires discipline: understanding the market cycles, managing emotions during downturns, and staying invested long enough for volatility to transform into opportunity.
Part 4 Learn Institutional Trading Key Terminology in Option Trading
To understand options, one must be familiar with some basic terms:
Underlying Asset: The instrument on which the option is based (e.g., stock, index, or commodity).
Strike Price: The price at which the option holder can buy (call) or sell (put) the asset.
Premium: The cost paid by the option buyer to acquire the contract.
Expiration Date: The date when the option contract becomes void.
In-the-Money (ITM): A call option is ITM when the underlying price is above the strike; a put is ITM when the price is below the strike.
Out-of-the-Money (OTM): The opposite of ITM. The call option has no intrinsic value when the price is below the strike; a put option has none when the price is above the strike.
At-the-Money (ATM): When the underlying price and strike price are nearly equal.
Intrinsic Value: The actual profit if the option were exercised immediately.
Time Value: The portion of the premium that reflects the probability of the option gaining value before expiry.

Divergence Secrets How Option Pricing Works
The price (premium) of an option is influenced by several factors, collectively known as the “Option Greeks”:
Delta: Measures how much the option price changes with a ₹1 change in the underlying asset.
Gamma: Indicates the rate of change of Delta.
Theta: Represents the time decay of the option’s value as it approaches expiry.
Vega: Measures sensitivity to volatility.
Rho: Indicates sensitivity to interest rate changes.
Additionally, the volatility of the underlying asset and time to expiry play crucial roles in determining option prices. Higher volatility increases the premium, as uncertainty boosts the potential for profit.
