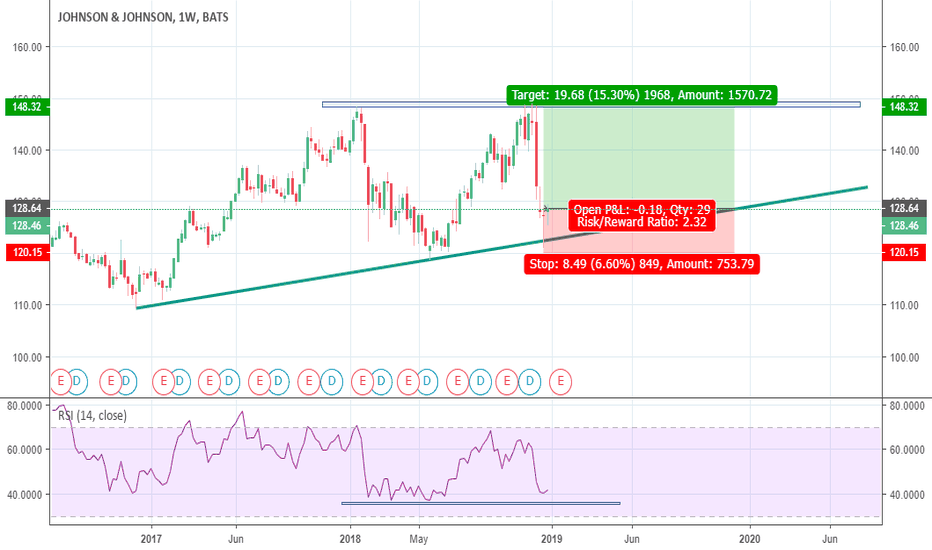
JNJ at the best possible place to buyJNJ has recently been through a sharp correction in its price and currently, it is trading at $160.39, so when we check the charts on the weekly timeframe we can see that the price has previously taken support from this exact point and has shot up every time, additionally the price has also tested a
Johnson & Johnson Shs Cert Deposito Arg Repr 0.066666666 Shs
No trades
0.55 USD
12.49 B USD
78.89 B USD
About Johnson & Johnson
Sector
Industry
CEO
Joaquin Duato
Website
Headquarters
New Brunswick
Founded
1887
Identifiers
2
ISIN:ARDEUT110236
Johnson & Johnson is a holding company, which engages in the research, development, manufacture, and sale of products in the healthcare field. It operates through the Innovative Medicine and MedTech segments. The Innovative Medicine segment focuses on immunology, infectious diseases, neuroscience, oncology, cardiovascular and metabolism, and pulmonary hypertension. The MedTech segment includes a portfolio of products used in the interventional solutions, orthopaedics, surgery, and vision categories. The company was founded by Robert Wood Johnson I, James Wood Johnson, and Edward Mead Johnson Sr. in 1887 and is headquartered in New Brunswick, NJ.
Related stocks
JNJ - A Buy Opportunity
My chart tells that there is a low risk buy opportunity on JNJ.
Buy price 143.75
Stop Loss 141.33 ($2.42 only)
First target 147.67
Second Target 150-151
Third target 155-157
The first target is very achievable. So with a buy quantity of 300 the risk is only under $750 and the profit on reachin
See all ideas
Summarizing what the indicators are suggesting.
Oscillators
Neutral
SellBuy
Strong sellStrong buy
Strong sellSellNeutralBuyStrong buy
Oscillators
Neutral
SellBuy
Strong sellStrong buy
Strong sellSellNeutralBuyStrong buy
Summary
Neutral
SellBuy
Strong sellStrong buy
Strong sellSellNeutralBuyStrong buy
Summary
Neutral
SellBuy
Strong sellStrong buy
Strong sellSellNeutralBuyStrong buy
Summary
Neutral
SellBuy
Strong sellStrong buy
Strong sellSellNeutralBuyStrong buy
Moving Averages
Neutral
SellBuy
Strong sellStrong buy
Strong sellSellNeutralBuyStrong buy
Moving Averages
Neutral
SellBuy
Strong sellStrong buy
Strong sellSellNeutralBuyStrong buy
Displays a symbol's price movements over previous years to identify recurring trends.
US478160CM4
Johnson & Johnson 3.5% 15-JAN-2048Yield to maturity
5.31%
Maturity date
Jan 15, 2048
JNJJ
Johnson & Johnson 3.75% 03-MAR-2047Yield to maturity
5.31%
Maturity date
Mar 3, 2047
US478160BV5
Johnson & Johnson 3.7% 01-MAR-2046Yield to maturity
5.28%
Maturity date
Mar 1, 2046
US478160CX0
Johnson & Johnson 5.25% 01-JUN-2054Yield to maturity
5.28%
Maturity date
Jun 1, 2054
US478160CT9
Johnson & Johnson 2.45% 01-SEP-2060Yield to maturity
5.22%
Maturity date
Sep 1, 2060
US478160CS1
Johnson & Johnson 2.25% 01-SEP-2050Yield to maturity
5.20%
Maturity date
Sep 1, 2050
JNJB
Johnson & Johnson 4.5% 05-DEC-2043Yield to maturity
5.15%
Maturity date
Dec 5, 2043
US478160BA1
Johnson & Johnson 4.85% 15-MAY-2041Yield to maturity
4.95%
Maturity date
May 15, 2041
US478160CR3
Johnson & Johnson 2.1% 01-SEP-2040Yield to maturity
4.94%
Maturity date
Sep 1, 2040
JNJ.GT
Johnson & Johnson 4.5% 01-SEP-2040Yield to maturity
4.77%
Maturity date
Sep 1, 2040
US478160CL6
Johnson & Johnson 3.4% 15-JAN-2038Yield to maturity
4.76%
Maturity date
Jan 15, 2038
See all JNJC bonds
Curated watchlists where JNJC is featured.


