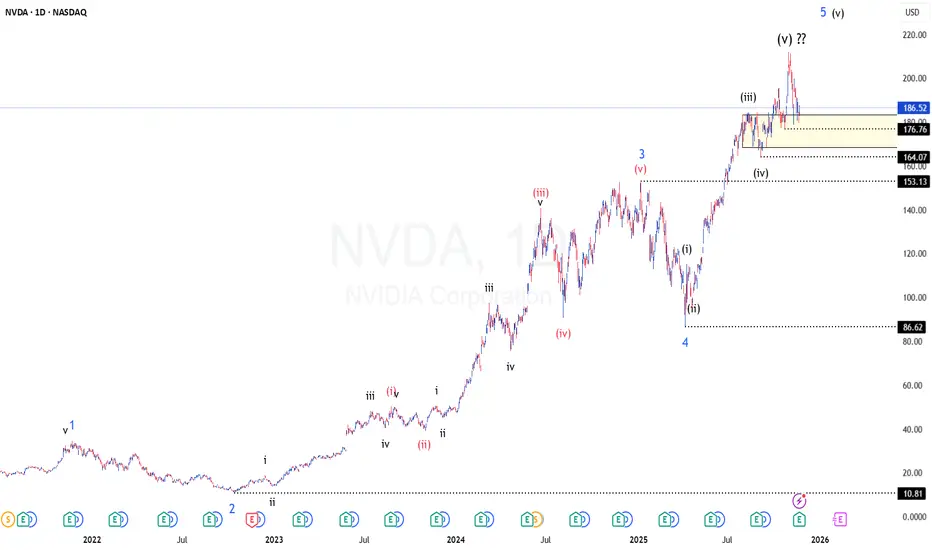
NVDA - End of Trend or one more high is due?TF: Daily
CMP: 186.52
The EW counts suggests that we are at the end of the trend on this counter.
The 4th wave ended at 86.62 on April 2025 and the price moved past 200 since then (3x move in about 7-8 months).
To me, looks like the upmove has ended, but no confirmation yet. So long as the price
0.14 USD
64.78 B USD
116.00 B USD
About NVIDIA Corporation
Sector
Industry
CEO
Jen Hsun Huang
Website
Headquarters
Santa Clara
Founded
1993
ISIN
ARBCOM460184
NVIDIA Corp. engages in the design and manufacture of computer graphics processors, chipsets, and related multimedia software. It operates through the following segments: Graphics Processing Unit (GPU) and Compute & Networking. The Graphics segment includes GeForce GPUs for gaming and PCs, the GeForce NOW game streaming service and related infrastructure, Quadro and NVIDIA RTX GPUs for enterprise workstation graphics, virtual GPU, or vGPU, software for cloud-based visual and virtual computing, automotive platforms for infotainment systems, and Omniverse Enterprise software for building and operating metaverse and 3D internet applications. The Compute & Networking segment consists of Data Center accelerated computing platforms and end-to-end networking platforms including Quantum for InfiniBand and Spectrum for Ethernet, NVIDIA DRIVE automated-driving platform and automotive development agreements, Jetson robotics and other embedded platforms, NVIDIA AI Enterprise and other software, and DGX Cloud software and services. The company was founded by Jen Hsun Huang, Chris A. Malachowsky, and Curtis R. Priem in April 1993 and is headquartered in Santa Clara, CA.
Related stocks
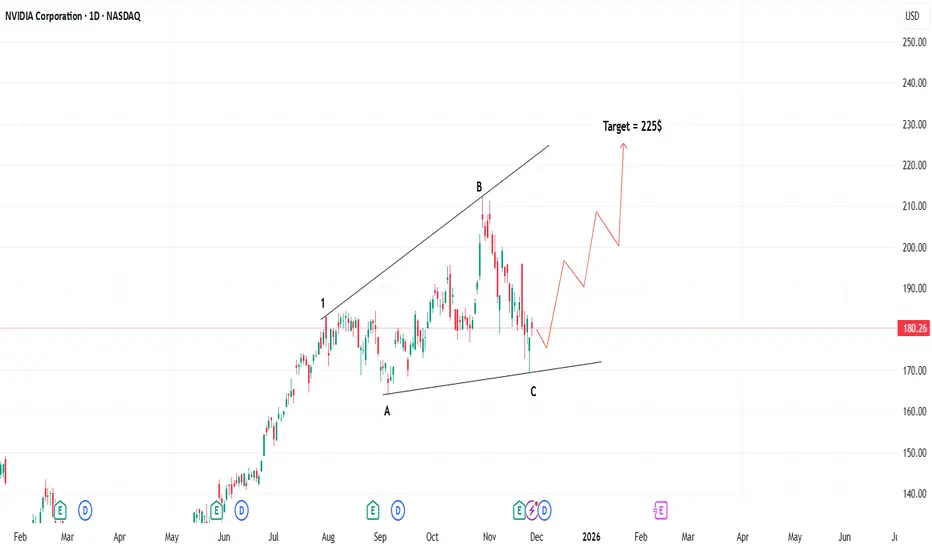
NVIDIA Bullish setupNvidia enter's into buy zone for an target of $225.
As per Wave analysis, Correction in daily time frame completed, now it's ready for an impulse with an target of $225
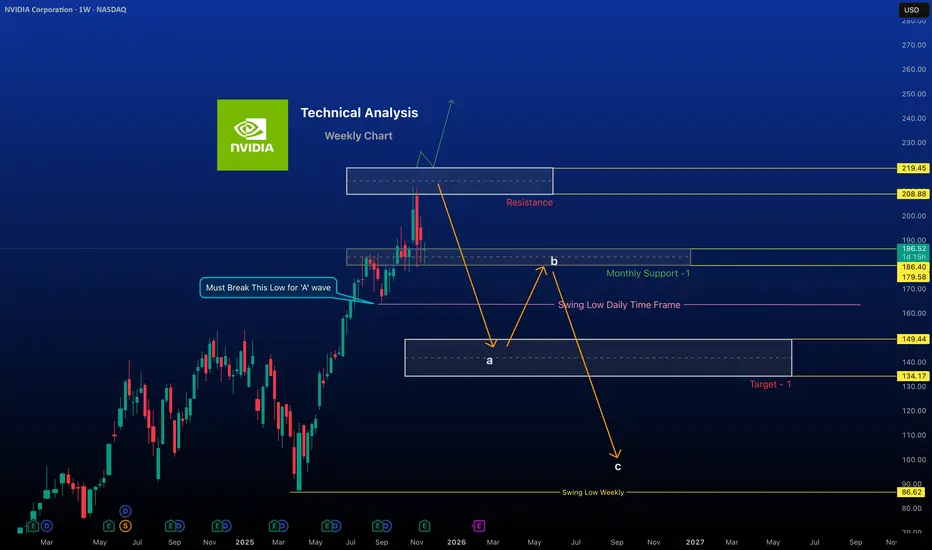
NVIDIA Turn consolidation phase In Weekly Time frame“Chip maker? More like dip maker today.”
#NVIDIA
Trend / Momentum
The stock is in a consolidation phase and range-bound lately, not in a strong runaway uptrend. However, RSI is around neutral (~52), indicating neither overbought nor oversold conditions.
Support & Resistance Levels
Support: Key
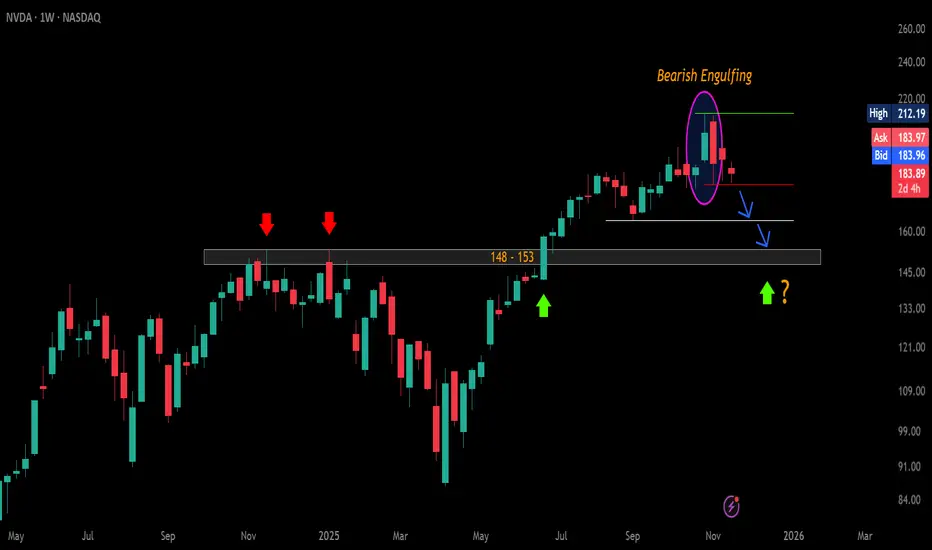
$NVDA – Weekly Bearish Signal Triggering?CMP: $184
NVDA has formed a Bearish Engulfing on the weekly chart and is currently trading inside the engulfed candle.
A WCB / sustained break below $178.91 will confirm the pattern → likely dragging price toward $164 and the major $153–$148 breakout-retest zone . 🔻
A WCB above the ATH $
NVIDIA Technical analysis chartAs we know, I already publish the weekly chart technical analysis so here the analysis chart of weekly basis
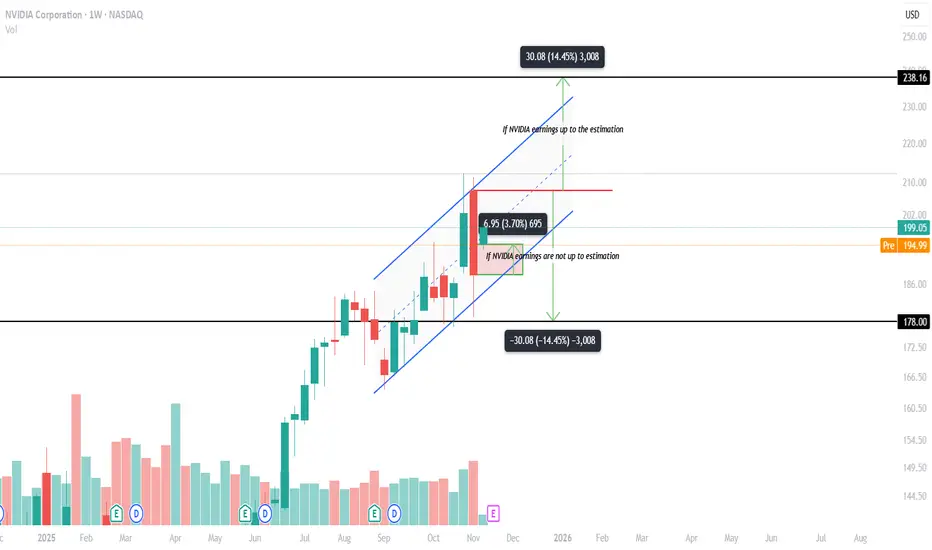
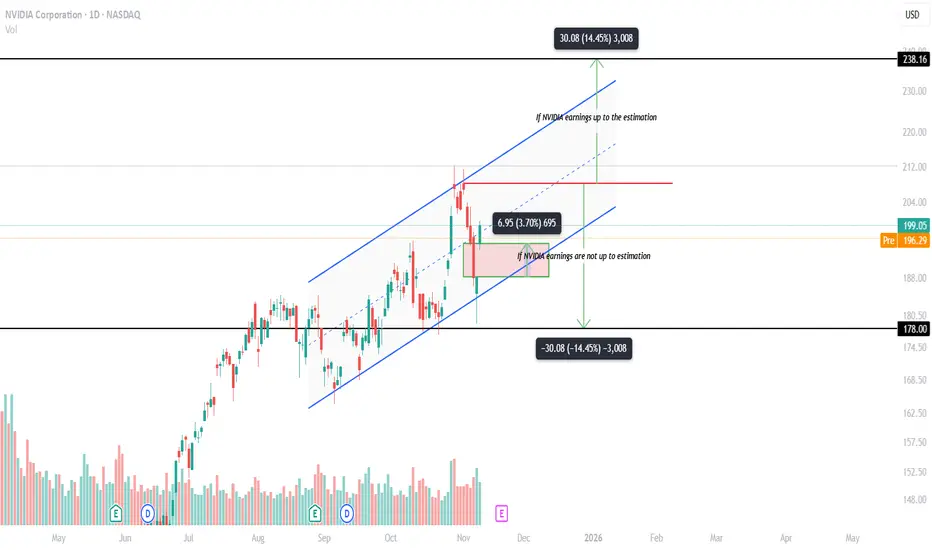
NVIDIA TRADE IDEATechnical analysis of NVIDIA Corporation
ON DAILY BASIS
- As we seen on above chart, it is in Daily basis.
- It shows upward trend.
- On between 7th November,2025 & 10th November,2025 Liquidity gap is formed it may fill the gap ($6.95 or 3.70%) on 11th November,2025 after that it will go up to $

NVDA UP TO 214$Hello
According to my analysis on the NVDA daily chart, I can confirm a high-probability buy opportunity that could reach $214 within the next few days.
Ibrouri Abdessamad

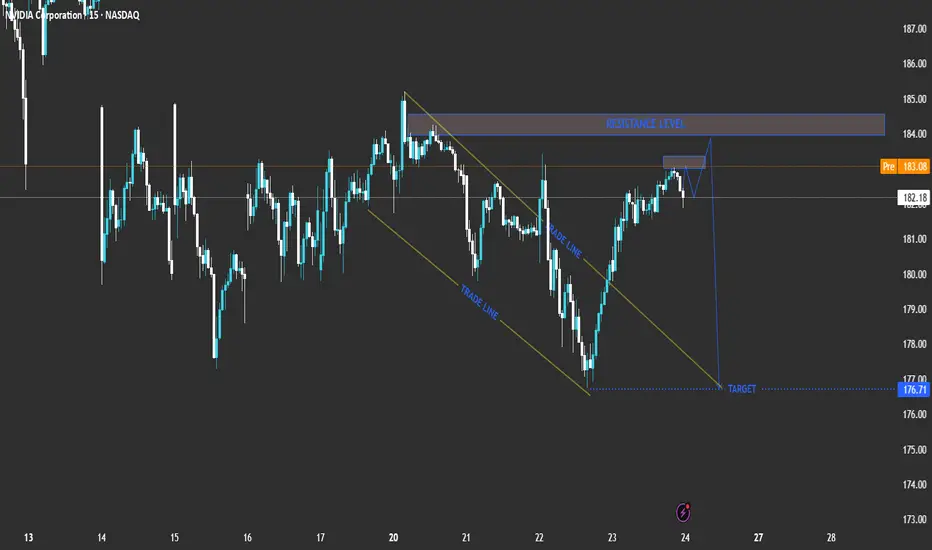
l analysis for NVIDIA Corporation (NVDA) based on your chart:Current Price: 182.18
Pre-Market Price: 183.21
Trend: Short-term bullish recovery inside a broader corrective phase.
Technical Breakdown
Descending Channel (Trade Line)
NVDA recently traded inside a downward-sloping channel, showing controlled selling pressure.
The breakout above the upper tra
NVIDIA CORPORATION #NVDA #NASDAQ $NVDANvidia Corporation is breakout above 184.48
I'm initiating fresh long here with 181 as intraday stop loss.
I will be out completely if closing comes below 184.48.

See all ideas
Summarizing what the indicators are suggesting.
Oscillators
Neutral
SellBuy
Strong sellStrong buy
Strong sellSellNeutralBuyStrong buy
Oscillators
Neutral
SellBuy
Strong sellStrong buy
Strong sellSellNeutralBuyStrong buy
Summary
Neutral
SellBuy
Strong sellStrong buy
Strong sellSellNeutralBuyStrong buy
Summary
Neutral
SellBuy
Strong sellStrong buy
Strong sellSellNeutralBuyStrong buy
Summary
Neutral
SellBuy
Strong sellStrong buy
Strong sellSellNeutralBuyStrong buy
Moving Averages
Neutral
SellBuy
Strong sellStrong buy
Strong sellSellNeutralBuyStrong buy
Moving Averages
Neutral
SellBuy
Strong sellStrong buy
Strong sellSellNeutralBuyStrong buy
Displays a symbol's price movements over previous years to identify recurring trends.
NVDA4971918
NVIDIA Corporation 3.5% 01-APR-2050Yield to maturity
5.20%
Maturity date
Apr 1, 2050
NVDA4971919
NVIDIA Corporation 3.7% 01-APR-2060Yield to maturity
5.16%
Maturity date
Apr 1, 2060
NVDA4971917
NVIDIA Corporation 3.5% 01-APR-2040Yield to maturity
4.82%
Maturity date
Apr 1, 2040
US67066GAE4
NVIDIA Corporation 3.2% 16-SEP-2026Yield to maturity
4.01%
Maturity date
Sep 16, 2026
US67066GAN4
NVIDIA Corporation 2.0% 15-JUN-2031Yield to maturity
3.98%
Maturity date
Jun 15, 2031
NVDA4971916
NVIDIA Corporation 2.85% 01-APR-2030Yield to maturity
3.86%
Maturity date
Apr 1, 2030
NVDA5203204
NVIDIA Corporation 1.55% 15-JUN-2028Yield to maturity
3.63%
Maturity date
Jun 15, 2028
See all NVDAC bonds
Curated watchlists where NVDAC is featured.


