BCH making bullish strong candle after breaking the triangle patBitcoin cash (BCH) gave a positive breakout after breaching its 20-Day Moving Averages of $430. After a sharp correction from the higher level of $630 formed a descending triangle pattern and slipped below the 20-Day Moving Averages (DMA). However, it successfully holds the major moving averages of $100 and 200-DMA. Support on the chart is situated at $375 and $340. Meanwhile, on the higher side, the resistance is placed at $480 and $540. Likewise, the strong hurdle is at $630, which can be acting in upcoming trading sessions. The levels can be expected after clearing the resistances are $750 and $880 positions.
themarketperiodical.com
BCHUSD.P trade ideas
BCH Making Comeback From Bearish RegimeBitcoin cash
performed a positive momentum on Thursday’s trading session
Bitcoin cash price is $395.93, which is down by 0.53% in last 24 hour time-frame and 14.91% down from the previous week
BCH/BTC pair is positive with a gain of 0.97% in Thursday’s trading session (0.012554)
Bitcoin Cash Value Losing Bullish movement Bitcoin Cash price is up by 2.65% on Saturday's trading session. The price is consolidating for now and can see no signs of positive retracement during the session. So the trend remains negative price may fall till the support zone of 409.50
Resistance: $547.00
Support: $409.50
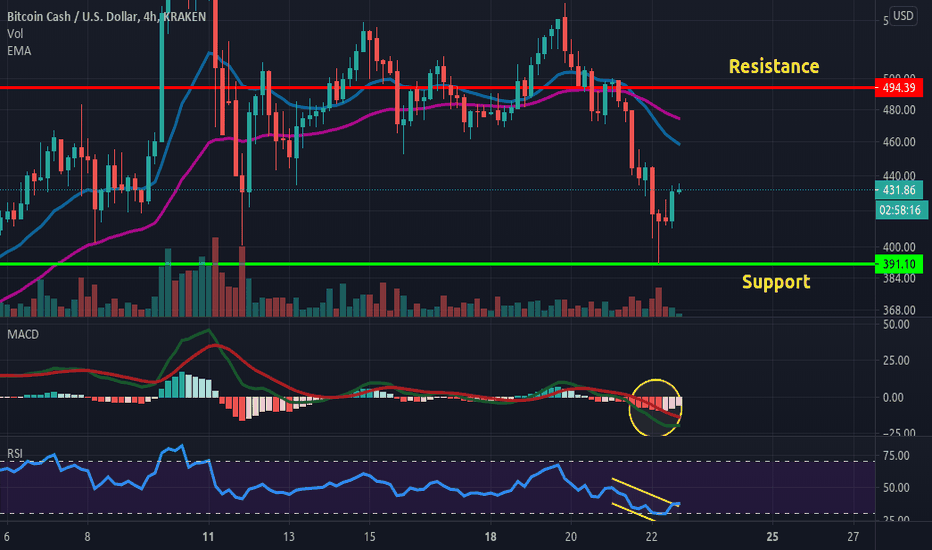
Bitcoin Cash Value Below $500; May Plunge Till $391Bitcoin Cash Value is down by 7.42% on Friday's trading session. The price is below 20 and 50 days EMA, and it can move towards the support level of $391. One can further expect a short term recovery in the coin for a while, and then it can be bearish in the upcoming trading session.
Resistance: $494.39
Support: $391.10
LONG BCH/USDAfter a quick look the price has recently broken a Daily resistance "darker blue line" conforming my buying bias.
After that waited for it to get the cheapest possible in the current context, ps: waited a little too long, actually I've entered pretty late, but the R/R remains strong with this one.
Either way it's all fun and remember i'm a random guy on the internet you should not follow my lead, big love guys peace!
BCH / USD Price Analysis: Staging RecoveryBitcoin Cash / USD Short-term price analysis
BCH has a neutral short-term trading bias, with the BCH / USD pair now testing towards its 200-period moving average on the four-hour time frame.
The four-hour time frame is currently showing that the BCH / USD pair is attempting to recover from early week losses, while any presence of bullish MACD price divergence has now been eradicated.
Technical indicators on the four-hour time frame are bullish and continue to signal further near-term upside.
Pattern Watch
Traders should note that a bullish inverted head and shoulders pattern could start to take shape on the four-hour time frame if the recent recovery gathers pace.
Relative Strength Index
The RSI indicator on the four-hour time frame has turned bullish and has scope to move even higher.
MACD Indicator
The MACD indicator on the four-hour time frame is bullish, with the MACD signal line issuing a buy signal.
Fundamental Analysis
BCH has been surging over the past several days. This may be explained by the project’s expected launch of Schnorr Signatures, which should improve on-chain security and privacy.
Bitcoin Cash / USD Medium-term price analysis
BCH has a bullish medium-term trading outlook, with the BCH / USD pair still trading well above its 200-day moving average.
The daily time frame highlights that major technical support held firm during the recent decline in the BCH / USD pair, with the neckline of the inverted head and shoulders pattern acting as critical technical support.
Technical indicators on the daily time frame are currently mixed and providing no clear trading signal.
BCH / USD Daily Chart by TradingView
Pattern Watch
The daily time frame shows that a bearish head and shoulders pattern could start to take shape if the BCH / USD pair comes under further downside pressure.
Relative Strength Index
The RSI indicator on the daily time frame is currently neutral.
MACD Indicator
The MACD indicator on the daily time frame is neutral, with both the MACD signal line and the MACD histogram failing to generate a clear trading signal.
Fundamental Analysis
The medium-term prospects for BCH remain highly speculative. The project still lacks mainstream adoption, especially when compared to big names like Bitcoin.
Conclusion
BCH has staged an impressive upside recovery after coming under heavy technical pressure towards critical technical support.
Buyers now need to build on the bullish momentum and move price back above the BCH / USD pair’s 200-period average on the four-hour time frame.
BCH/USDBCH/USD(Bitstamp)
As mentioned in the previous article last week, Bitcoincash has been under correction(dropping) and it dropped further 20%+ since last week.
Bullish Case:
After surging 200%+ in the mid of December, It has dropped 50% at the time of writing.Though such drop is usual after such price surge but it need to holds $123-$109 price level to continue bullish momentum.Bullish confirmation will be when it breaks $220+ level in the coming days/weeks with a target around $350+ price level
Bearish Case:
If it doesn't hold the $123-$109 then it will slightly bearish for the asset and we might see the price fall below $100 in the coming days/weeks.


