$Bitcoin Cash The Sleeping Giant Just Woke Up $1000 is targetBitcoin Cash (BCH) has finally broken out of its multi-month consolidation, blasting above the key $600 resistance with increasing volume and clean market structure. This is exactly the type of breakout that marks the beginning of a new macro trend rather than a short-term spike.
Momentum is shifting hard:
Volume expanding
Market structure flipped bullish
RSI reclaiming the macro uptrend zone
Post-halving lag effect kicking in
Liquidity rotating into high-beta legacy altcoins
This combination is rare — and historically leads to fast, vertical rallies.
---
🎯 Bullish Targets
$720 — First supply zone
$880 — Major breaker block
$1000–$1050 — The psychological level acting like a price magnet
Once BCH clears $720, the run toward $1000 usually accelerates quickly as liquidity gaps open up.
---
🧭 Market Reasoning
Legacy altcoins tend to move late in the cycle, but when they move, they move aggressively.
BCH currently shows:
Clear higher-high / higher-low structure
Strong trend continuation signals
A clean liquidity gap directly toward $880–$1000
This is the setup that fuels multi-week rallies.
---
💬 My View
As long as BCH holds above $580–$600, the bullish structure remains intact.
Momentum, sentiment, and technical structure all align toward one direction:
$1000 is not just a target — it’s the next logical zone.
Trade ideas

$BCH hasn’t hit a new ATH since 2017: Dead or Utimate Sleeper?SET:BCH hasn’t hit a new ATH since 2017: Dead or the Utimate Sleeper?
SET:BCH ATH: $4,212 (Dec 2017)
CRYPTOCAP:BTC ATHs: $19,800 (Dec 2017), $69,000 (2021), $126,000 (2025)
Observation:
SET:BCH hasn’t touched a new ATH since 2017.
CRYPTOCAP:BTC surged 6x+ after 2017 ATH, but SET:BCH stalled.
Is SET:BCH dead ❓
Key TA Levels:
🔹 Strong accumulation zone: $465 – $375
🔹 Critical support: $375 (holding this is essential)
🔹 Potential upside: $2,000 – $4,000 if momentum returns
Eyes on these levels. SET:BCH could be a sleeper play if it reclaims support.
Pro Tip: Patience + volume confirmation = key before any breakout.
NFA & DYOR

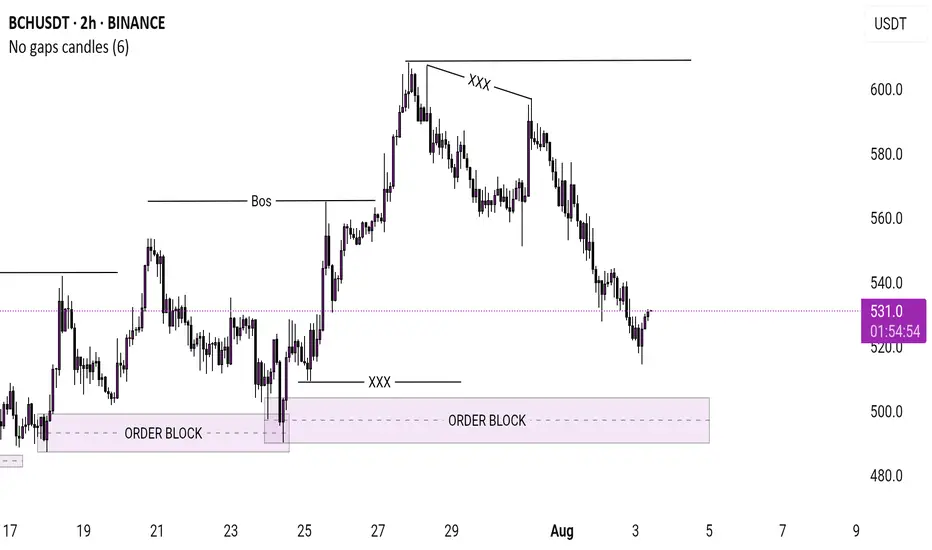
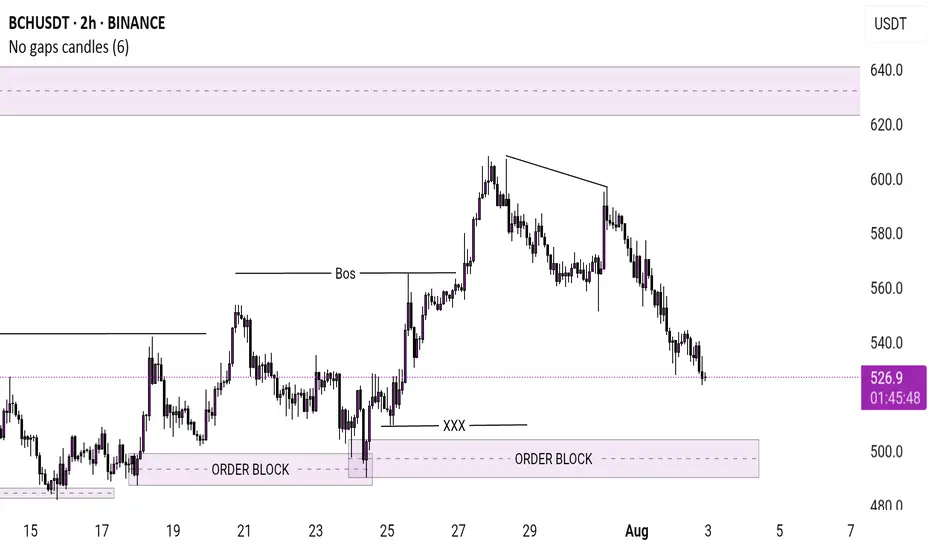
Fresh untouched Order Block is ready Down trend continues but the Order Block is ready for a push to upside
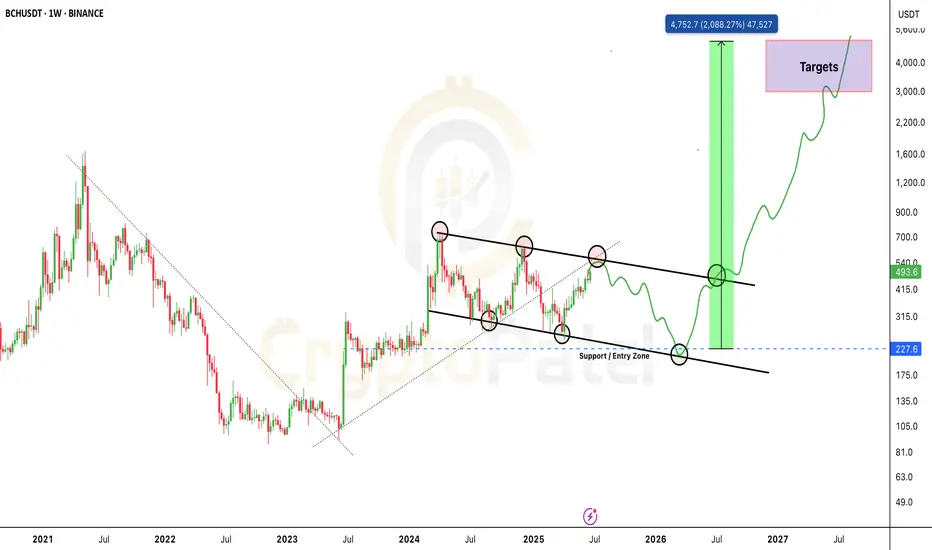
BCH Could 10x in the Next Bull Run — But Not YetBCH Could 10x in the Next Bull Run — But Not Yet
Bitcoin Cash is still trading inside a big falling channel.
Every time price hits the lower zone at Bull Flag, it bounces back up — this is the strong Support / Entry Zone.
Right now, BCH is near the upper Trendline Resistance (~$550-$580).
But IMO, we could see one more retracement before the next big bull run. I’m expecting price to revisit the $250–$210 zone before the next leg up.
However, if BCH breaks and holds above $640, that would confirm a bull flag breakout — turning the structure fully bullish with potential long-term targets between $1,800 – $4,000+ by 2026–2027.
Stay alert. The setup is big — but timing is key.
Note: NFA & DYOR

BCH/USDT — The Final Dip Before a 10x Move?Weekly Chart Analysis | Long-Term Setup
BCH is forming a powerful macro structure that could lead to a massive breakout.
🔹 Descending Channel Structure
The price has been respecting a clean descending channel since 2023.
Each rejection from the upper trendline has led to a higher low — showing clear accumulation.
🔹 Key Entry Zone: $220–$230
This zone has acted as major support multiple times.
If BCH revisits this level and holds again, it could trigger a major trend reversal.
🔹 Breakout Targets: $3,000–$5,000
If the breakout occurs as projected, BCH could rally into this zone in the coming bull cycle.
This would be a potential 10x+ opportunity from the bottom range.
Final Thoughts:
📌 This is not a short-term play.
📌 It’s a macro setup for serious investors and position traders.
📌 The structure mirrors historical accumulation zones seen before massive moves.
💬 What’s your take on BCH long-term?
Comment below and share your chart if you’re tracking it too 👇
BCUSDT.P
Bitcoin Cash (BCH) has been gaining attention as a potential investment opportunity1
. It aims to address some of Bitcoin's scalability issues, offering faster and cheaper transactions1
. However, investing in cryptocurrencies can be highly volatile and risky.
Before making any investment decisions, it's crucial to do thorough research and consider factors like market trends, news, and your own risk tolerance. Consulting with a financial advisor might also be a good idea.

BCHUSDT.PAh, the symmetrical triangle pattern—a geometric dance of bulls and bears on the price chart! 📐🐂🐻
Let’s unravel this intriguing formation step by step:
What Is a Symmetrical Triangle Pattern?
A symmetrical triangle (also known as a “coil”) is a chart pattern characterized by two converging trendlines. These trendlines connect a series of sequential peaks and troughs.
Picture it: Imagine two trendlines—one sloping upward and the other sloping downward—coming together like old friends meeting at a café. The result? A narrowing pattern that resembles a triangle.
Now, if those trendlines don’t fully oppose each other (i.e., they’re not perfectly horizontal), we get other patterns like the rising wedge, falling wedge, ascending triangle, or descending triangle.
Symmetrical triangles represent a pause in the prevailing trend. Bulls and bears are momentarily in equilibrium, catching their breath before the next move.
Breakout Direction Matters:
Once the price decisively breaks out from the symmetrical triangle, it often signals either:
The start of a new trend (if it breaks above the upper trendline), or
The continuation of the prior trend (if it breaks below the lower trendline).
Think of it as a tug-of-war: Whichever side pulls harder wins.
Price Targets and Stop-Loss:
The price target for a breakout or breakdown from a symmetrical triangle is equal to the distance between the initial high and low applied to the breakout or breakdown point.
Example: If the pattern starts with a low at $10 and reaches a high of $15 before narrowing, a breakout from $12 implies a target of $17 ($15 - $10 = $5, then + $12 = $17).
Traders often place a stop-loss just below the breakout point. Safety first, right?
Confirmation and Additional Indicators:
Combine symmetrical triangles with other forms of technical analysis for confirmation. It’s like having backup dancers on stage—they enhance the performance.
Watch for volume changes during the breakout—it’s like the crowd cheering louder when the winner emerges.
Remember the Dance:
Symmetrical triangles are like a suspenseful pause in a movie. The actors freeze, and the audience wonders, “What’s next?”
So, keep an eye on those converging trendlines—they’re plotting the script for the next scene! 🎬📈

Buy Trade Idea for BCH (Bitcoin Cash) - Capitalizing on SolidDescription
Bitcoin Cash (BCH) is a prominent cryptocurrency known for its scalability and transaction efficiency. Here are the key fundamentals that support a buy trade for BCH:High Transaction Speed and Low Fees: Bitcoin Cash was created to address Bitcoin’s scalability issues, offering faster transaction times and lower fees, which makes it suitable for everyday transactions.Large Block Size: With an increased block size, BCH can handle more transactions per block, reducing congestion and ensuring smoother network operations.Widespread Adoption: BCH has been widely adopted by merchants and service providers, enhancing its utility as a digital currency for payments.Active Development Community: The ongoing development and upgrades by a dedicated community ensure that Bitcoin Cash remains competitive and adaptable to market needs.These strong fundamentals make BCH an attractive investment opportunity, offering both utility and potential for growth in the cryptocurrency market.
Disclaimer
Trading and investing in cryptocurrencies involve significant risk and can result in substantial losses. The content provided here is for informational purposes only and should not be considered financial advice. Always conduct your own research, consider your risk tolerance, and consult with a financial advisor before making any investment decisions. Past performance is not indicative of future results, and the value of investments can fluctuate widely.

Bitcoin cash good rising pattern from the bottomSimple breakouts price action seen in Bitcoin cash. It has lot of potential. Treadline breakout is already done in day timeframe. Retesting it and booooom….
Keep this in mind. Options is a dangerous instrument to play. Please do not go wild on anything unless you know exactly what you doing. Even though your direction is right still you tend to loose in option buying. And market can always prove me wrong and i take that rights too. Experience traders also fail in this market. Only risk management will give you an edge. Don’t take any trades without SL. Respect the market, Ungli nahi katoge to pura hath katna padega. Beware.
DISCLAIMER: I AM NOT SEBI REGISTERED ANALYST. ALL POSTS ARE EDUCATIONAL PURPOSES.NON ADVISORY, DISCRETIONAL NO CLAIMS, RIGHTS RESERVED. I AM NOT RESPONSIBLE FOR YOUR PROFIT OR LOSS.

Bitcoin Cash: Breakout or Breakdown? Critical Levels to Watch!Yello, Paradisers! Have you noticed the recent patterns forming in BCHUSDT? It's shaping up to be a pivotal moment for Bitcoin Cash. Let’s dive into the details!
💎BCHUSDT has recently taken liquidity and is forming a triangle pattern. On the lower timeframes, BCH has developed a W pattern, which typically signals a higher probability of a bullish move. However, to confirm this and target higher levels, we need a breakout and a candle closing above the resistance zone. This confirmation would significantly increase the likelihood of a bullish continuation.
💎If BCH breaks out and closes candle above the resistance zone, it would validate the bullish W pattern and open the door for higher targets.
💎In the event of a pullback, we can expect a bounce from the support zone, potentially forming a triple bottom, which is another bullish sign.
💎Conversely, if BCH breaks down and closes below the support zone, it will invalidate our bullish outlook.
Stay focused, patient, and disciplined, Paradisers. This is the only way you can make it far in your crypto trading journey. Be a PRO💰
MyCryptoParadise
iFeel the success🌴

Are Bulls Of Bitcoin Cash Ready For A Run?Bitcoin Cash has a market cap of $9.2 Billion and is ranked 16th in the CMC. It has a VM ratio of 0.02 with a surge of 2% in the overall volume. BCH is currently trading near the value of $470 with a slight gain in the intraday session.
Bitcoin cash price is currently in a weak consolidating range. It is trading below the 50 and 100 EMA which can act as resistance for the price. BCH upside trend can see a halt near the value of $550. Meanwhile, the support of the asset price can be observed near $400.
The RSI of BCH is currently near 49 with no slope in it. The overall sentiment of the RSI is neutral in nature.

Keep a close eye on BCHUSDT as it approaches crucial levels👀💎 Paradisers, #BCH is approaching the supportive trendline and the previously broken resistance area, which might now serve as a support.
💎If #BCHUSDT breaks its higher low and exhibits signs of a Change of Character (CHoCH) and Break of Structure (BOS) from this support zone, we can expect a bounce to the next swing resistance.
💎However, if there is no confirmation and the support zone along with the supportive trendline break down, it will be viewed as bearish. Nonetheless, there is another support zone below this, which is considered stronger. Even so, confirmation is crucial before taking action there as well.

BCH: We might see a rebound from there.🚀💎 Paradisers, #BCH is currently experiencing panic selling, and I am expecting a potential breakdown of the supportive trendline to gather liquidity for an upward trend.
💎If #BCHUSDT breaks below the trendline and exhibits a Change of Character (CHoCH) and Break of Structure (BOS) from the bullish Order Block (OB), which coincides with the Fibonacci 0.618 level, we might see a rebound from this point.
💎However, if the price falls below this level, it would typically be considered bearish. In this scenario, I would recommend not focusing on this move.

BCH Pumped 107% in 10 Days #BitcoinCash Pumped 107% in 10 Days
➡️ Bullish Pennant Breakout
➡️ Breakout + Retest
➡️ Perfect Target as per Chart Pattern
CRYPTOCAP:BCH

BCHUSDT is under symmetrical triangle patternSignifies consolidation and accumulation.
The price sets lower high and higher lows respecting two trendlines to identify markets future direction, one should wait for bearish or Bullish breakout of the triangle pattern

Long view on Bitcoin Cash i.e. BCHUSDTIt is on the verge of good breakout after making good accumulation, if sustains and closes above 280 then can give good pump upwards

BCH/USDT: A Comprehensive Outlook for Traders and Investors
In this technical analysis, we delve into the BCH/USDT trading pair to identify potential trading opportunities for both aggressive players and long-term investors.
1. Resistance Area - 250-257:
The BCH/USDT pair encounters a robust resistance zone between 250 and 257. Historical data indicates that price movements tend to stall or experience pullbacks around this level. Traders should approach long positions with caution, as the price may struggle to break through this barrier in the short term.
2. Aggressive Shorting Opportunity at 235-240:
For aggressive players, shorting opportunities arise at the current price levels of 235-240. As the price approaches the upper range of the resistance area, bearish sentiment could intensify, leading to potential short-term declines.
3. Expected Correction to 195-200 Levels:
Our analysis suggests an impending corrective phase for BCH/USDT, with the price likely to correct towards the support levels of 195-200.
4. Favorable Buying Area - 140-150 Levels:
A compelling buying opportunity emerges at the 140-150 support range. Long-term investors seeking to build positions in BCH may find this area advantageous for accumulating assets.
Remember to adopt prudent risk management strategies to maximize gains and mitigate potential losses. Stay informed, and happy trading!

BCH LongFormation of a bullish Pennant pattern and it's break out happened in BCH 4hr Chart. #NFA, Always DYOR.


