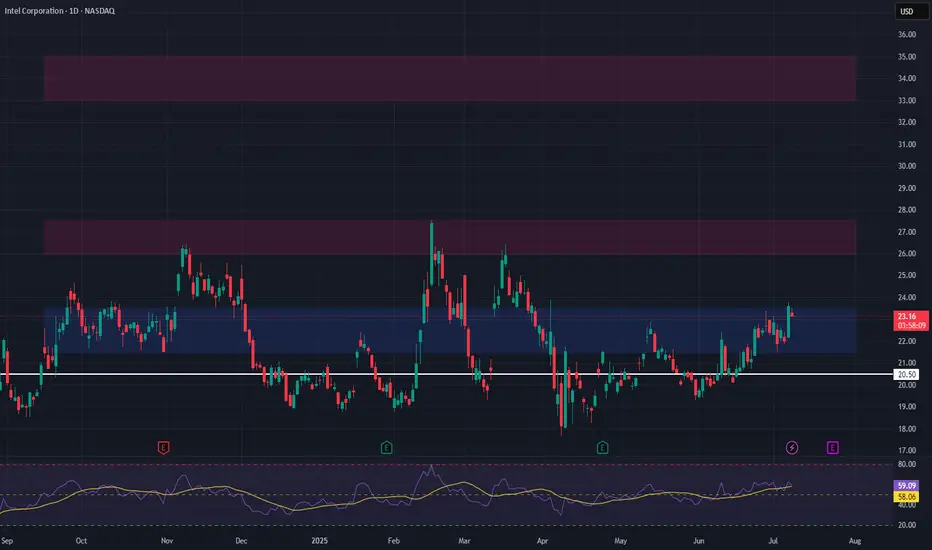
Hanging Man at the Highs: A Risk-Management LessonIntel Corporation had already started showing early warning signals after a strong, extended rally .
A Hanging Man candlestick near the highs signaled potential exhaustion , indicating that the risk–reward for fresh longs was no longer favorable . Such signals often emerge before momentum s
Intel Corporation
No trades
Next report date
—
Report period
—
EPS estimate
—
Revenue estimate
—
−71 CLP
−241.41 B CLP
47.79 T CLP
4.22 B
About Intel Corporation
Sector
Industry
CEO
Lip-Bu Tan
Website
Headquarters
Santa Clara
Founded
1968
IPO date
Oct 13, 1971
Identifiers
3
ISIN US4581401001
Intel Corp. engages in the design, manufacture, and sale of computer products and technologies. It delivers computer, networking, data storage, and communications platforms. The firm operates through the following segments: Client Computing Group (CCG), Data Center and AI (DCAI), Intel Foundry Services (IFS), and All Other. The CCG segment consists of platforms designed for notebooks, 2-in-1 systems, desktops, tablets, phones, wireless and wired connectivity products, and mobile communication components. The DCAI segment delivers solutions to cloud service providers and enterprise customers, along with silicon devices for communications service providers and high-performance computing customers. The IFS segment refers to full stack solutions created from the foundry industry ecosystem. The All Other segment represents results from other non-reportable segments and corporate-related charges. The company was founded by Robert Norton Noyce and Gordon Earle Moore on July 18, 1968, and is headquartered in Santa Clara, CA.
Related stocks

INTC Long Swing Setup – Break & Retest of Key ResistanceWe’re watching Intel NASDAQ:INTC for a clean break and retest of the $23.50 resistance level. A confirmed flip of this zone into support would signal trend strength and trigger a long spot entry.
📌 Trade Setup:
• Entry Zone: Around $23.50 (after confirmation as support)
• Take Profit Targets:
o
Intel for 25% gain in 4-5 Month as per the history and market cycle this stock should more 20-25% up within 4-5 month.

INTC Swing Complete.I wanted to test out some simple no-BS indicators on a swing trade. I ended up using the MACD cross and Overbought/Oversold indicators. I'd say it was pretty successful. The I had a support/resistance line (yellow) and would have been better off selling when it crept near that $24 area. That being s

Short term catch INTEL rebound
Support seen at recent severe fall since 5 Aug 2024
Short term target 1 $22.00-24.00
Mid term target 2 $29.00-32.00
Support seen at $18.00
Divergence of RSI shows a collection period is forming

Intel is also in a Reverse Cup and Handle Pattern from Weeklyintel is making a reverse cup and handle pattern from the weekly chart due to this it is a bearish pattern.
Disclaimer - chart is for education purpose only


Intel is upward bound. Good accumulation levelIntel is upward bound. Good accumulation level.
Trade with your analysis not mine and use Stop loss.


INTC #IntelIntel has been range boune between 20-70 which is very wide.
It may try to give bear a dead cat bounce only later it would be decided whether it may fall further of look for newer high. But time is bit far as 44$ is a supply area for bulls.

See all ideas
Summarizing what the indicators are suggesting.
Neutral
SellBuy
Strong sellStrong buy
Strong sellSellNeutralBuyStrong buy
Neutral
SellBuy
Strong sellStrong buy
Strong sellSellNeutralBuyStrong buy
Neutral
SellBuy
Strong sellStrong buy
Strong sellSellNeutralBuyStrong buy
An aggregate view of professional's ratings.
Neutral
SellBuy
Strong sellStrong buy
Strong sellSellNeutralBuyStrong buy
Neutral
SellBuy
Strong sellStrong buy
Strong sellSellNeutralBuyStrong buy
Neutral
SellBuy
Strong sellStrong buy
Strong sellSellNeutralBuyStrong buy
Displays a symbol's price movements over previous years to identify recurring trends.
US458140CD0
Intel Corporation 4.875% 10-FEB-2026Yield to maturity
10.65%
Maturity date
Feb 10, 2026
US458140CK4
Intel Corporation 5.9% 10-FEB-2063Yield to maturity
6.23%
Maturity date
Feb 10, 2063
INTC5456467
Intel Corporation 5.05% 05-AUG-2062Yield to maturity
6.23%
Maturity date
Aug 5, 2062
INTC4969550
Intel Corporation 4.95% 25-MAR-2060Yield to maturity
6.15%
Maturity date
Mar 25, 2060
US458140CJ7
Intel Corporation 5.7% 10-FEB-2053Yield to maturity
6.15%
Maturity date
Feb 10, 2053
INTC5238071
Intel Corporation 3.2% 12-AUG-2061Yield to maturity
6.11%
Maturity date
Aug 12, 2061
US458140AY6
Intel Corporation 4.1% 11-MAY-2047Yield to maturity
6.11%
Maturity date
May 11, 2047
US458140AV2
Intel Corporation 4.1% 19-MAY-2046Yield to maturity
6.10%
Maturity date
May 19, 2046
INTC5456466
Intel Corporation 4.9% 05-AUG-2052Yield to maturity
6.09%
Maturity date
Aug 5, 2052
INTC4969549
Intel Corporation 4.75% 25-MAR-2050Yield to maturity
6.09%
Maturity date
Mar 25, 2050
INTC5755564
Intel Corporation 5.6% 21-FEB-2054Yield to maturity
6.08%
Maturity date
Feb 21, 2054
See all INTCCL bonds
Frequently Asked Questions
The current price of INTCCL is 43,100 CLP — it hasn't changed in the past 24 hours. Watch Intel Corporation stock price performance more closely on the chart.
Depending on the exchange, the stock ticker may vary. For instance, on BCS exchange Intel Corporation stocks are traded under the ticker INTCCL.
INTCCL stock has risen by 0.23% compared to the previous week, the month change is a 30.08% rise, over the last year Intel Corporation has showed a 118.12% increase.
We've gathered analysts' opinions on Intel Corporation future price: according to them, INTCCL price has a max estimate of 131,578.95 CLP and a min estimate of 26,315.79 CLP. Watch INTCCL chart and read a more detailed Intel Corporation stock forecast: see what analysts think of Intel Corporation and suggest that you do with its stocks.
INTCCL reached its all-time high on Dec 11, 2024 with the price of 1,000,000 CLP, and its all-time low was 17,850 CLP and was reached on Sep 6, 2024. View more price dynamics on INTCCL chart.
See other stocks reaching their highest and lowest prices.
See other stocks reaching their highest and lowest prices.
INTCCL stock is 8.58% volatile and has beta coefficient of 1.34. Track Intel Corporation stock price on the chart and check out the list of the most volatile stocks — is Intel Corporation there?
Today Intel Corporation has the market capitalization of 212.07 T, it has decreased by −20.49% over the last week.
Yes, you can track Intel Corporation financials in yearly and quarterly reports right on TradingView.
Intel Corporation is going to release the next earnings report on Apr 23, 2026. Keep track of upcoming events with our Earnings Calendar.
INTCCL earnings for the last quarter are 135.62 CLP per share, whereas the estimation was 73.56 CLP resulting in a 84.37% surprise. The estimated earnings for the next quarter are 10.18 CLP per share. See more details about Intel Corporation earnings.
Intel Corporation revenue for the last quarter amounts to 12.36 T CLP, despite the estimated figure of 12.15 T CLP. In the next quarter, revenue is expected to reach 10.61 T CLP.
INTCCL net income for the last quarter is −534.36 B CLP, while the quarter before that showed 3.92 T CLP of net income which accounts for −113.63% change. Track more Intel Corporation financial stats to get the full picture.
Yes, INTCCL dividends are paid quarterly. The last dividend per share was 118.48 CLP. As of today, Dividend Yield (TTM)% is 0.00%. Tracking Intel Corporation dividends might help you take more informed decisions.
As of Feb 4, 2026, the company has 85.1 K employees. See our rating of the largest employees — is Intel Corporation on this list?
EBITDA measures a company's operating performance, its growth signifies an improvement in the efficiency of a company. Intel Corporation EBITDA is 10.56 T CLP, and current EBITDA margin is 22.10%. See more stats in Intel Corporation financial statements.
Like other stocks, INTCCL shares are traded on stock exchanges, e.g. Nasdaq, Nyse, Euronext, and the easiest way to buy them is through an online stock broker. To do this, you need to open an account and follow a broker's procedures, then start trading. You can trade Intel Corporation stock right from TradingView charts — choose your broker and connect to your account.
Investing in stocks requires a comprehensive research: you should carefully study all the available data, e.g. company's financials, related news, and its technical analysis. So Intel Corporation technincal analysis shows the buy rating today, and its 1 week rating is buy. Since market conditions are prone to changes, it's worth looking a bit further into the future — according to the 1 month rating Intel Corporation stock shows the buy signal. See more of Intel Corporation technicals for a more comprehensive analysis.
If you're still not sure, try looking for inspiration in our curated watchlists.
If you're still not sure, try looking for inspiration in our curated watchlists.