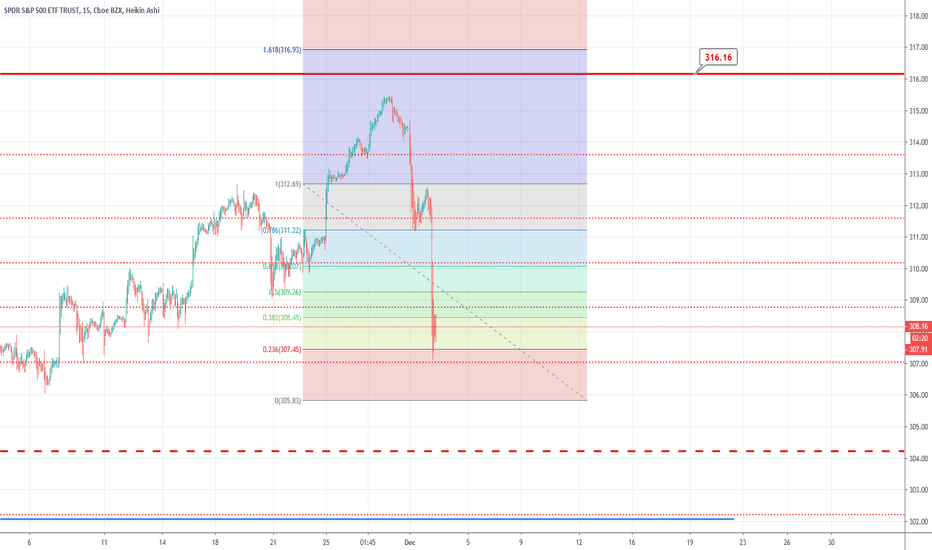
SPY trade ideas
Midweek Watch 8/18 - $SPY / $QQQ LONGIm just looking for pullbacks into levels giving us a buying opportunity. I'm hoping if the $SPY could come into this 50D SMA. $QQQ also came in a little bit, coming right into the MP and let's see if it can pullback into this 50D SMA.
I do love the fact markets pulled back and really hope it continues to drop a day or two and sets up a really great opportunity for us.
Stocks vs Bonds & Copper vs Gold - Bounty for Global equitiesFellow Bountyhunters,
Two charts that tell us what can happen to the global equities is posted here.
Chart on left is the relative ratio of Stocks vs Bonds. One can see PRICE ACTION rising to the north after bottoming and testing some resistance as of now. If they breakout then we have a continuation and and this can possibly indicate continuation of the rise in equity markets.
Chart on right indicates the relative ratio of Copper vs Gold (Miners). Copper moving North is bullish for equities and it usually is a leading indicator of global economic health and this chart shows the relative ratio against Gold which is considered a safe heaven asset. Price action has bounced off of previous low but made a lower low and now making higher highs on its way to the North. If this continues we can expect a gala time with global equities.
Gold and copper tends to move in the same direction (Observe on multi year charts), but copper is more volatile unlike Gold and likely to react to fundamentals more quickly than gold.
This is an observation from my analysis of multi year charts and one must use this as a supporting information to increase allocation(IF) to equities vis a vis other asset classes.
Gap up Trading - How to Trade the Gaps - Part 1Om Namah Shivay
Brothers, Let us discuss on "How to Trade the Gaps" - ( part 1 )
During the trade progression, many gaps happen. There is no hard and first rule to restict them based on count, or based on where gap can happen / where it can not happen.
There is nothing like that. Gaps can happen anywhere during the trend.
Say we want to categorize them, then they can be categorized as 3 types
1. Break Away Gaps - these happen during the initial stage of the trend. ( Check image )
There can be 1/2 Gaps which give thurst to the new trend direction. Again to say - In Market gaps may happen daily. We may not say that there is only one gap which is the type 1 gap. Just we can categorize them that they are the starting gap ups, so are break away gaps. They can be 1 / 2.
2. Measuring Gaps - these happen during the middle stage of the trend ( Check image )
There can be many measuring gaps. Gaps Can be happen daily too. They are told as Run Away Gaps too. They give additinal thurst to the Trend.
3. Exhaustation Gap - these happen during the end stage of the trend. ( Check image )
( showing low volume ? slowing down impulsive move ? we will check in part 2)
Then ? Just Exhaustation gap came so trend is not going to end. Trend continues. May be another trend which adds to initial one. And other possibilities.
This is part 1 of the series. We will learn more in part 2 base on reader likes.
Om Namah Shivay


