Weekly plan for DXYNotes
1. DXY can push higher if it is trading above 100.157 and protecting the FVG at 99.972 and a day
close above 100.700 will gave more confirmations to the uptrend
2. Upside target can be 100.913 & 101.267
3. If it fails to trade above 100.157 and protecting the FVG at 99.972 a price drop can happen
till 98.880 levels
Trade ideas

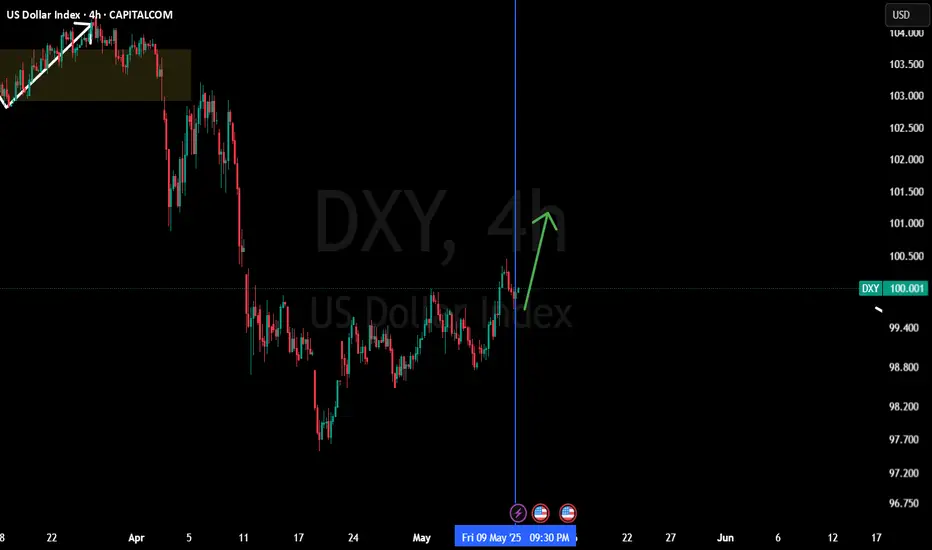
DXY Weekly analysis (10-05-25 to - 17-05-25)📊 Technical Analysis (4H Chart - DXY)
Current price is around 100.00. The chart shows a clear higher low near 99.00, followed by a strong bullish reversal, marked by engulfing candles and momentum to the upside.
Key Technical Observations:
Support Zone: 99.00 – 99.30, a strong demand zone where the recent reversal began.
Resistance Zones:
Minor: 100.50 – 100.80
Major: 101.50 – 102.00, previous structural breakdown area.
The structure suggests a bullish recovery wave is forming after a long downtrend. A confirmed breakout above 100.50 could trigger further upside.
Short-term momentum favors buyers, indicating potential continuation.
🟢 Bullish bias remains valid as long as price holds above 99.50.
🌍 Fundamental Outlook for the Week (13–17 May 2025)
🏦 1. Fed Policy Stance
The Fed is staying data-dependent, holding off on rate cuts due to persistent inflation. Recent CPI and labor market strength have led markets to delay pricing in any rate cut. This continues to support USD strength in the short term.
📈 2. Key US Data to Watch
CPI (May 15, Wed): A hot print could trigger a DXY breakout above key resistance.
Retail Sales (May 16, Thu): Strong consumer data could reinforce the Fed’s hawkish stance.
Jobless Claims: Still at historically low levels, signaling a tight labor market and reinforcing policy caution.
💹 3. Geopolitics and Risk Sentiment
Any global risk-off tone—especially related to China or the Middle East—could trigger safe-haven flows into the dollar. Rising US yields, driven by fiscal concerns and rate expectations, continue to offer support.
✅ Conclusion
Outlook is bullish for DXY next week if price sustains above 99.50. CPI is the major trigger—a hotter-than-expected inflation print could push price through 100.80 toward 101.50+. However, if data disappoints or dovish tones emerge from Fed speakers, DXY may reject from resistance and retest 99.80.
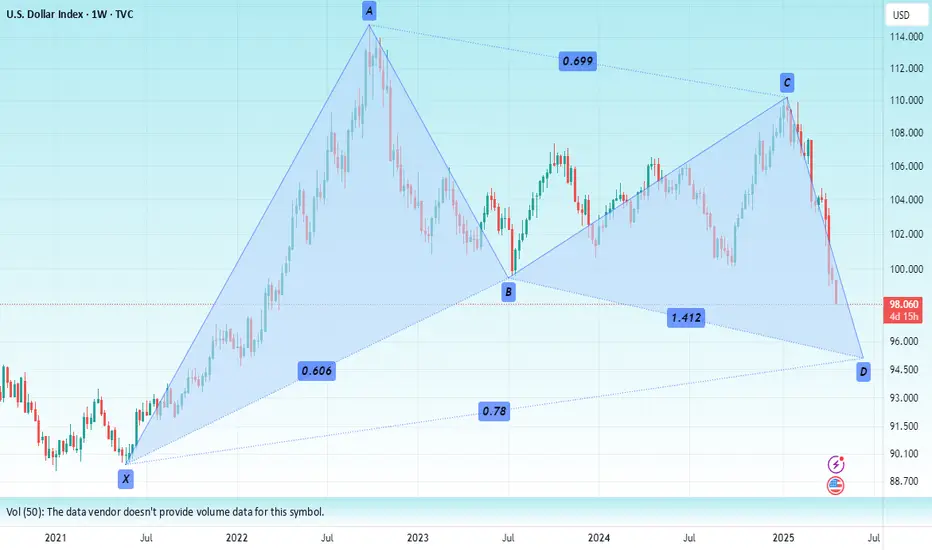
DXY - BULLISH Rocket blast ahead- Off to 122-125 rangeDXY in Weekly time frame.
Lovely correction has likely ended. It was a ABC Correction with a Triangle correction in B though not a regular one. C Impulse seems complete.
Let Dollar Index now go to 122-125 range.
Those shouting Dollar crash will be screwed
Regards
THE KING TRADER

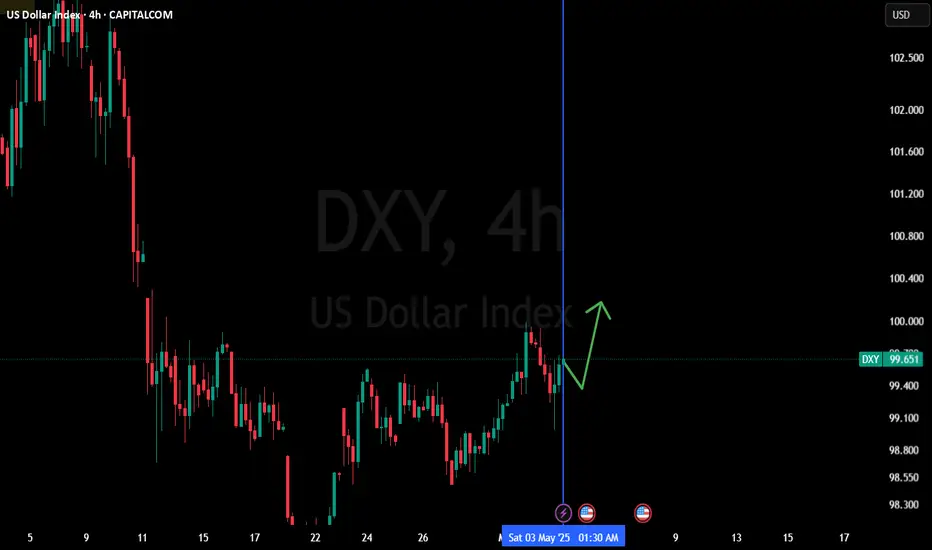
DXY Weekly analysis (04-05-25 to - 10-05-25)🟩 DXY (US Dollar Index)
Move: DXY fell early due to weak inflation and growth, then bounced up on strong job data.
Reason: Market expected Fed to cut rates soon → dollar dropped.
But strong NFP shifted sentiment → Fed may hold off on cuts.
Next Week: If CPI and Fed comments stay hawkish, DXY likely continues higher.
DXY (U.S. Dollar Index) Swing Trading AnalysisTechnical Overview
Trend:
DXY recently reversed from a downtrend and is now showing signs of a bullish recovery, forming higher lows and higher highs.
Current Price:
100.036
Moving Averages:
Price is trading above both short-term and medium-term EMAs, indicating bullish momentum.
Support Zone:
99.450–99.870 (highlighted box below current price; previous consolidation and EMA cluster)
Resistance/Target Zone:
103.000–103.100 (major resistance, aligns with your green target area)
Stop Loss Area:
97.859 (below recent swing low and the lower edge of your red risk box)
Risk/Reward:
The setup shows a risk/reward ratio of about 1.5:1, with a wide upside target and a logical stop below support.
Indicators
RSI (Relative Strength Index):
Currently at 55.08, trending higher but not yet overbought, suggesting there’s room for further upside.
MACD:
Bullish crossover with histogram above zero, supporting the bullish bias.
Trade Plan
Bias:
Bullish (Long)
Entry:
Current price (100.036) or on a minor pullback to the support zone (99.870–99.450).
Stop Loss:
Below 97.859 (to protect against a deeper correction).
Take Profit:
103.000–103.100 (major resistance zone).
Risk Management:
Risk only 1–2% of your trading capital per trade.
Professional Insights
Price Action:
The recent breakout above the moving averages and a successful retest of the support zone confirm bullish intent.
Confirmation:
A strong hourly close above 100.250 would further validate the bullish swing setup.
Confluence:
Bullish momentum is supported by both RSI and MACD, and the risk/reward is favorable for a swing trade.
Fundamental Consideration:
Watch for upcoming U.S. economic data (NFP, CPI, Fed statements) as these can drive DXY volatility.
Summary Table
Direction Entry Zone Stop Loss Target Zone Rationale
Long 99.870–100.036 97.859 103.000–103.100 Bullish breakout, strong momentum, support
How This Relates to EUR/USD
Inverse Correlation:
If DXY rallies, EUR/USD is likely to fall. This supports a bearish swing trade setup in EUR/USD as discussed earlier.
Conclusion
DXY is in a bullish swing setup with a favorable risk/reward profile.
Enter long on pullbacks or confirmation above 100.250.
Manage risk with a stop below 97.859 and target 103.000+.
Watch for fundamental catalysts that could impact the dollar’s direction.
If you need live updates or want to compare with other indices or pairs, let me know!

"Plan the Short: DXY Targeting 98.004 "2. Current Price:
Around 99.587 💵
3. Indicators:
EMA 70 (Exponential Moving Average) ➡️ 99.442 📈
Price is dancing around the EMA, meaning trend is a bit bullish for now.
4. Chart Pattern:
Price moving inside an ascending channel 📈➰
Bouncing between channel support and resistance levels ⚡
5. Trading Plan:
Wait for price to reach the blue resistance zone ⬛ (around 100.5 to 100.9)
Look for sell (short) signals after reaching there ⛔
Expecting a reversal and drop down to target 98.004 🎯
6. Stop Loss & Target:
STOP LOSS: 🔴 100.870 (above resistance zone)
TARGET: 🎯 98.004
7. Key Observations:
Current Trend: Short-term bullish 📈 inside channel
Expected Move: Reach blue box ➡️ sell ➡️ fall toward 98.004 📉
News Events: Upcoming 📅🔔 (could create volatility)
Summary:
* 📈 Uptrend inside a channel.
* ⬛ Wait for price to hit the blue zone (100.5–100.9).
* ⛔ Look for short signals in the zone.
* 🔴 Stop Loss: 100.870.
* 🎯 Target: 98.004.
* ⚡ Watch out for news events that can move the market!

"DXY Bearish Setup: Sell from SBR Zone with Target at 97.800"1. Trendline Support Break:
🟡🟡🟡🟡
These yellow dots mark previous higher lows on the ascending trendline — now broken, hinting at a possible bearish reversal.
2. EMA (7):
🟠 ➖
This orange line is the 7-period EMA, hovering above the price, showing bearish momentum in the short term.
3. SBR + DBD Zone (Sell Zone):
🔵 SBR/DBD Zone
📍 Entry Point: 99.880
❌ Stoploss: 100.390
This blue zone is a Sell on Rally area. The chart suggests price might revisit this zone and then face rejection.
4. Price Projection Path:
↗️🔁📉
A potential retest of resistance followed by a strong drop is projected. The zigzag line drawn shows the expected movement.
5. Target Point:
🎯 Target: 97.800
📉 Expected drop of 2.04% from entry.
This is the price where the trade aims to take profit.
6. Summary:
🔽 Bearish Bias
🎯 Sell near 99.880
❌ SL at 100.390
✅ TP at 97.800

Dollar IndexHello & welcome to this analysis
Current decline in DXY could still continue all the way till 95 where it has a Bullish Harmonic Gartley.
At the current moment big resistance at 99-100, only above that a move towards 101.50 & then 1003
DXY Dollar Index - Weakly Technical (21 To 26 Apr-2025)TVC:DXY
The U.S. Dollar Index #DXY technical analysis for today, April 19, 2025, based on available information, suggests a bearish outlook in the near term. Here's a concise breakdown:
#ChartPatterns for your reference

EMA 30 (Red Line): Currently at 99.700 — tracks short-term trendEMA 30 (Red Line): Currently at 99.700 — tracks short-term trend, and price is hovering near this level.
EMA 200 (Blue Line): At 100.935 — indicates long-term trend, acting as dynamic resistance above.
📈 Trade Setup
✅ Entry Point:
Price: 99.699
Rationale: This level has been tested multiple times, forming a support zone. A bounce here signals a potential long entry.
🎯 Target Point (Take Profit):
Price: 102.738
Distance: ~3.04 points or 3.43% potential move upward.
Note: Marked as EA TARGET POINT, which suggests a calculated area possibly based on previous resistance or algorithmic strategy.
🛑 Stop Loss:
Price: 98.624
Reasoning: Just below the defined support zone (highlighted purple area), ensuring protection against downside breakouts.
📊 Risk-to-Reward Ratio
Entry: 99.699
Target: 102.738 → Gain of ~3.04
Stop: 98.624 → Risk of ~1.08
R/R Ratio: ~2.8:1 — favorable setup
📌 Overall Sentiment
This chart indicates a bullish reversal setup from a strong support zone, possibly targeting a mean reversion or trend reversal toward the 200 EMA and beyond.
However, keep in mind:
The price is currently below both EMAs, so the trend is still bearish.
The trade is counter-trend, relying on support holding and momentum shifting.

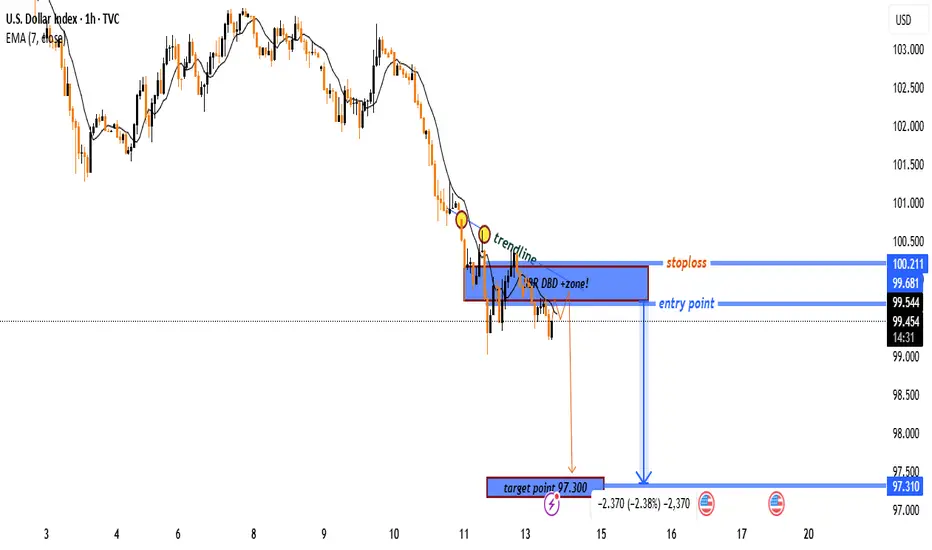
"USD Index Short Setup – Bearish Rejection from Supply Zone (DBD📉 Downtrend confirmed
➖ Lower highs and lower lows
➖ EMA (7) is sloping downward and acting as resistance
➖ Bearish momentum continues
Key Zones & Levels
🔵 Supply Zone (DBD)
🔹 Zone: 99.540 – 99.681
🔹 Label: “Drop-Base-Drop”
🔹 This is where sellers stepped in before – price is retesting it
🔹 Expecting a rejection from this area.
Trade Setup
📍 Entry Point:
🔹 Enter short around 99.540 – 99.681
❌ Stop Loss:
🔺 Set above the zone at 100.211
🚫 Protects against fakeouts
🎯 Target Point:
🔻 Target at 97.300
💰 Risk-Reward: 1:2.4 (Good!)
Visual Summary
📍 Entry: 99.540
❌ Stop Loss: 100.211
🎯 Target: 97.300
📉 Overall Bias: Bearish
✅ Strong RR setup with trend confirmation
DXY finds the support at $99.DXY will be finding the support at the current levels at around $99.
From here prices can go up till $100-$101
If the price breaks down this support of 99 it will continue the fall till $97.5sh to $97zone.

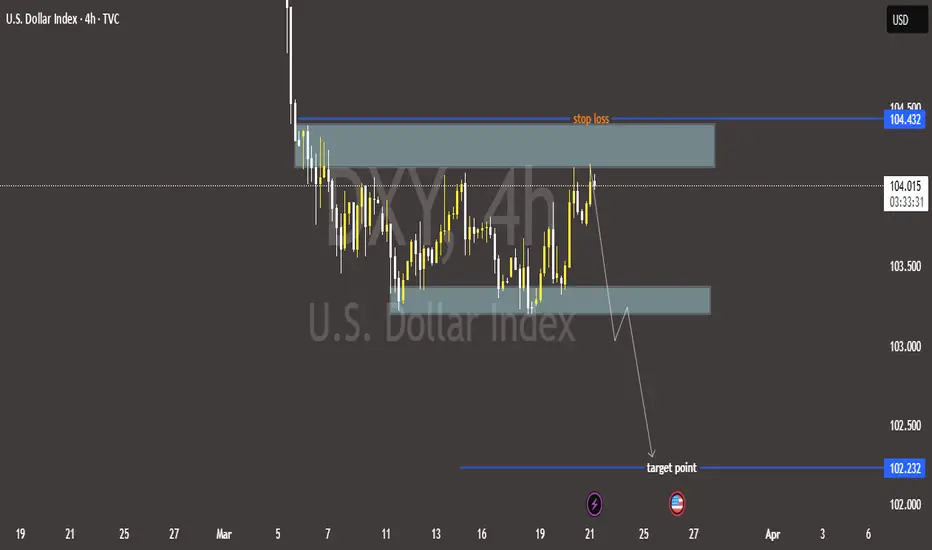
US DOLLARTo confirm my EU view, here is DXY.
The buy zone didn’t hold—price broke through, sustained below, and established a strong new trading range. It just reacted off the 4H sell zone, confirming weakness. Now, all eyes on DXY for a sell-off.
With that being said, fundamentals are heavy this week, so keeping risk in check is key.
Blessings, T
DXY Building Momentum — "Cash is King" Narrative Returns?📌 DXY is showing clear signs of recovery on the H4 timeframe — and that tells us something deeper: risk sentiment is shifting. Investors are pulling capital from risk-on assets and moving to cash. Yes, "Cash is King" might be making a comeback.
🔍 What’s Driving the Move?
As fear ripples through global markets:
📉 Equities are shaky.
🟡 Gold dropped sharply under profit-taking pressure.
🪙 Crypto lacks new capital.
Now, capital is rotating back into USD — not necessarily because of strong fundamentals, but due to defensive positioning.
🔺 On the geopolitical side, Trump’s aggressive tariff threats are shaking confidence. As import/export tension rises, the global appetite for USD-denominated assets (especially U.S. bonds) is also climbing.
🧭 Key Technical Levels (4H Chart)
Support Zones:
🟦 101.467 – historical structure low
🟦 102.113 – minor intraday demand
🟦 102.660 – neckline & retest zone (key area to hold)
Resistance Zones:
🟧 103.803 – consolidation top
🟥 104.506 – key resistance and EMA crossover zone
🟥 105.632 / 106.157 / 106.622 – higher-timeframe targets if momentum continues
🔮 Outlook by AD | Money Market Flow
The market is on the edge right now.
If U.S. equities fail to bounce and global risk sentiment continues to deteriorate, we could see: ✅ A strong USD breakout ✅ DXY bottoming and reclaiming the 104–106 zone ✅ Major asset correction across risk-on markets (Gold, Stocks, Crypto)
“When markets panic, smart money rotates to USD. It’s not bullishness — it’s protection.”
— AD | Money Market Flow
🔁 What to Watch:
Fed’s next steps (Will they ignore Trump’s tariffs and focus on growth?)
Global equity market reactions
Bond yields (demand for U.S. debt could rise again)
📌 Stay sharp and follow the money. DXY is giving early signals — don’t ignore the shift.
🧠 Manage risk. Protect capital. Let the market come to you.

U.S. Dollar Index (DXY) –Key Resistance& Bearish Target Analysis📊 Key Observations:
🔵 Resistance Zone (📍~103.5 Level)
A strong resistance area (🔵 blue box) is marked, indicating potential selling pressure if the price reaches this level.
The price is moving upwards (📈) towards this resistance, so watch for rejection or breakout.
🔵 Support/Target Zone (📍~101.5 Level)
A lower support zone (🔵 blue box) is marked as the bearish target 🎯.
If the price fails at resistance, it may head downwards (📉) to this level.
📉 Recent Price Action:
🚀 Sharp drop followed by a rebound (📈).
The price is currently moving back up (🔼), possibly forming a lower high before another drop.
📌 Exponential Moving Average (DEMA 9 - 102.488)
The price is hovering above the 9-period DEMA (📏), showing short-term bullish momentum.
If the price rejects resistance and falls below the DEMA, a bearish continuation (📉) is likely.
🚀 Potential Scenarios:
✅ Bullish Breakout: If price breaks above 🔵 resistance, it may continue rising (📈) to higher levels.
❌ Bearish Rejection: If price fails at resistance, expect a drop (📉) towards 101.5 🎯.

DXY analysisas of right now DXY just broke structure to downside. so expecting bearish. if it breaks upward structure we may see buys in

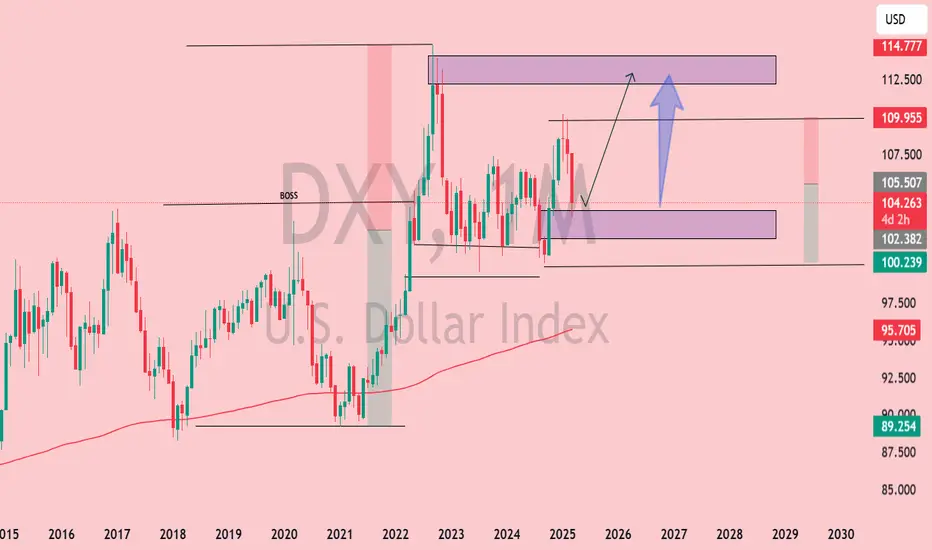
DXY Monthly Analysis: Key Support Holding, Bullish Move Ahead?📊 DXY Monthly Chart Analysis (March 27, 2025)
Key Observations:
Current Price Action:
The U.S. Dollar Index (DXY) is trading near 104.267, with notable resistance ahead.
Price is consolidating within a key demand zone (~102.5–104) after rejecting higher levels.
Technical Levels:
Support Zone: 100.2–104 (Highlighted in purple)
Resistance Zone: 112.5–114.7 (Highlighted in purple)
Major Resistance: 114.77 (Previous high, acting as a supply zone)
200-MA Support: Located below current price, offering a long-term bullish confluence.
Market Structure:
Price remains in a higher time-frame bullish trend but is experiencing a correction.
The "BOSS" level (Break of Structure) suggests a prior bullish breakout.
If the demand zone holds, a bullish continuation towards 112.5–114.7 is possible.
Projected Move:
A bounce from 102–104 could trigger a rally toward the upper resistance zone (~112.5).
A break below 100.2 could indicate a shift in trend and further downside.
Conclusion:
DXY is at a critical decision point. Holding the current support zone (~102–104) could fuel a bullish continuation toward 112–114, while a breakdown below 100.2 would weaken bullish momentum.
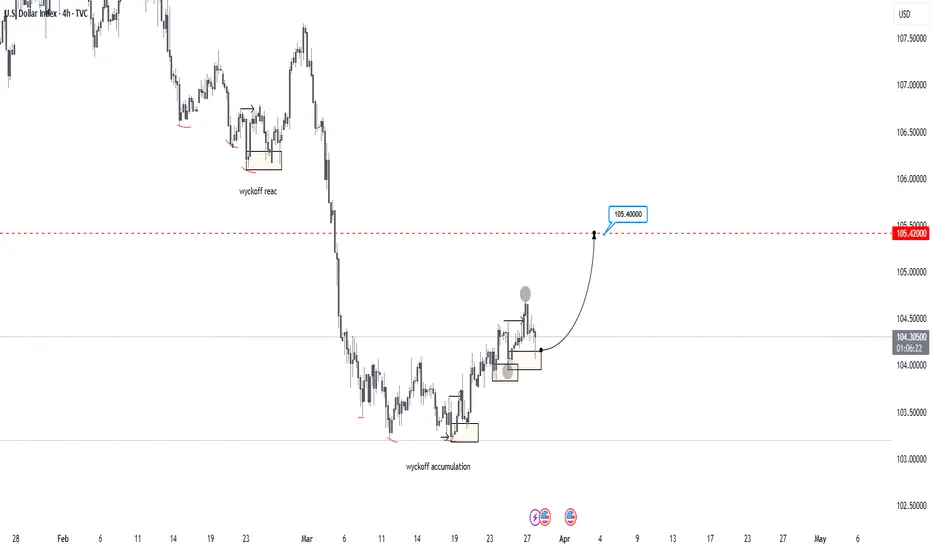
BULLISH ON US DOLLAR!As you can see on the chart, I am bullish on DXY. If you look at it from a technical perspective, you can see that after the accumulation schematic was complete, the dollar started gaining value. Price now needs to enter the markup phase. Looking at the current structure, price has formed a new trading range while breaking the high/structure to the left. A sharp reaction from that zone is a good sign. If the 4H candle closes bullish like this, it could be a strong indicator of bullish momentum building. Let's see. Overall, a pretty straightforward read.
Blessings, T
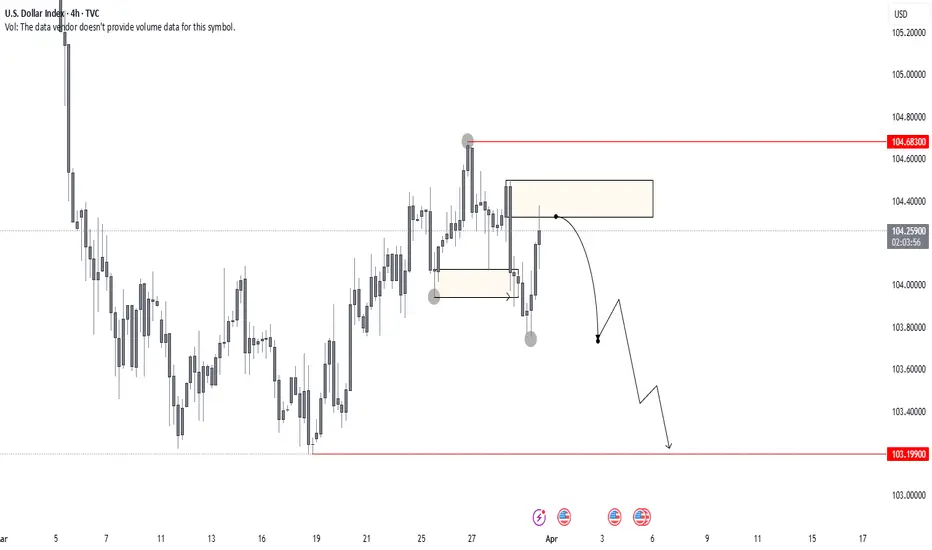
U.S. Dollar Index (DXY) – Bearish Outlook with Key Levels📉 Bearish Bias on U.S. Dollar Index (DXY) – 4H Chart
🔹 Resistance Zone & Stop Loss 🚫
📍 Resistance: 104.200 - 104.432
🛑 Stop Loss: 104.432 (Above resistance zone)
🔸 Support Zone 🛠️
📍 Intermediate Support: 103.300 (Possible bounce)
🔻 Target Point 🎯
📍 Target Price: 102.232 (Expected downside)
📊 Price Action Outlook:
✅ Bearish Scenario:
Price rejected from resistance 🔽
Lower highs forming ⚡
Breakdown expected toward 102.232 🎯
❌ Invalidation:
If price breaks above 104.432, bearish setup fails 🚫
🔥 Conclusion:
⬇️ Sell Bias below 104.200 targeting 102.232
❌ Cut losses if price closes above 104.432
US Dollar Index (DXY) – Pre-FOMC Update💥 US Dollar Index (DXY) – Pre-FOMC Update: Expert Analysis and Trading Strategies 💥
In just a few hours, the Federal Reserve (Fed) will announce its interest rate decision and update its economic projections in the Summary of Economic Projections (SEP). This is a highly anticipated event that will shape trading decisions in the coming weeks. The US Dollar Index (DXY) is currently fluctuating within the 103.00 - 104.00 range, reflecting investor caution ahead of the critical updates.
1. Interest Rate Decision and Its Impact on DXY
The policy rate is expected to remain unchanged at 4.25% - 4.50%. However, the market is more focused on signals about future rate cuts, particularly in 2025.
Chair Jerome Powell's post-meeting speech will be the key driver. The market will closely watch for hints on monetary policy, inflation, and the US economic outlook.
If the Fed adopts a hawkish tone (indicating sustained high rates or even further hikes), the DXY could rally strongly. Conversely, a dovish signal could weaken the USD.
2. Technical Analysis of DXY
🔴 Key Support: 103.18
The DXY is currently under pressure at the 103.18 support level. A break below this level could push the index further down to 103.00 or even 102.50.
This is a crucial zone, as failure to hold here would signal continued USD weakness in the short term.
🟢 Major Resistance: 105.00 and 105.57
If the DXY rebounds from current support levels, the next challenges will be the resistance zones at 105.00 and 105.57.
The 50-day and 200-day Moving Averages (MA) on the daily chart are also key indicators to watch. A break above these MAs could reinforce the bullish trend.
📉 Short-Term Trend:
On the 4H chart, the DXY is in a downtrend, with lower highs and lower lows. However, upcoming macroeconomic factors (the rate decision and Powell’s speech) could trigger a reversal or increased volatility.
Technical indicators like the RSI and MACD are in neutral territory, suggesting the market is awaiting clearer signals.
3. Trading Strategy Before and After the FOMC Decision
🔍 Before the Fed Announcement:
Caution is key. The market may experience mild fluctuations during the wait. Traders should avoid large positions and wait for clearer signals.
Closely monitor key support and resistance levels: 103.18 (support) and 105.00 (resistance).
🔥 After the Fed Announcement:
Scenario 1: Fed Holds Rates and Signals Hawkish Tone
The DXY could rally strongly, targeting resistance levels at 105.00 and 105.57.
Strategy: Look for buy opportunities when the DXY bounces off support or breaks above resistance.
Scenario 2: Fed Signals a Dovish Tone
The DXY could drop sharply, breaking below 103.18 and heading toward 102.50.
Strategy: Look for sell opportunities when the DXY breaks support or fails to surpass resistance.
Scenario 3: Fed Holds Rates Without Clear Signals
The DXY may continue to fluctuate within the 103.00 - 104.00 range.
Strategy: Trade within the range, using identified support and resistance levels.
4. Advice for Investors and Traders
📊 Risk management: Always set appropriate stop-loss and take-profit levels to protect your capital. Post-FOMC volatility can be intense, so prepare mentally and have a solid trading plan.
📰 Stay updated: Keep a close eye on Fed updates and market reactions. Jerome Powell’s speech could create significant trading opportunities.
🛠️ Use technical tools: Combine indicators like RSI, MACD, and Fibonacci to identify precise entry points.
5. Conclusion
Tonight’s FOMC meeting will be a decisive factor for the DXY’s short-term direction. With clear support and resistance levels identified, traders should prepare their strategies to capitalize on market movements.
🚨 Stay tuned for the latest updates on TradingView to ensure you don’t miss any trading opportunities!
Wishing you successful trades and profitable outcomes! 💪💰

DXY (U.S. Dollar Index) Bearish Trade Setup – Potential DowntrenThis chart is a technical analysis of the U.S. Dollar Index (DXY) on a 1-hour timeframe. Here's a breakdown of the analysis:
🔹 Chart Overview:
DXY Price: 103.773
Trend: The price has been in an uptrend, but there's a potential for reversal.
Entry Point: 103.816
Stop Loss: 104.096 (Marked in red)
Take Profit (TP) Levels:
TP1: 103.608
TP2: 103.400
Next Target: 103.133
🔹 Analysis:
Trendline Break: The price had been following an ascending trendline, which appears to be broken. This suggests a potential downtrend continuation.
Bearish Setup: The trade setup suggests a short (sell) position.
Risk-Reward Ratio:
The stop loss (104.096) is placed above the recent resistance.
The take profit levels are set at key support zones.
Market Sentiment: If the price stays below 103.816, it may continue dropping toward TP1, TP2, and the Next Target.
🔹 Conclusion:
Bearish Bias 📉: The market could see further downside if the price stays below the entry point.
Trade Idea: Short below 103.816, with a stop at 104.096, and targets at 103.608, 103.400, and 103.133.

USD PLUNGES – IS THIS THE START OF A VOLATILE YEAR?📌 MARKET OVERVIEW
The US Dollar (USD) is experiencing a sharp decline, with the DXY index dropping by 3.5% in the past week, marking its second-largest drop since the 2020 pandemic. More importantly, USD is now on a three-month losing streak, sending ripples across global financial markets.
👉 The Euro is the primary driver behind USD’s weakness, surging 4.7% against the USD, the biggest jump since 2009.
📌 DXY weakness amid escalating trade wars is a crucial signal – it indicates that major shifts are about to unfold in the financial markets!
📊 WHY IS THE USD DROPPING?
🔹 1. The Euro’s Strong Recovery
The Euro is benefiting from the European Central Bank (ECB) maintaining stable monetary policies, while the US Federal Reserve (FED) leans towards rate cuts.
This policy divergence has reduced the appeal of the USD, pushing the Euro to its highest level in over a decade.
🔹 2. Market Expectations of Fed Rate Cuts
Recent US economic data shows weaker inflation, increasing the likelihood that the FED may ease monetary policy soon.
Lower interest rates diminish the attractiveness of the USD, encouraging investors to shift capital into alternative assets like gold and the Euro.
🔹 3. Trade War & Economic Uncertainty
Tensions between the US and China continue to escalate, with Trump’s aggressive tariff policies adding to global trade instability.
However, instead of strengthening the USD, these policies are creating negative market sentiment, leading investors to pull away from USD-based assets.
📌 USD is now in a difficult position:
✔️ The FED may loosen monetary policy, weakening USD further.
✔️ The ongoing trade war is eroding confidence in the USD.
📉 HOW USD WEAKNESS AFFECTS GLOBAL MARKETS
🔸 Gold Surges as USD Declines
Gold prices rally whenever USD weakens, as investors move funds into safe-haven assets.
If USD continues to drop, gold could break its all-time high (ATH) and surge towards $2,970 - $3,000.
🔸 Stock Markets Could Benefit
Lower interest rates and a weaker USD generally support the US stock market, especially export-driven companies.
However, if recession fears intensify, investors may move towards safer investments like gold and government bonds.
🔸 Other Global Currencies May Strengthen
A weaker USD boosts major currencies like the Euro (EUR), British Pound (GBP), and Japanese Yen (JPY).
This could shift global trade dynamics, influencing economic trends in the coming months.
⚡️ CONCLUSION – IS USD IN FREE FALL?
📌 The USD’s three-month decline is a major warning sign, signaling potential shifts in global financial markets.
📌 If USD continues its downtrend, gold could hit new highs, while stocks may see increased volatility.
📌 Traders must closely monitor FED decisions on monetary policy and ongoing trade tensions between the US and China.

U.S. Job Growth Slows: Impact on USD and Indian InvestorsIn the first two months of 2025, the U.S. economy experienced a notable slowdown in job creation, as reflected in consecutive Nonfarm Payroll (NFP) reports falling short of expectations. According to the U.S. Bureau of Labor Statistics, February saw an addition of 151,000 jobs, below the anticipated 160,000, though an improvement from January's revised 125,000.
reuters.com
+1
tradingeconomics.com
+1
Impact on the U.S. Dollar Index (DXY) 📉
The consecutive underperformance in job growth has exerted pressure on the U.S. Dollar, leading to a decline in the U.S. Dollar Index (DXY), which measures the greenback against a basket of major currencies. As of March 10, 2025, the DXY stood near a four-month low at 103.59, reflecting diminished investor confidence in the U.S. economy.
reuters.com
Federal Reserve's Response 🏦
Weak labor market data often prompts the Federal Reserve to reassess its monetary policy stance. With two consecutive NFP reports missing expectations, the Fed may consider slowing the pace of interest rate hikes or even exploring economic stimulus measures to support growth and employment. However, any policy adjustments will also weigh factors such as inflation trends and overall GDP growth.
Implications for Indian Investors 🇮🇳
The U.S. labor market's performance holds significant implications for global economies, including India:
Currency Exchange Rates 💱: A weakening U.S. Dollar can lead to the appreciation of the Indian Rupee, affecting export competitiveness and import costs.
Gold Prices 🪙: Traditionally, a softer USD boosts gold prices. Indian investors, who have a cultural affinity for gold, might see increased returns on their gold investments.
m.economictimes.com
Stock Market 📈: Global equity markets, including India's, often react to U.S. economic indicators. A slowing U.S. economy might lead to cautious sentiment among Indian investors, influencing market dynamics.
Expert Insights 🧠
Economists note that while recent U.S. job data indicates a slowdown, it's essential to consider the broader economic context. Factors such as consumer spending patterns, international trade policies, and geopolitical developments play pivotal roles in shaping both U.S. and global economic landscapes.
Conclusion 📝
The recent underwhelming NFP reports serve as a cautionary signal regarding the U.S. economy's momentum. For Indian investors, staying informed about these developments is crucial, as they can influence currency valuations, commodity prices, and equity markets. A diversified investment approach, coupled with vigilance, can help navigate the potential ripple effects stemming from shifts in the U.S. economic environment.
