US30 Technical Analysis – 8th June 2025 US30 Technical Analysis – 8th June 2025
🔍 Chart Overview:
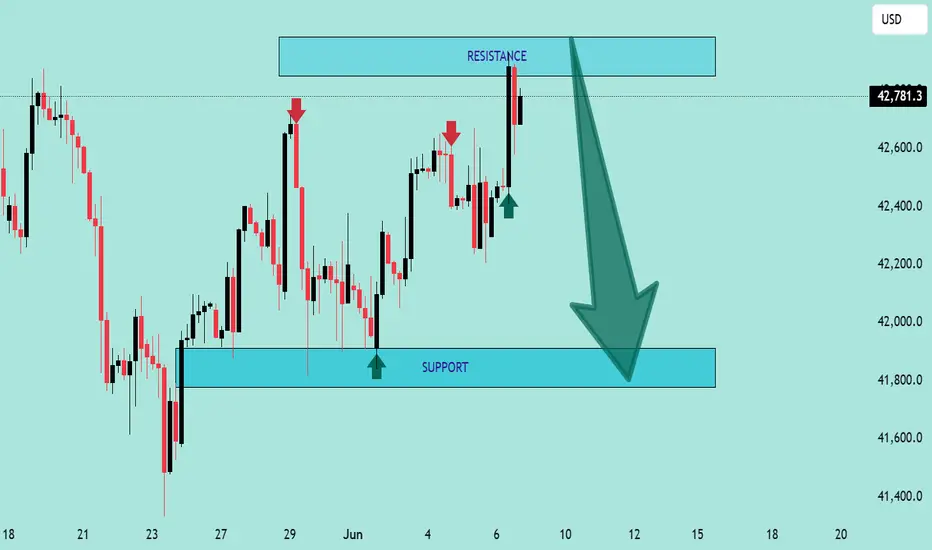
The chart shows a classic range-bound structure with clearly defined support and resistance zones.
📍 Key Zones:
🔼 Resistance Zone: ~$42,900 – $43,000
Marked by multiple rejections (🔴 red arrows).
Price has failed to close above this area convincingly.
Sellers are actively defending this level.
⚠️ Bearish pressure likely to increase if price stays below this level.
🔽 Support Zone: ~$41,750 – $41,850
Marked by strong bullish reactions (🟢 green arrows).
Buyers have stepped in consistently in this demand zone.
A breakdown below this level could trigger further downside momentum.
📈 Current Price Action:
The price is hovering around $42,781.3, just below the resistance zone.
The latest candlestick shows rejection from the top, forming a bearish wick, indicating potential reversal pressure.
The large downward arrow (⬇️) on the chart suggests a bearish bias is expected by the analyst.
📉 Outlook & Strategy:
🔻 Bearish Scenario (High Probability):
If price fails to break and sustain above $43,000, expect a move back down towards the support zone at ~$41,800.
A breakdown below support could lead to deeper downside, targeting $41,500 or lower.
🛑 Invalidation:
A clean breakout and daily close above $43,000 would invalidate the bearish setup and suggest potential continuation higher.
🎯 Trading Tips:
🔹 Short Bias: Look for short entries near resistance with tight stops above $43,000.
🔹 Target: $42,200 → $41,800
🔹 Risk Management: Always maintain a good risk-to-reward ratio and use proper stop-loss.
📌 Conclusion:
⚠️ The chart favors a bearish reversal from resistance unless bulls can push decisively above $43,000. Traders should watch for rejection patterns or breakdown confirmations to align with the bearish move.
Market insights
US30 Bearish Rejection at Resistance – Potential Drop Ahead📉 US30 Bearish Rejection at Resistance – Potential Drop Ahead 🚨
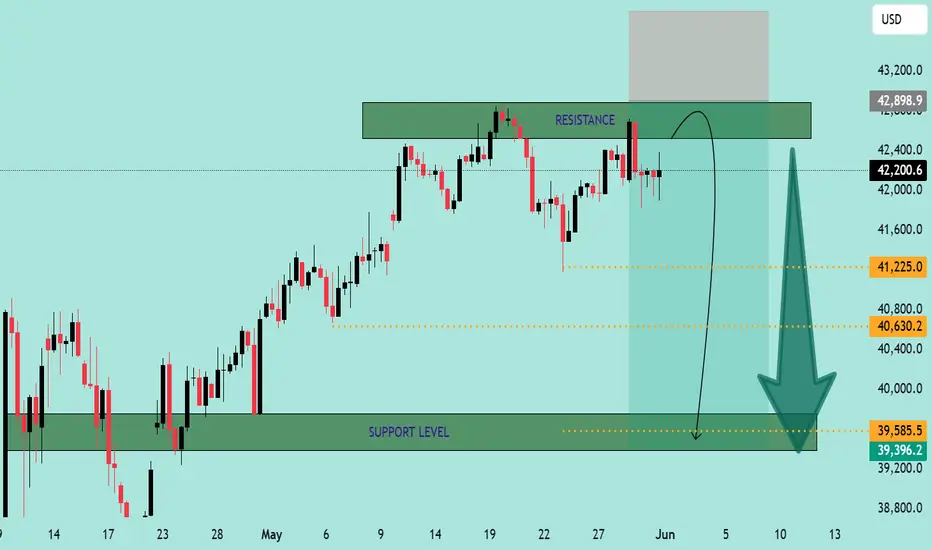
The US30 (Dow Jones Industrial Average) is exhibiting signs of bearish weakness after rejecting a strong resistance zone around 42,898.9 - 43,800.8. Here's a breakdown of the current market structure and outlook:
🔍 Technical Analysis
📌 Resistance Zone (Sell Pressure)
Price has failed to break above the marked resistance area multiple times.
Strong wicks and rejections indicate seller dominance near the top.
A short-term bounce into the resistance is anticipated before a likely reversal.
📌 Support Zone (Buy Interest)
The key support is at 39,396.2 - 39,585.5.
This zone has previously served as a strong demand area, with multiple bullish reversals in the past.
📌 Bearish Projection Path
Chart shows a potential rejection pattern playing out.
Price is expected to retest the resistance, then decline towards the support zone.
Intermediate support levels:
41,225.0
40,630.2
🔄 Outlook
🛑 Scenario A (Likely):
Price tests the upper resistance again and forms a double top or shooting star before declining toward the 39.5k support zone.
✅ Scenario B (Invalidation):
If price closes above 43,800 with strong volume, bearish bias will be invalidated, and a bullish continuation can be expected.
🧭 Trade Idea (Not Financial Advice)
🔹 Entry: Short near 42,800–43,000 (after confirmation)
🔹 Target 1: 41,225
🔹 Target 2: 40,630
🔹 Final Target: 39,585
🔹 Stop Loss: Above 43,800
Conclusion:
⚠️ The chart indicates a high-probability short setup unless bulls manage a strong breakout above resistance. Eyes on the price action near resistance for confirmation. 📉📊
us30Price action trading is a methodology where traders make decisions based on the interpretation of actual price movements on a chart, rather than relying primarily on lagging indicators. It involves observing and analyzing candlestick patterns, trend lines, support and resistance levels, and volume to identify potential trading opportunities and manage risk. The focus is on understanding the story the market is telling through its price behavior.

A buying opportunity in US30 Observations:
Trend: The market has been in a strong downtrend, as indicated by a consistent series of lower highs and lower lows.
Volume: There’s a notable spike in volume during the most recent sell-off, suggesting a possible climax or capitulation move.
Support Zone: Price appears to have bounced from a support zone between 41,745.55 and 41,855.46, shown with a shaded red/pink region.
Long Position Marked:
Entry: Around 41,914.36
Stop-Loss: Below the recent low, around 41,745.55
Take-Profit: Near 42,858.09
Risk-Reward Ratio: Very favorable (approx. 6:1 or better)
Interpretation:
This setup suggests a counter-trend long trade betting on a short-term reversal from oversold conditions. Given the:
Large volume spike (potential exhaustion of selling),
Strong support zone reaction,
Tight stop and large reward zone,
This could be a calculated risk-reward play assuming a bounce or reversal is imminent.

Dow Jones Outlook: Bullish View Holds as AI Trend BuildsMay 10, 2025 – WaveNodes AI Insight
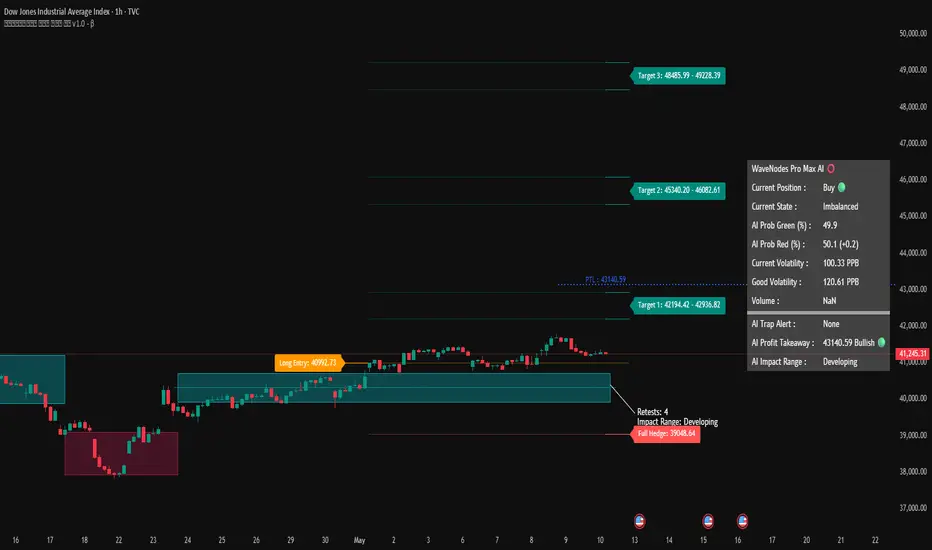
The Dow Jones Industrial Average (DJI) remains in a bullish setup, with WaveNodes Pro Max AI confirming a Buy position from the Long Entry at 40992.73. However, the index is currently in a developing phase, trading near 41,245, below the AI Profit Takeaway level of 43,140.59.
The AI metrics indicate a near-balanced scenario:
AI Prob Green: 49.9%
AI Prob Red: 50.1% (+0.2)
Current State: Imbalanced
AI Trap Alert: None
Volume: Unavailable (likely a data feed issue)
Volatility: Low but building at 100.33 PPB, compared to Good Volatility of 120.61 PPB
The price has retested the AI Impact Zone four times, which is still developing. This repeated interaction with demand suggests strong underlying support.
Targets Ahead:
Target 1: 42194.42 – 42936.82
Target 2: 45340.20 – 46082.61
Target 3: 48485.99 – 49228.39
Conclusion:
The bias remains bullish, supported by a solid demand base and long entry structure. But with AI balance still forming and low volatility, traders should exercise patience and look for confirmation via a break above AI Target 1 or fresh demand breakout before scaling in.
Dow is in inflexion zoneDJI is in inflexion zone of 50% retracement level,if it breakout from this zone and crosses 42150 zone ( 61.8%) retracement level, then it must attain the all time high or new high.

I was right about Dow📉 Chart Analysis: Dow Jones Industrial Average (DJI)
🔻 The Crash Pattern
The Dow peaked near 45,000, and that “Trumpcession” label marks what I saw as a major turning point — likely due to political or economic shifts that were brewing at the time.
After that peak, the market took a massive dive, dropping sharply to below 36,000 at the worst point.
I had drawn Fibonacci retracement levels from the low (~35,680) to the high (~45,038), and as I expected, the price sliced through all the key retracement levels:
0.236 (43,345.95)
0.382 (42,298.65)
0.5 (41,452.19)
0.618 (40,605.74)
Right now, it's hovering around 0.786 (39,400.62), which tells me the market is hanging on by a thread — support here is weak.
📍 Current Position
As I look at it, the DJI is sitting around 39,142, just below the 0.786 Fib level — not a great sign for bulls.
The RSI is still below 40, showing bearish momentum is in play, though I am starting to see early hints that it might be trying to recover.
📅 What I Saw in December 2024
Back in December 2024, I noticed the market was topping out. The signs were all there.
There was a double top formation — a textbook distribution pattern. Momentum was stalling, volume was drying up, and the RSI started showing bearish divergence.
While most were still riding the hype, I saw this setup as a clear warning — the market was exhausted and ready to correct.
🔧 Technical Breakdown
Once price started breaking down and sliced through those key Fib levels without a fight, I knew the correction was serious.
This wasn’t just a pullback — this mirrored past 20%+ corrections, and I could feel something systemic or macro-driven behind it.
The term "Trumpcession" made sense to me — policies, election concerns, rate hike fears, and geopolitical tensions were all weighing on sentiment.
✅ Why I Was Right
I based my call on:
Bearish divergence on the RSI (price making higher highs, RSI making lower highs)
Flattening trendlines
Weakening volume
Repeated failure to break resistance
And, of course, the growing political/economic uncertainty
All those factors told me a crash was not only likely — it was inevitable.
💡 What's Next (My View)
If the Dow can’t reclaim the 0.786 level (~39,400), I believe we could:
Retest 37,865
Or even see further drops to 36,000 or 35,680
On the flip side, if RSI pushes above 50 and price climbs back over 40,600, we could see a recovery rally start. But as of now, the trend remains fragile, and caution is still my base case.

Dow Jones (US30) - 1H chart Short entry**Dow Jones (US30) - 1H chart**:
---
### 📊 Trade Setup Overview:
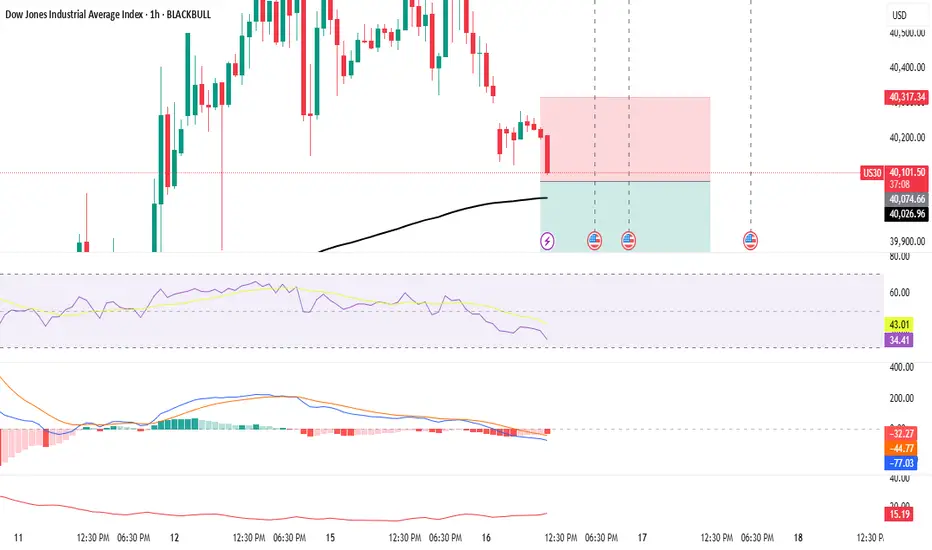
- **Entry:** Around 40,103.50
- **Stop Loss:** Near 40,207.50
- **Target Zone:** Around 39,811.68
- **Trade Type:** **Short/Sell**
---
### 🔍 Analysis:
#### ✅ Things Done Well:
1. **Clear Trend Direction:** Market has shown a consistent downtrend with lower highs and lower lows.
2. **Entry After Breakdown:** Your short entry came after a small consolidation and breakdown from a minor support area – solid decision.
3. **Stop Loss Placement:** Placed above the recent consolidation range – technically smart to avoid getting wicked out.
4. **Target:** Aiming near a recent demand zone (support) – realistic and risk-managed.
---
### 📉 Indicators Breakdown:
- **RSI:** Around 34 – nearing oversold, but still has room to go lower. Good timing for a short.
- **MACD:** Bearish crossover with momentum building to the downside. Supports your sell idea.
- **Volume:** Not a big spike, but enough to confirm continued seller interest.
---
### 🧠 Conclusion:
✅ **Yes, your trade idea is solid!**
You entered after confirmation, respected risk management, and are trading with the trend. The only thing to watch now is how price reacts near the **200 EMA** (black line). If it finds support there, consider booking partial profits.
---
### 💡 Pro Tip:
If the price bounces strongly off 39,800–39,900 zone, it may be wise to trail your stop or exit fully.
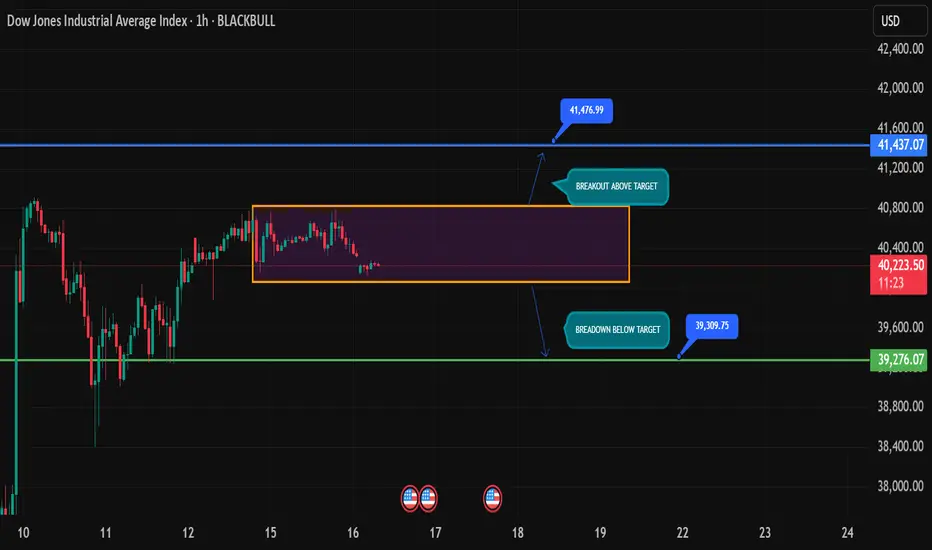
US30 Locked in Tight Range — Breakout ImminentDow Jones (US30) is currently trapped inside a tight consolidation box between ~40,400 and ~40,200. Price action has been flat for hours with no strong directional bias, hinting at an upcoming breakout move. Traders should stay alert for volatility spikes.
🔼 Breakout above the range opens up targets toward 41,437 and 41,476
🔽 Breakdown below the support could push price down to 39,309 or even test the key zone near 39,276
With key U.S. data around the corner (noted on the chart), the move could be news-driven. Stay reactive and don’t pre-empt the breakout. Let price lead.
Plan the breakout. Don’t get trapped in the chop. ✅
what happens when politics and stock market come togetherWhen politicians get involved in the stock market, then common man is going to loose 100%. Tariffs, War etc are just a façade. A deeper analysis of why such a comment comes at such a time will give you the real answer 😎

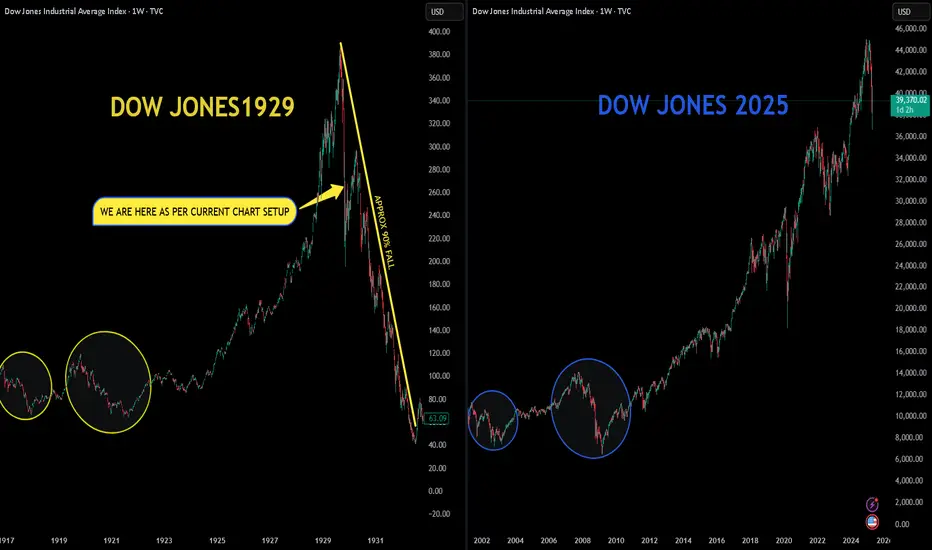
The 1929 Trade Tariff Vs The 2025 Trade Tariff (DOW JONES)Charts are self explanatory.
This is a simple comparison of the 1929 Dow Jones with the 2025 Dow Jones. As you can observe, there are many similarities.
Big Question: Can the Dow Jones again experience a 90% correction, similar to the one between 1929 and 1932 ?
NOTE: This is just an observation/correlation.
Disclaimer: This is for demonstration and educational purpose only. This is not buying or selling recommendations. Please consult your financial advisor before taking any trade.
DJI Dow Jones US futuresUS30 futures are currently on a support of weekly 200 EMA.
also this is a retest of previous breakout range 36600- 36800.
This can be a good level to bounce if market wants to reverse so accumulation can be done in small quantity.
But everything is in hands of Trump chacha.

DOW JONES - Future Cautious Rebound May Precede Fresh DowntrendNote: Cautious Rebound May Precede Fresh Downtrend
Timeframes Observed: Daily & Weekly
Date: 8th April 2025
🔍 Technical Chart Analysis Overview:
The index has posted a short-term rebound from a key oversold zone, with today’s candle closing as a bullish inside bar (or substitute with actual candle type if known: e.g., "small-bodied bullish candle with long upper wick") on the daily timeframe.
This bounce aligns with the 38.2% Fibonacci retracement level, plotted from the recent swing high to the latest swing low. However, price has failed to close above the 20-day EMA, indicating weak follow-through momentum.
On the weekly timeframe, the trend remains under pressure. The recent uptick resembles a bearish flag or corrective structure, with volume tapering off — a classic sign of distribution within a downtrend.
📌 Key Observations:
RSI on both daily and weekly charts is recovering from oversold territory but remains below 45, suggesting momentum is not supportive of a sustained rally.
MACD histogram continues to print below the zero line, reinforcing a bearish bias.
Volume analysis indicates the rebound lacks conviction, with lower-than-average buying pressure during the pullback.
🗓️ Macro Catalyst Watch (Next 7 Trading Sessions):
Upcoming releases:
U.S. CPI Inflation Data
Consumer Sentiment Index
FOMC Commentary / Fed Rate Expectations
These may act as high-impact triggers, potentially dragging the market toward the next Fibonacci level at 61.8% retracement, or even to prior swing lows, if data disappoints.
⚠️ Conclusion & Strategy Note:
While the market is exhibiting a temporary rebound, this appears to be a technical retracement within a larger bearish structure. We maintain a cautious stance and do not recommend aggressive long positions at current levels.
🔽 Preferred Tactical Bias:
Watch for rejection near resistance zones (20 EMA, 50% Fib level).
For HFTs Short opportunities may arise on confirmation of a bearish reversal candle or failure to hold above today's high & people may get stuck.
Maintain risk-defined positions ahead of macro data events.

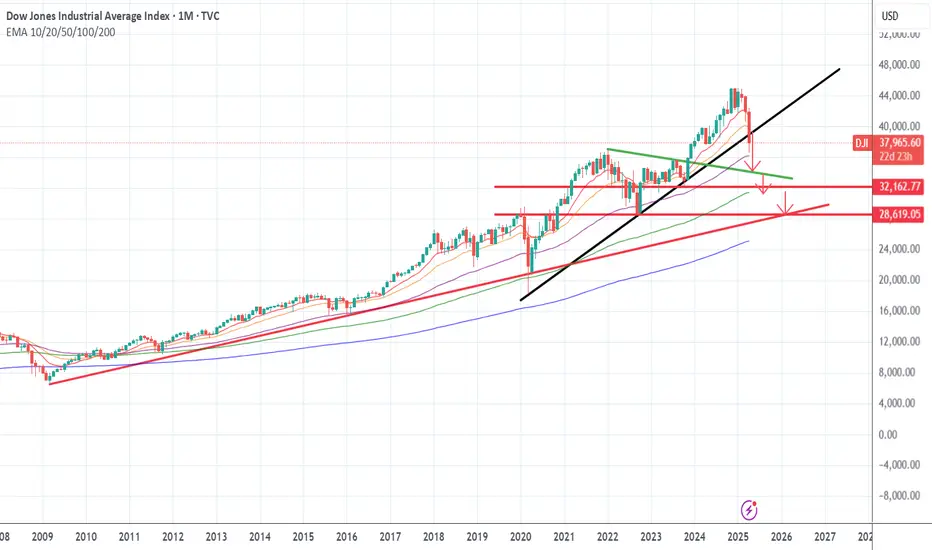
dow zone breakdown in dailyhello everyone,
dow zone has joined indian market in terms of going in downward spirall.
probably it will reach to the below trendline in 9 to 12 months
extreme recesssion case may take dow to 26000-27000
but now will be the time to invest and make good money ,but wait for the right moment
before new highs previous lows are always being kissed upon
Such accurate information is not obtained by watching news, Such accurate information is not obtained by watching news, but only by assessment
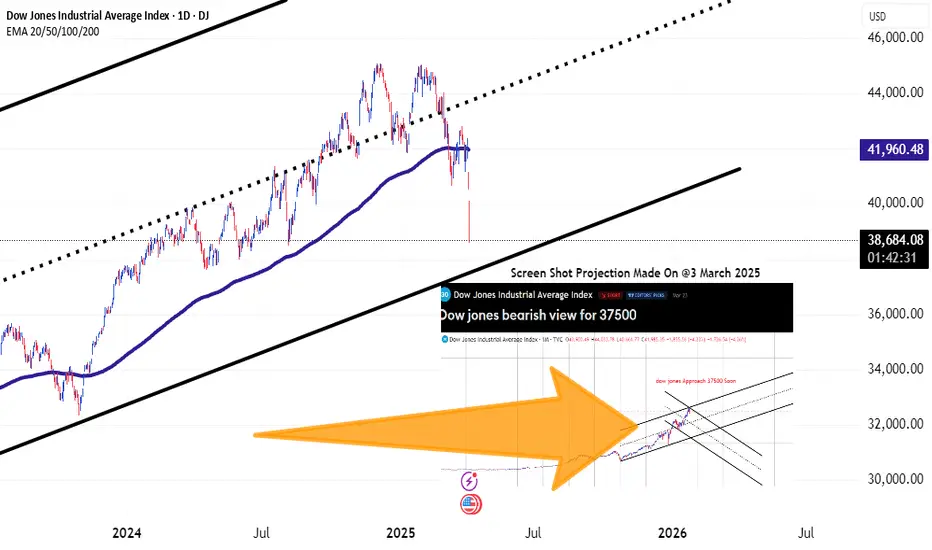
Projection Made On 23 March 2025
DOW JONES FALL DOW JONES FALL -1600
The Dow Jones Industrial Average experienced a significant drop recently, falling by over 1,400 points, or 3.3%, due to widespread concerns triggered by new tariffs announced by President Trump

Be Ready For 25 K In Nasdaq & 50 K In Dow Jones The Dow Jones Industrial Average (DJIA), commonly known as the Dow, is a stock market index that tracks 30 prominent U.S. companies across various industries, excluding transportation and utilities. citeturn0search12 As of April 1, 2025, the DJIA closed at 42,031.46, marking a modest increase of 0.07% from the previous trading day. citeturn0search6
Recent market movements have been influenced by investor concerns over impending tariffs announced by President Donald Trump, set to take effect on April 3. These tariffs are anticipated to impact various imports, including a 25% tariff on automobiles starting April 4, and the end of the suspension of tariffs on Canadian and Mexican goods. citeturn0news17 Such developments have contributed to market volatility, with the DJIA experiencing fluctuations in response to these economic uncertainties.
For instance, on March 31, 2025, the Dow rose by 1% to close at 42,001.76, despite broader concerns that the tariffs could exacerbate inflation and hinder economic growth. citeturn0news22 Conversely, earlier on April 1, the index saw a decline of 0.7%, dropping 276 points, primarily driven by losses in shares of Johnson & Johnson and Boeing. citeturn0news20
The DJIA serves as a key indicator of the overall health of the U.S. stock market and economy, reflecting investor sentiment amid ongoing policy changes and economic developments.

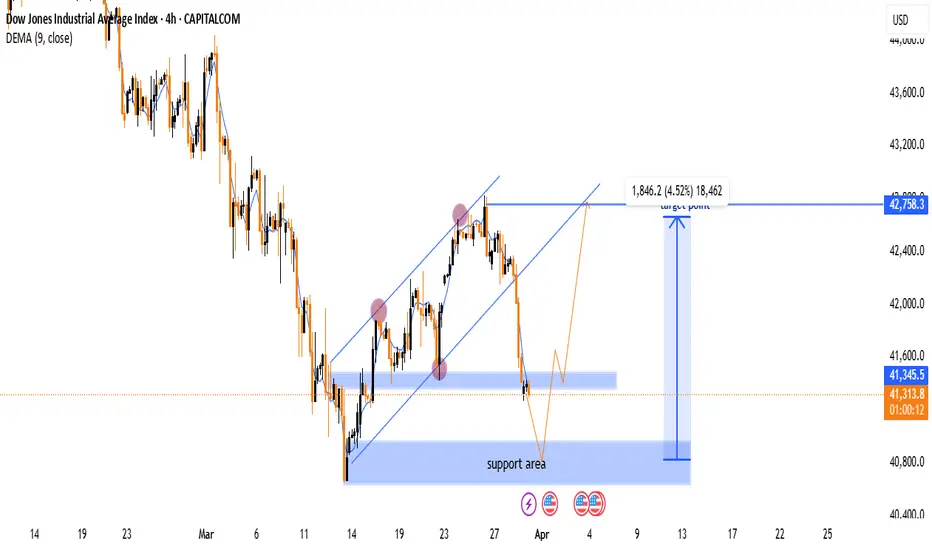
Dow Jones 4H Chart Analysis: Support Test & Potential Reversal 📉 Downtrend: The price was falling sharply before forming an upward channel.
📊 Channel Break: The price broke below the ascending channel 🚨.
🟦 Support Zone: The blue area marks a strong support region 📌.
🔵 Bounce Expected? If the price holds, a rebound could happen 📈.
🎯 Target: The projected upside target is 42,758.3 🚀.
⚠️ Risk: If the support fails, the price may drop further ⛔.
🔴 Watch for: A confirmed reversal near support or further breakdown!
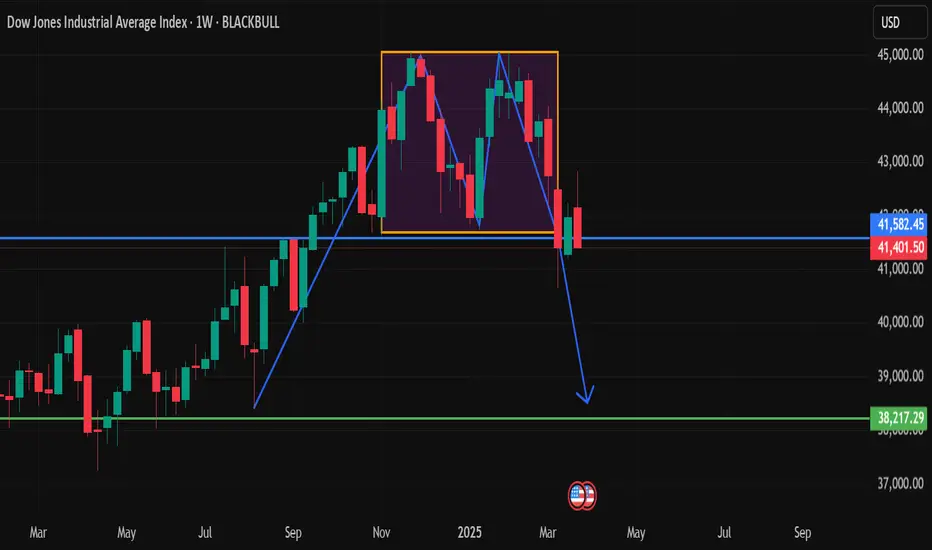
US30 Weekly Analysis: Double Top Breakdown and Bearish OutlookThe Dow Jones Industrial Average (US30) has exhibited a clear double top formation on the weekly timeframe, signaling a potential bearish reversal. The price recently broke below the neckline support around 41,400, confirming the pattern and suggesting further downside movement.
Price action
Analysis
1. Double Top Formation
• A double top is a classic reversal pattern that occurs after an extended uptrend.
• The two peaks were formed around 42,819.50, where bullish momentum failed to sustain further highs.
• The rejection from this level indicated that buyers were losing strength.
2. Neckline Break and Confirmation
• The neckline support at 41,400 was a critical level that held price consolidation for some time.
• A break below the neckline has confirmed the bearish structure, signaling further downside potential.
• If the price retests 41,400 and rejects, it could provide another opportunity for short positions.
3. Bearish Target Projection
• The double top pattern suggests a measured move equal to the distance between the peaks and neckline (approximately 1,400-1,500 points).
• This projects a downside target of 38,217, aligning with the next major support zone (green line on the chart).
Trading Strategy: Bearish Continuation
• Entry: Wait for a retest of 41,400 and a rejection with a bearish confirmation candle.
• Stop Loss: Place above 41,800, as a break above invalidates the bearish setup.
• Take Profit: First target 39,500, final target 38,217.
• Risk Management: Use proper position sizing to manage risk in case of a false breakout.
Conclusion
US30 is showing strong bearish momentum after confirming the double top breakdown. A successful retest of 41,400 as resistance will likely accelerate selling pressure towards 38,217. We should watch price action closely for confirmation before entering short positions.
dow Jones Projection For next 30 days ### **Dow Jones Industrial Average (DJIA) – The Stock Market Barometer** 📈🇺🇸
The **Dow Jones Industrial Average (DJIA)**, commonly called the **Dow**, is one of the oldest and most widely followed stock market indices in the world. It represents **30 large, blue-chip companies** traded on the **New York Stock Exchange (NYSE) and NASDAQ**.
---
## **1️⃣ Key Facts About the Dow Jones**
- **Founded:** 1896 by Charles Dow & Edward Jones
- **Number of Companies:** 30
- **Index Type:** **Price-weighted** (higher-priced stocks have more influence)
- **Market Cap:** ~$10+ Trillion
- **Trading Hours:** 9:30 AM – 4:00 PM ET (Pre-market & After-hours trading available)
✅ **Fun Fact:** The **DJIA started with just 12 stocks** and was originally meant to track industrial companies like railroads and steel manufacturers.
---
## **2️⃣ How the Dow Jones is Calculated**
Unlike the **S&P 500 (market-cap weighted)**, the **Dow is price-weighted**—meaning **higher-priced stocks impact the index more**.
**Formula:**
\
The **Dow Divisor** adjusts for stock splits, dividends, and other factors to keep calculations consistent.
---
## **3️⃣ Top 10 Companies in the Dow Jones (as of 2024)**
The **Dow 30** includes a mix of **tech, finance, healthcare, and industrial companies**:
| **Company** | **Ticker** | **Sector** |
|----------------------|-----------|------------------|
| **Apple** 🍏 | AAPL | Technology |
| **Microsoft** 💻 | MSFT | Technology |
| **Goldman Sachs** 💰 | GS | Financials |
| **UnitedHealth** 🏥 | UNH | Healthcare |
| **Boeing** ✈️ | BA | Aerospace |
| **Visa** 💳 | V | Financials |
| **JPMorgan Chase** 🏦 | JPM | Banking |
| **Coca-Cola** 🥤 | KO | Consumer Goods |
| **McDonald's** 🍔 | MCD | Consumer Goods |
| **Johnson & Johnson** 💊 | JNJ | Healthcare |
🔹 *Unlike the NASDAQ-100, the Dow is more diversified across industries!*
---
## **4️⃣ Why is the Dow Jones Important?**
✔ **Oldest & Most Recognized Index** – Seen as a reflection of the **U.S. economy**.
✔ **Tracks Large, Stable Companies** – Focuses on **blue-chip stocks**.
✔ **Used as a Benchmark** – Investors compare portfolio performance to the **Dow’s movement**.
✔ **Global Market Influence** – Dow’s rise or fall impacts markets worldwide.
---
## **5️⃣ How to Invest in the Dow Jones?**
💡 **Ways to Gain Exposure:**
- **Buy individual Dow 30 stocks** (AAPL, MSFT, MCD, etc.).
- **Invest in ETFs like DIA (SPDR Dow Jones ETF).**
- **Trade Dow Futures & Options (YM contracts).**
- **Mutual Funds tracking the Dow Jones index.**
📊 **Factors Affecting the Dow Jones:**
- **Interest Rates (Federal Reserve Decisions) 📉📈**
- **Economic Data (Jobs, GDP, Inflation) 📊**
- **Earnings Reports (Quarterly Profits of Dow 30 Companies) 🏢**
- **Geopolitical Events & Trade Policies 🌍**
- **Consumer Spending & Corporate Growth Trends 💰**
---
## **6️⃣ Recent Dow Jones Performance (March 2025)**
🔹 The **Dow Jones recently hit new highs**, driven by **strong banking and healthcare stocks**, but remains **volatile due to interest rate hikes by the Federal Reserve and global economic concerns**.
Would you like real-time Dow Jones updates or investment insights? 🚀
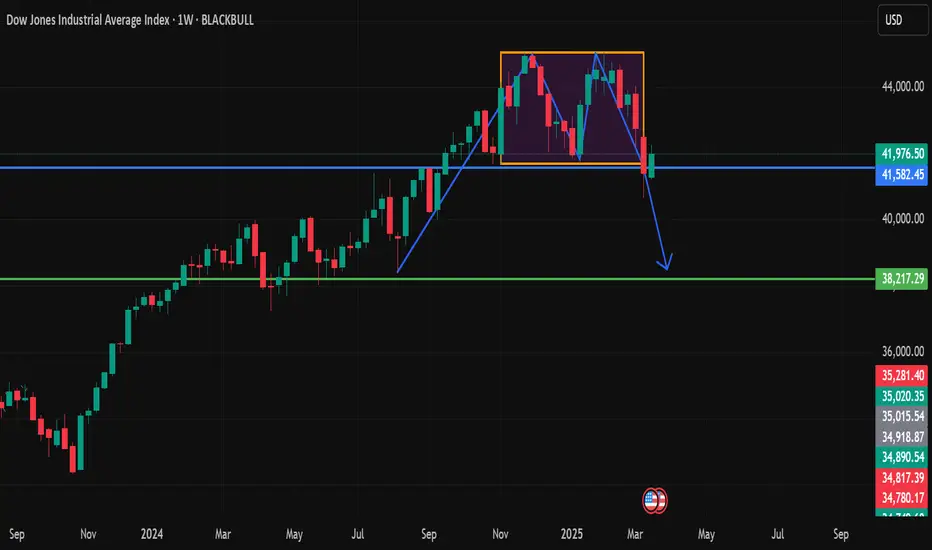
Dow Jones (US30) - In-Depth Price Action AnalysisThe US30 (Dow Jones Industrial Average) is showing signs of a major trend reversal with a confirmed double top formation, signaling potential downside ahead.
🔹 1. Double Top Formation – A Major Reversal Signal
The double top pattern is one of the most reliable bearish reversal formations, especially on higher timeframes like the weekly chart. Here’s what’s happening:
First Peak:
The first top formed after a strong rally that pushed price into an overextended zone.
Buyers initially drove the index higher, but exhaustion kicked in, leading to a temporary pullback.
Second Peak:
After a brief decline, buyers attempted another push toward the same resistance level.
However, the second peak failed to break higher, indicating that demand was weakening.
This failure to set a new high shows buyers losing strength, while sellers gain control.
Neckline Break – The Critical Breakdown
The key neckline support (highlighted in blue) was acting as a strong demand zone.
Once price closed below the neckline, it confirmed the breakdown, triggering a potential shift in market structure from bullish to bearish.
🔹 2. Breakdown & Retest – Classic Confirmation of Trend Shift
After breaking the neckline, price attempted a pullback (retest) but faced immediate selling pressure.
This failed retest is a confirmation that the previous support has turned into resistance—a key characteristic of a valid double top.
Sellers stepped in aggressively, leading to renewed downward momentum.
🔹 3. Key Levels to Watch – Where is Price Heading?
📍 First Major Target: $38,217 (Green Support Zone)
This level represents a previous accumulation zone, where price consolidated before making its last push upward.
It is a critical demand zone, meaning buyers may attempt to defend it.
If price holds here, we could see a short-term bounce before further downside.
📍 If $38,217 Breaks – A Deeper Drop to $35,000-$36,000?
A clean break below $38,217 would confirm further weakness, opening the door for a drop to $35K- GETTEX:36K , which is the next structural support zone.
This area has historically been a high-volume demand zone, meaning stronger reactions could occur there.
🔹 4. Bearish Case – Signs of Further Weakness
Several factors strengthen the bearish outlook:
Lower Highs & Lower Lows
After the double top, price has now formed a lower low, indicating the beginning of a potential downtrend.
If the next bounce fails to set a new high, the trend shift will be further confirmed.
Loss of Bullish Momentum
The last rally showed weaker buying strength, with wicks rejecting higher levels—this is a clear sign of seller dominance.
The failure to reclaim the neckline further validates the bearish shift.
Macro Sentiment – Market Uncertainty
If broader market conditions turn risk-off, investors may rotate out of equities, adding further selling pressure to US30.
Rising bond yields or geopolitical uncertainties could accelerate the decline.
🔹 5. Bullish Invalidation – What Could Reverse the Bearish Outlook?
For this bearish setup to be invalidated, we would need to see:
✅ A strong close back above the neckline (~$41,500-$42,000)
✅ Sustained buying volume pushing price above the second peak (~$43,000)
✅ A break of the lower-high structure, showing a return to bullish strength
If these conditions happen, it would suggest that sellers have lost momentum and buyers are regaining control. However, as long as price stays below the neckline, the bearish bias remains intact.
🔹 Final Verdict – Bearish Bias with $38,217 as the Next Key Test
📉 Bearish as long as price remains below the neckline
🔎 Watching $38,217 for reaction – A break below would confirm further downside
⚠️ Reclaiming FWB:42K + would invalidate the bearish structure
Right now, all signs point to a continuation of the decline. If $38,217 fails to hold, we could see a much deeper drop in US30 in the coming weeks. 🚨
Dow jones bearish view for 37500The Dow Jones Industrial Average (DJIA), often referred to as "the Dow," is a price-weighted index that tracks 30 prominent blue-chip companies trading on U.S. stock exchanges. Established in 1896 by Charles Henry Dow, it serves as a key indicator of the U.S. stock market's overall health.

SIMPLE ANALYSIS OF DOW JONESThere is no complication to analyse stock market if you are in TRADINGVIEW all those tools are available here which you ned to analyse as crypto,commodity,index and stocks as well no one is INTEL here GOD gifted each one a brain.Only need is to use it.
Here so many rumours are wondering like recession but as i am looking only technicall reason are there nothing else.
Look my chart ther is reaction on DOUBLE TOP/BOTTOM and time only.
Orrange line will react again whenever touched.Can be long if it penitrate green support line and hold.
