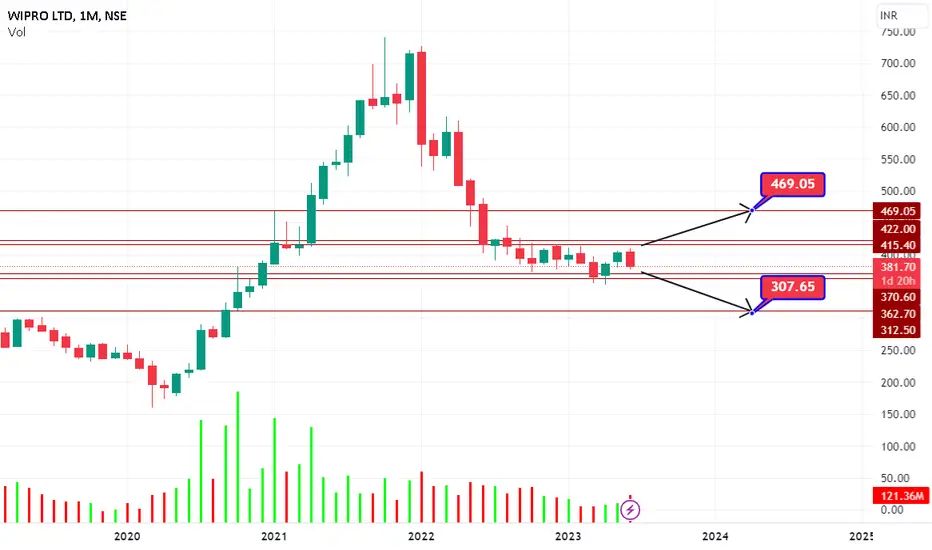
WIPRO Daily looking bullishWIPRO Daily looking bullish. It has trendline breakout /inverted head and shoulder breakout with 200 ema support on daily candle. Good to buy at 415 for target of 477 with sl below 392
WIT/N trade ideas

Wipro For Positional Buying Buy Wipro @384 with Target of @425 it will give good move at up side very soon.
You can put Stoploss @376

Technical Analysis: Wipro's Potential Breakout Hello traders! Today, we'll dive into an exciting technical analysis of Wipro, a prominent IT company and a part of the Nifty 50. I'll walk you through some essential concepts and terms while dissecting the current market situation. Please note that this analysis is for educational purposes only, and I am not a SEBI registered analyst.
📊 Key Details 📈
Wipro has been in a downtrend since October 2021 until March 2023. However, things seem to be changing now. Starting from December 2022, Wipro has formed an inverted head and shoulders pattern, which indicates a potential trend reversal. Today, we see the head and shoulders pattern breaking, but it's too early to confirm the breakout. We need to wait for the market to close, or we can initiate a trade five minutes before the closing bell if the breakout sustains.
There is a critical resistance zone for Wipro, ranging from 417 to 413. If Wipro manages to sustain above this level today, it might present a good opportunity for a buy trade. Additionally, analysing the volume chart, we can observe a significant surge in volume over the last three days, adding more weight to the breakout trade setup.
💡 Educational Insights 💡
Before we proceed further, let's briefly explain some important technical terms:
1. Head and Shoulders Pattern : This pattern indicates a trend reversal and consists of three peaks, with the middle peak (the head) being the highest, flanked by two smaller peaks (the shoulders). A breakout above the pattern's neckline signifies a potential upward move.
2. Resistance Zone : It's a price range where a significant number of sellers are present, preventing the price from rising further.
3. Volume Analysis : Volume measures the number of shares or contracts traded during a given period. A surge in volume can validate the strength of a price move.
💬 Like, Comment, and Follow! 💬
If you find this analysis helpful, don't forget to show your support by liking and commenting! I appreciate your observations and feedback, as it keeps me motivated to write consistently.
👉 Follow me on TradingView for more articles and trade setups: in.tradingview.com 👈
🚀 Stay Inspired and Keep Trading! 🚀
Remember, trading can be both thrilling and challenging. Always approach it with discipline and a learning mindset. With the right knowledge and analysis, you can unlock opportunities in the markets!
Keep exploring and happy trading! 📊📈🤝

#Wipro cash : Looks good around 410-414#Wipro cash -Positional call
18.07.2023
Looks good around 410-414
Stoploss 380
Tgt 444-450/475/520
Cmp 415

Breakout in WIPRO ?Despite a negligible decline in Q1 earnings, Wipro has experienced a strong breakout today. While there has been some profit booking and a minor correction after the significant momentum, it would not be accurate to consider it a false breakout. In fact, there is still significant potential for further growth.
After a 50% correction, Wipro is now set for a promising upward move. The IT sector, including companies like TCS, Tech Mahindra, Mindtree, and Infosys, has recently shown strong momentum. This suggests that Wipro might join the rally and experience similar upward movement.
Considering the current price range we will not set the target more than 6% at this juncture. As an another strategy we can also wait for the price to give a pull backs to its breakout line and then taking the trade will make this trade less risky.
It was just my analysis. Do your own due diligence before investing.

WIPRO Breakout from H&S Pattern on Daily chartsWIPRO Breakout from H&S Pattern on Daily charts.... Targets 470+ in 2-3 Months
LTP - 420
SL - 405
Targets - 470+
Timeframe - 2-3 Months

WIPRO- WEEKLY TFWipro looks suitable for a reversal at this point.
1. A W pattern both in daily & weekly tf.
2. 330-350 levels can act as strong support.
3. 20-day MA started trading below the CMP in daily tf.
4. Can plan a trade above 373-376 level.
5. A good delivery volume can be seen in the last 5 days.


Cash trade, no FnO, IT sector breakout.Based on chart pattern, Let channel break upside with SL 370 for trg 700.

Buy WIPROBuy above 387 with the stop loss below 382 on daily closing basis.
This is for education purpose only. Please do your own research before entering any position.

WIPRO LONG VIEWI am people I am looking to buy a side above 410, In a one-day time frame inverted h&s making also near 200ema, consolidation near EMA so the potential is for buying long.

Wipro making bullish head and shoulder patternWipro making bullish head and shoulder pattern in day time frame.
wait for neckline breakout then take entry... target 1st resistance, 2nd resistance and so on... and stoploss will be last swing low.

WIPRO - Weekly AnalysisIn the Weekly Chart of WIPRO ,
we can see that; after continuous selling, we saw a W shape recovery at bottom.
Also it has taken its support and shown an up move..
Also, it has respected the cross Trendline multiple times.
Let it create a Halt or Red candle next week, then we can enter with SL and Target.

buy wipro and holdgood opportunity to invest now and hold till 550 . at fib level will see a trend change

wipro its in a middle of breakout or breakdown
chart overall bearish however a bounce shouldnt be ruled out
Wipro bullish reversal patternWipro on 1H time frame
Respected Support ✅
Retest ✅
Pattern on 1H : Bullish Harami completed (2 candles)
0.10 points away from completing bullish pattern 'Three inside up' (3 candles)
ENTRY : At CMP
Target: 387 - 390 (short term)
Disclaimer:
I'm not a registered financial advisor.
All information found here is for educational purposes only and should not be construed as personal investment advice.
Conduct your own due diligence, or consult a licensed financial advisor or broker before making any and all investment decisions. Any investments, trades, speculations, or decisions made on the basis of any information found on this published idea, expressed or implied herein, are committed at your own risk, financial or otherwise.

WIPRO @ 379IT: WIPRO @ 381.30 | 17-JUN-2023
Sector: IT Services & Consulting
BETA: 1.04
FACE VALUE: 2
DIVIDEND YIELD: 0.26
BOOK VALUE: 119.39
SUP: 346
As long as this support holds, we can see 600/700/1000+

Wipro- Head n Shoulder breakdown - 3% downside potentialWipro has formed Head and Shoulder pattern and given breakdown at the trendline support around 396 with good volumes.
Target: 385-382 levels.
SL: Hrly candle close above 398

WIPRO 15MINAFTER TAKING STRONG SUPPORT WIPRO GOING UPWARD..
WIPRO Looking good for upside..
When it break level 383 and sustain.. it will go upside...
BUY @ 383
Target
1st 386
2nd 392
Enjoy trading traders.. Keep add this STOCK in your watch list..
Investor are welcome..


@Wipro bullWipro once it breakout the resistance then target is 426.55 and next target is 445.
buyer and seller are aggressive at resistance level but this time it will break the resistance level......
