#Wipro cash : Looks good above 412.10#Wipro cash
04.06.2023
old call given at 390-392 tgt was 408-412
Found resistance
Fresh call -
Buy above 412.10
Stoploss 390
Tgt 438-440/470
Cmp 405
WIT/N trade ideas

Bullish flag pattern breakout in WIPROWIPRO
Key highlights: 💡⚡
✅On 1 Hour Time Frame Stock Showing Breakout of Bullish flag Pattern .
✅ Strong Bullish Candlestick Form on this timeframe.
✅It can give movement up to the Breakout target of 420+.
✅Can Go short in this stock by placing a stop loss below 395-.

WIPROCharts shows that something positive is going on in the company. It can be looked into for long term but surely with previous month low as SL and that is aroung 379

Wipro Smart Buy Wipro In the weekly time frame is on last week's brake flowing wage pattern.
this week it was breaking it with the ( High Volume +15.50 ) this is a very positive sign for Entry on the Wipro
.
.
CONDITION ONE - Price will hit 443price after that the next target is 495price is the 2nd Target If the buyers are taking more interest in it Or Wipro's more positive News is also helping to push the price to the Next level AND upcoming next week's price will take a Headly retest 392price level zone after that it will More volume bullish and hit August high.
CONDITION TWO - Price will go up for some time and after that, all buyers enter the market after that seller volume is coming and trap all the buyers who already enter the market seller can hit all the buyers stop loss, and push the price down.
So, it is a good time to Enter the Wipro But this is up to you what type of trader and Investor you are
ACCORDING TO ME - I will take the position you see on the Chart and I also give you my SL and TP

History Repeats for wiproLooking at similar pattern in 2001 , It is repeating now in 2023.
So this can take a while to hit the ATH , so its really tough time for investor for who bought at high price. but as the inflation is high and considering the % of Breakout the consolidation range can be shorten then the previous pattern. So in upcoming days if the trend line is broken it can go up to 300 in worst case even below that. and can consolidate with in a range.

WIPRO - SHORT- 1D - Channel PatternWipro is currently on a Downtrend for over a year now. The IT sector overall looks bearish and on Wipro, you can spot a beautiful channel pattern forming and price-making lower Highs.
It has a roughly 1:3 RW Ratio.
Entry - (382-384)
SL - 390
Tar - 360

WIPRO SELL ONLYWIPRO Wait for supprot to break and retest after pull back go short.
FOLLOW ME FOR MORE TRADING SIGNALS😊

Wipro First 5 Waves rise from bottomWipro has clean 5 wave rise we can expect minimum 422-448 in next leg up risk reward is very good for this trade.

#Wipro cash : Tech stocks looking good for upside#Wipro cash
22.05.2023
Looks good at 390-392
Stoploss 380
Tgt 408-412
Strong breakout once close above 412 levels
Cmp 395.75

#WIPRO AnalysisStock is trading near downward channel BO, keep watch BO level for entry, IT stocks are moving well with strong NASDAQ sentiment.

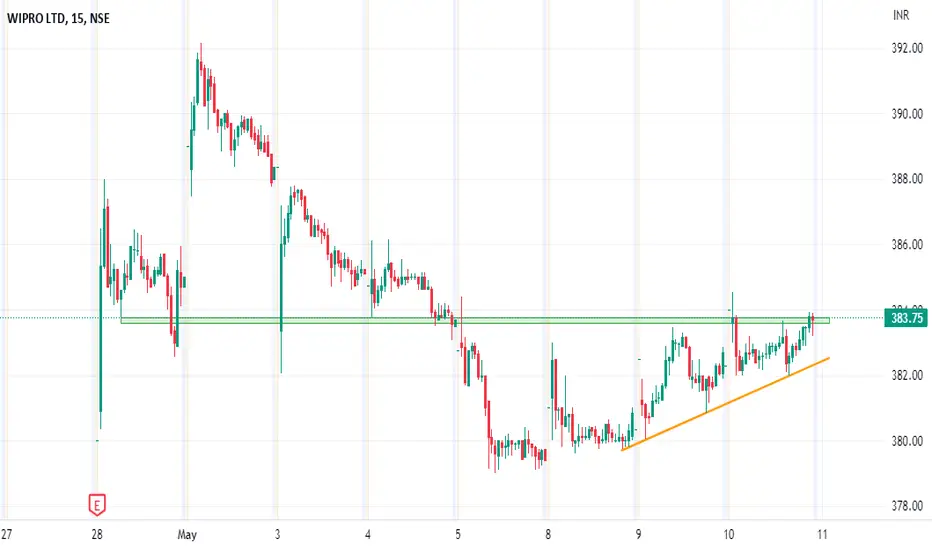
WIPRO - #intraday Chart Analysis || 11th May,2023 #stocksAnalysis Criteria Used:
1. Please find the Chart Analysis done for the Intraday Trade Idea levels for 11th May, 2023
2. The analysis for the Trade ideas, has been done based on Trend analysis and Chart Patterns with Volume Buildups
Focus On:
1. Always keeping your Risk Management in play
2. Using a Stop Loss; because it is your Best Friend
3. Always Plan your Trade and stick to your Plan
4. Dont overthink or overanalyse
5. Treat this as your Business and get serious about it
#sharemarket #stockmarket #nifty #sensex #investing #trading #nse #bse #stockmarketindia #stocks #indianstockmarket #investment #stockmarketnews #banknifty #finance #money #intraday #intradaytrading #investor #niftyfifty #dalalstreet #sharemarketindia #sharemarketnews #stockmarketinvesting #business #sharemarkettips #stock #india #indiansharemarket #rakeshjhunjhunwala #bhfyp #mumbai #share #wealth #investment #market #invest #trading #investing #finance #FinancialFreedom #investor #trader #stocks #profit #investors #economy #equity #shares #nifty #stockexchange
DISCLAIMER:
.
* Please do your own research and/or contact your financial advisor before taking any trading opportunities
** We will not be responsible for your profit or loss
*** We are NOT SEBI REGISTERED
______________________
best stocks to buy today
best stocks to buy now
best stocks to buy
best stocks for Intraday tomorrow
best stocks for long term investment
best stocks to buy today india
best stocks for swing trading
swing trading strategies
swing trading beginners
what is swing trading
swing trading stocks
swing trading stock selection
swing trading kya hai
nifty analysis
nifty view
bank nifty analysis
top stocks to buy now
strong stocks
nifty view
nifty prediction
stock market view tomorrow
bank nifty Levels
bank nifty prediction
share news
stock market news
best stocks to buy now
profit booking stocks
multibagger stocks in discount
breakout stocks
best short term stocks
best short term shares
next multibagger stocks
WIPRO End of Fall ??!!Chart patterns insist me to go with above titled opinion
REASONS
1. In Monthly timeframe , WIPRO has been trading inside Ascending channel taking support and resistance (shown below)
2. Middle yellow trendline- Resistance turned Support looks favourable for the bounce.
3. Entry(safe) can be made after a good voluminous Breakout out of the white slanting trendline.
4. SL can the low of the Breakout candle.
As the stock has fell more than 50% , we can even wait for WEEKLY BREAKOUT and then enter upon retracement.
Will update as it moves!!!
Let's wait & watch , how it moves!!!!
NOTE- Just sharing my view...not a tip nor advice!!!

intradayboth side potential
avoid first 15min breakout
wait for 15 min candle closing
targets are marked
follow risk management
do your own analysis
do workout
do meditation
start reading book


WIPRO -DOUBLE BOTTOM Hello investors,
My simple and powerful double bottom pattern formed in WIPRO.
I have explained everything in chart.
Need your comments.
Thanks,
Indian OX

[Turtle] Wipro 370PE Short IdeaShort Wipro May 370 PE a 8.25
Note -
One of the best forms of Price Action is to not try to predict at all. Instead of that, ACT on the price. So, this chart tells at "where" to act in "what direction. Unless it triggers, like, let's say the candle doesn't break the level which says "Buy if it breaks", You should not buy at all.
=======
I use shorthands for my trades.
"Positional" - means You can carry these positions and I do not see sharp volatility ahead. (I tally upcoming events and many small kinds of stuff to my own tiny capacity.)
"Intraday" -means You must close this position at any cost by the end of the day.
"Theta" , "Bounce" , "3BB" or "Entropy" - My own systems.
=======
I won't personally follow any rules. If I "think" (It is never gut feel. It is always some reason.) the trade is wrong, I may take reverse trade. I may carry forward an intraday position. What is meant here - You shouldn't follow me because I may miss updating. You should follow the system I share.
=======
Like -
Always follow a stop loss.
In the case of Intraday trades, it is mostly the "Day's High".
In the case of Positional trades, it is mostly the previous swings.
I do not use Stop Loss most of the time. But I manage my risk with options as I do most of the trades using derivatives.
=======

Closely follow WIPROWipro in a critical condition, lifetime resistance now works as Strong support, watch closely

Double bottom ahead !!!The stock about to create double bottom..
Add this stock in your radar !!!
Only for educational purpose only .


Hammer PatternHammer candlesticks typically occur after a price decline. They have a small real body and a long lower shadow.
The hammer candlestick occurs when sellers enter the market during a price decline. By the time of market close, buyers absorb selling pressure and push the market price near the opening price.
The close can be above or below the opening price, although the close should be near the open for the real body of the candlestick to remain small.
The lower shadow should be at least two times the height of the real body.
Hammer candlesticks indicate a potential price reversal to the upside. The price must start moving up following the hammer; this is called confirmation.
Script = Wipro
Time Frame = 1 Day

wiprowait for break down (red area) and 365.4 sell zone.
375.25 buy zone. i m intrested for short. hourly time frame shows trend is down.

WiproWipro Very Clear for Double Bottom for weekly time frame So Wipro buy position for long position

#Wipro Spot #Shortterm10-Apr 2:48 PM
#Wipro Spot #Shortterm
Buy at CMP- 372.8
Stop loss - 367
Target- As par strategy indicates
Disclaimer- We are not SEBI registered advisor.
Charts and views are only for educational purpose.
#NSE #stockstowatch #stockstobuy #swingtrading
