$BNB: Key HTF Decision Zone AheadCRYPTOCAP:BNB : Key HTF Decision Zone Ahead
#BNB is still holding above the critical $700–$550 demand zone, the same area that defines the continuation or breakdown of the current macro trend. As long as price maintains this support, HTF structure stays bullish and the next expansion wave targets $1500 → $2000 → $2500 → $3000.
A weekly close below $550 would flip structure bearish and open a deeper correction toward $250–$170.
Key Levels
Accumulation Zone: $700–$550
Upside Targets: $1500 / $2000 / $2500 / $3000
Invalidation: Weekly close < $550
BNB is at a major decision point: Hold the zone and bullish momentum accelerates; lose it and trend resets.
NFA & DYOR
Trade ideas

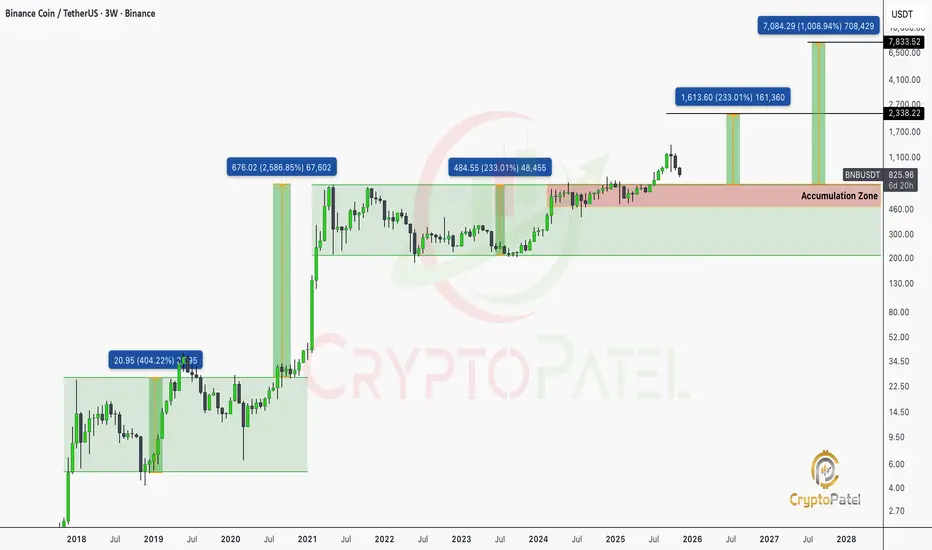
BNB/USDT 3-Week Chart Analysis: Is a Massive Breakout Coming?BNB/USDT 3-Week Chart Analysis: Is a Massive Breakout Coming?
Current Price: $827.05 (down 10.74%)
BNB is currently consolidating in a key Accumulation Zone between $700-$800, signaling institutional accumulation and balance.
Key Levels to Watch
Support Zones:
🔹 $484.55 – Critical demand from 2023 lows
🔹 $676.02 – Former ATH turned support
🔹 $700-$750 – Bottom of current accumulation
Resistance Targets:
🔹 $1,613 – First major upside
🔹 $2,338 – Next intermediate target
🔹 $7,084 – Long-term “moonshot” scenario
Volume & Structure Insights
🔹 2019 Breakout: Started the long-term uptrend
🔹 2021 Bull Run: Peak at $676, classic blow-off top
🔹 2024-2025 Accumulation: Renewed institutional interest
Bearish Risk
🔹 Failure to hold $700 → Retest $484 (-41%)
🔹 Breakdown below $484 → Bullish thesis invalid
NFA & DYOR
BNB/USDT – Bullish Reversal Idea | Demand Zone Reaction📌 Overview
BNB is currently trading at a major higher-timeframe demand zone, showing early signs of accumulation after a sharp sell-off. Price has tapped the demand area multiple times and is holding without breaking structure to the downside.
This setup is based on a potential short-term reversal or a relief bounce.
📍 Analysis
🔹 Demand Zone
Price is reacting from a clean demand zone created by previous strong bullish displacement.
Multiple wicks show buyers defending this level.
🔹 Market Structure
Prior strong downtrend
Price now consolidating at support
Lower timeframe shows slowing bearish momentum
🔹 Entry Logic
A long entry is placed at the reaction zone, anticipating a bounce toward the nearest inefficiency / supply zone above.
🎯 Trade Setup
🟩 Long Position Idea
Entry: At demand zone
Stop-Loss: Below the liquidity wick / zone low
Take-Profit: Previous structure high or the first major supply zone above
This gives a clean R:R setup (as shown in chart).
⚠️ Risk Management
Only risk what you can afford to lose
If the zone breaks cleanly, setup is invalid
Wait for candle confirmation if you want safer entry
📌 Final Thoughts
BNB is at a critical make-or-break level. If buyers hold this zone, a strong bounce is likely. If not, expect continuation lower.
Publishing this to track market reaction and trade execution.

$BNB is currently forming a double-bottom pattern on 4hr ChartCRYPTOCAP:BNB is currently forming a double-bottom pattern, a structure that often signals a potential trend reversal after a strong downtrend.
🔹Bottom 1: around $1,037
🔹Bottom 2: retested nearly the same zone — confirming a strong support base.
🔹Neckline resistance: around $1,178 – $1,180, aligning with the upper boundary of the consolidation zone.
Breakout above $1,180 could trigger a move towards:
🔹 $1,245 → $1,300 → $1,375 (measured target from the double-bottom).
Until that breakout occurs, the range remains $1,035 – $1,180.
If #BNB fails to hold the $1,030 zone, the next immediate supports are:
🔹 $995 – $970, aligning with previous liquidity pockets.
However, as long as $1,030 holds, the setup leans accumulatory rather than bearish.
A breakout above $1,180 could confirm a trend reversal, potentially reigniting bullish sentiment toward the $1.3K–$1.4K zone.

$BNB is trading within a Rising Wedge formation on the 4H chartCRYPTOCAP:BNB is trading within a Rising Wedge formation on the 4H chart, a pattern often signaling potential trend exhaustion or short-term reversal once the wedge apex is reached.
🔹The structure has been forming higher highs and higher lows since the $1,030–1,040 bottom zone, reflecting controlled bullish momentum.
🔸Current resistance is seen near $1,160–1,180, which coincides with the upper wedge boundary — a zone to watch closely for possible rejection.
🔹Support trendline lies around $1,095–1,100, serving as the key structural base of the wedge.
🔸If the support trendline breaks, we may see a pullback toward $1,050–1,020, confirming a short-term bearish divergence.
As long as #BNB holds above $1,095, the wedge structure remains intact and could still attempt a push toward $1,180–1,200.
However, if price fails to break above $1,160 and volume fades, a correction phase toward the $1,050 region becomes more probable.
📌 Key Levels to Watch
Resistance: $1,160 - $1,180
Support: $1,100 / $1,050
Bias: Neutral-to-Bearish (until breakout confirmed)

$BNB 4H Chart – Bearish Pennant in Formation! CRYPTOCAP:BNB 4H Chart – Bearish Pennant in Formation! 📉
#BNB is tightening within a bearish pennant structure on the 4-hour timeframe — a continuation setup that often follows a sharp downward move.
🔸Price is moving inside a contracting triangle, with lower highs and higher lows, signaling compression before a potential breakout.
🔹The bearish flagpole from the previous drop aligns perfectly with this pennant pattern, hinting that a continuation toward lower zones could follow if support breaks.
🔸Currently, BNB is hovering near 1,090, facing rejection near the pennant’s upper trendline.
🎯 Levels to Watch
Support: 1,070 → 1,000
Resistance: 1,130 → 1,180
Breakdown target (if confirmed): Around 950–970
#BNB is sitting in a decision zone — a breakdown could accelerate bearish momentum, while a strong breakout above 1,130 would flip the short-term bias back bullish.

A look at poss shorts list posted the morning of 10/8A look at poss shorts list posted the morning of 10/8
A look at poss shorts list posted the morning of 10/8

A look at poss shorts list posted the morning of 10/8A look at poss shorts list posted the morning of 10/8....Using PAR, diverghences and pivots

BNB 400% up from our Entry People laughed when I said CRYPTOCAP:BNB will hit $2000–$3000.
but people still doubt my $2000–$3000 targets? 🤔
From 1st Entry of this bull run: +400% ( TP1 ✅ )
From $500 re-entry: +120%
You can doubt targets, but not momentum.
Just don’t forget — book profits.
Because trading without a safe zone = casino mode.
Not Financial Advice

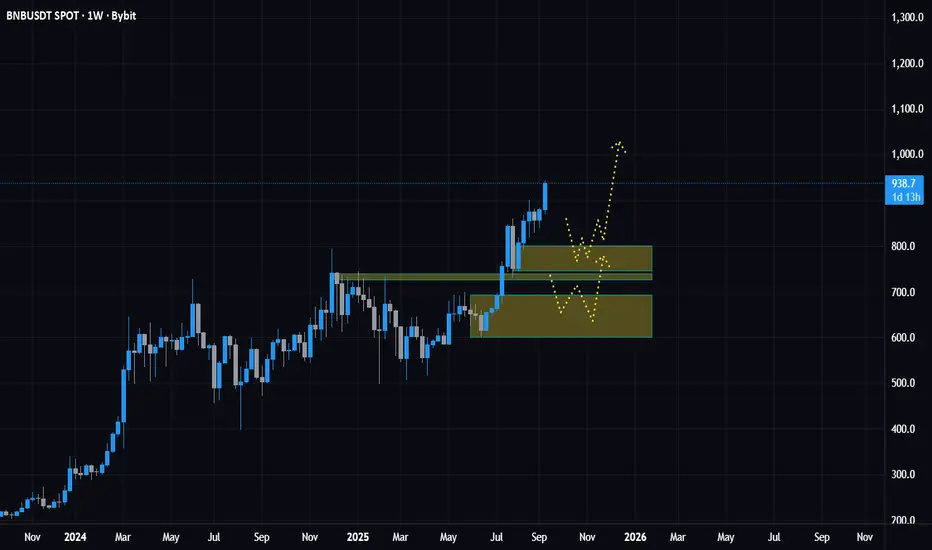
BNB Weekly Breakout - Retest Levels in Play BNB Weekly Breakout – Retest Levels in Play 🚀
BNB has shown strong momentum, currently trading around $945 after a clean weekly breakout.
📊 Key Buy Levels:
810 USDT
745 USDT
These are strong retest OB and FVG zones where buyers can look for high-probability entries. Weekly breakouts often give the best confirmation when price pulls back into demand before resuming the trend.
⚡ Why it matters:
Breakout above major structure
Strong volume confirmation
Retest zones align with institutional buying areas
As long as BNB holds above these levels, the bullish structure remains intact. Retest entries here could offer excellent risk-to-reward opportunities.
🔑 Trade Idea:
Watch for retest into 810–745 zone
Look for bullish confirmation (candlestick patterns, volume spikes)
Target continuation towards higher weekly levels
BNB remains one of the strongest alts in the current market. Retest = opportunity.
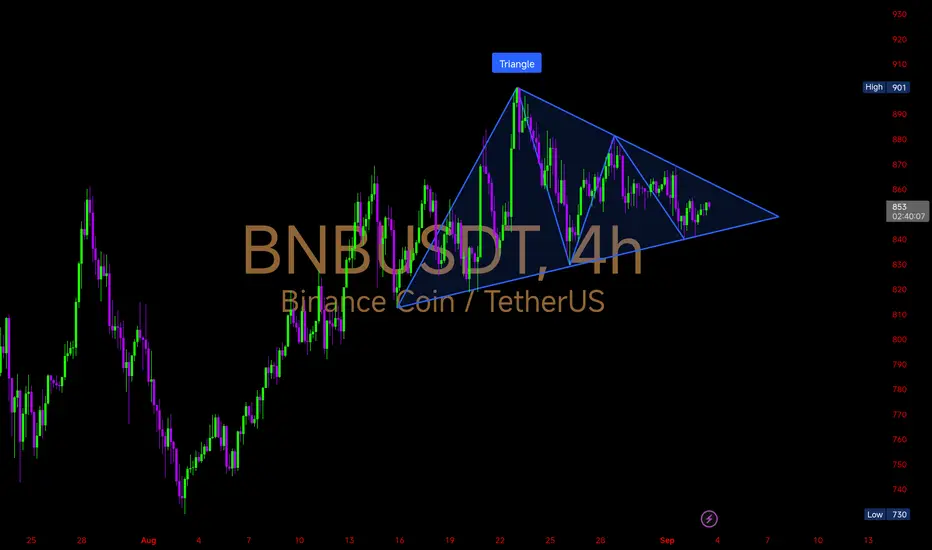
$BNB 4Hr chart Analysis CRYPTOCAP:BNB 4Hr chart Analysis
Price is consolidating inside a symmetrical triangle after the strong rally toward $901. This pattern signals a big breakout move ahead.
Key Levels
Upside Breakout Zone: $865 → $880 → $900
Downside Support Zone: $845 → $830 → $800
🔹A breakout above $865 could ignite momentum towards $900+, confirming trend continuation.
🔸 If price falls below $845, we may see a correction toward $820–800 before any recovery.
#BNB is coiling tighter. Expect volatility soon — whichever side breaks first will set the direction.
BNBUSDT Rising wedge on 4H TF given breakdown and done retest looking for the target of 820 support around 816-817

$BNB BREAKOUT ALERT! CRYPTOCAP:BNB BREAKOUT ALERT! 🚀
Price has broken out from the 4Hr rising wedge!
Blasting above $829 resistance with powerful bullish momentum — continuation looks locked in! 📈
🎯 Targets: $850 → $880 → $920 → $1000
🛡️ Key Support: $815 (hold above = strong upside push)
Bulls in control 🐂 — dips likely to get eaten FAST! ⚡

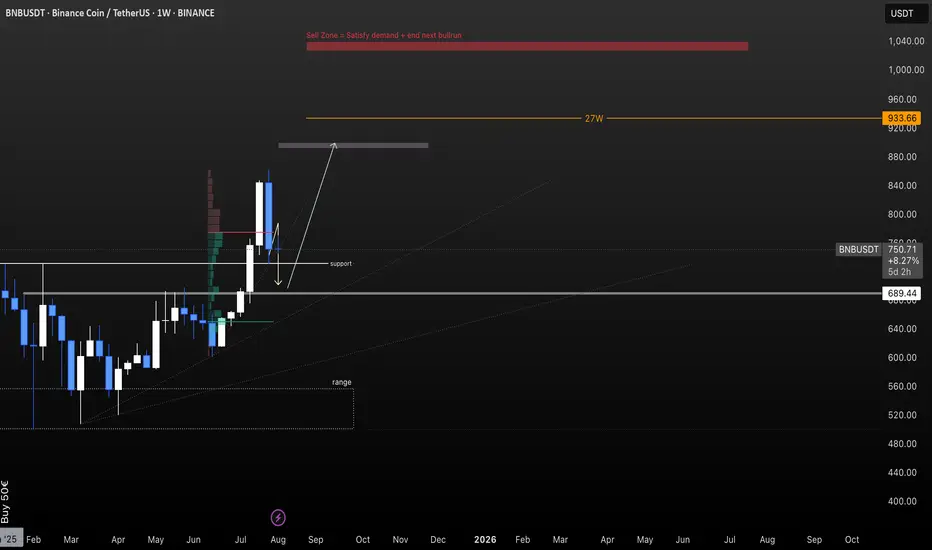
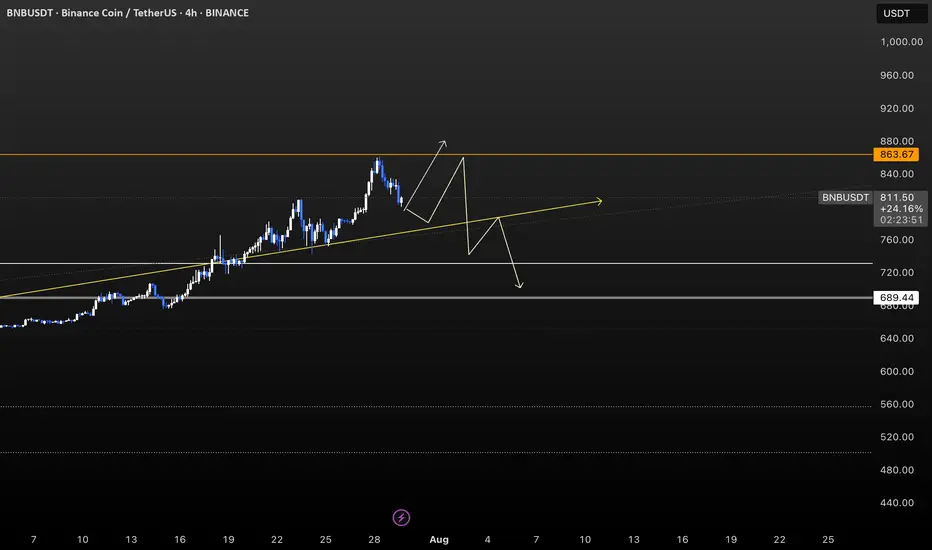
FOLLOW: BNB Analysis Due to macroeconomics factors the price didn't reach the upper level target but continued in a downtrend, without recovering the buyers' levels.
The bearish momentum recovers at 0.382 fibo level and I expect a final downtrend before reaching the new maximum.
The last sell fibo levels coincide with the support (670-690) which indicates a interesting entry area since anew recover may occur.
The last target, around 670 USDT, will indicates a returning to the normal price channel of BNB, concluding the head-shoulders shape but breaking the June's uptrend, and probably resulting in a short-time range.
At the same time, if the price reaches this area, it breaks the daily uptrend line, and may led to the new minimum, 650-600. But this need to be carried by a bearish altcoin season.
This will exhaust the sellers' demand. A new uptrend cycle may be induced, also supported by the positive fundamentals and geopolitical opinion. We can't let our analysis relay on this utter demand, due to its affability, but the growing public acceptance is a variable that has to be taken into consideration.
In particular for this coin, BNB.
On the weekly tf, the dupport/target area for sellers coincides with the 0.618 fibo level of June leg up.
If the price regularly consolidates at 0.618, the new maximum can be between 933 and 1040.
This will technically indicate a new up trend cycle, always supported by a similar trend of altcoins.
thanks for reading,
M
BNB: FINALLY WE ARE HERE BNB is outstanding performing. The broker coin finally arrived to its historic target 860.0m, at least for my analysis.
The uptrand took a strong momentum in the pas weeks and grows by 43% in one month.
Waiting for a re-bounce at 780.0
Double top probably and first bearish point around 745.
The bullish last target are setted at 880.0.
let's see next days
M
Bullish on BinanceBullish View on Binance
Binance has recently experienced a liquidity sweep, which typically indicates a period of market consolidation and the removal of weaker hands. This event often sets the stage for a more stable and sustained upward movement. Here are a few reasons to maintain a bullish outlook on Binance:
Strong Market Position: Binance remains one of the largest and most trusted cryptocurrency exchanges globally. Its extensive user base and high trading volumes provide a solid foundation for future growth.
Innovative Offerings: Binance continues to innovate with new products and services, such as Binance Smart Chain (BSC), which has gained significant traction in the DeFi space. This innovation attracts more users and increases the platform's utility.
Regulatory Compliance: Binance has been proactive in addressing regulatory concerns and enhancing its compliance measures. This approach not only mitigates risks but also builds trust among users and regulators.
Strategic Partnerships: Binance's strategic partnerships and acquisitions expand its ecosystem and enhance its market presence. These collaborations often lead to new opportunities and increased adoption.
Market Sentiment: Following the liquidity sweep, the market sentiment around Binance appears to be stabilizing. With the weaker hands out, the remaining investors are likely more committed, which can lead to a more gradual and sustained price increase.
This perspective highlights the strengths and potential of Binance, suggesting that the platform is well-positioned for future growth despite recent market fluctuations. What are your thoughts on this outlook?

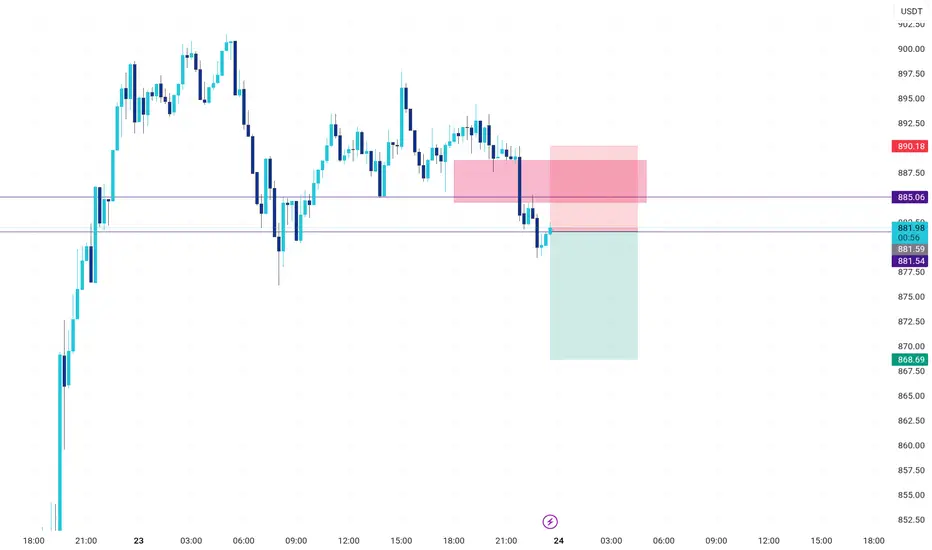
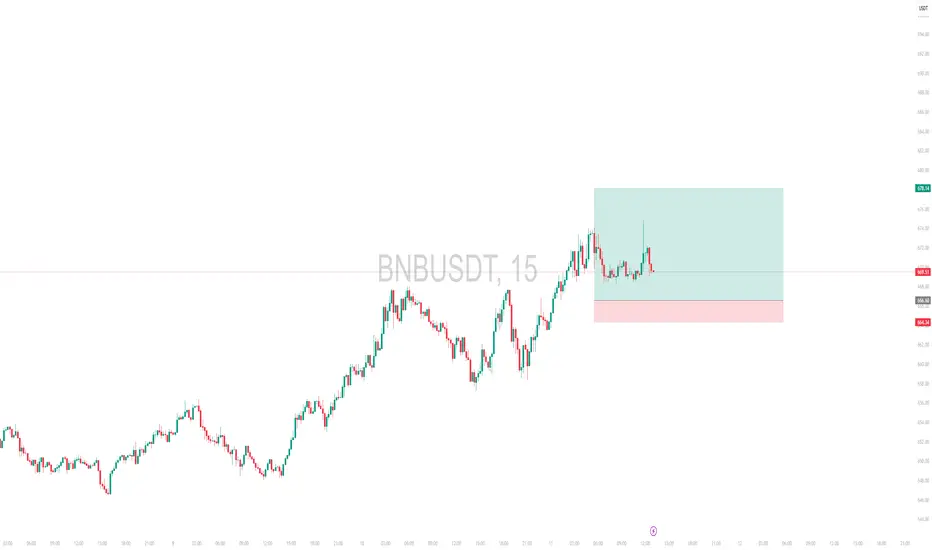
Intraday Long Setup | June 11th 2025 | Valid Until Daily ClosePrice is retracing to a strong pivot zone.
Structure remains bullish with potential for continuation after pullback.
Tight risk control.
Watch for price reaction within the red zone. Entry only if confirmation appears
The setup expires at end of the daily candle close.
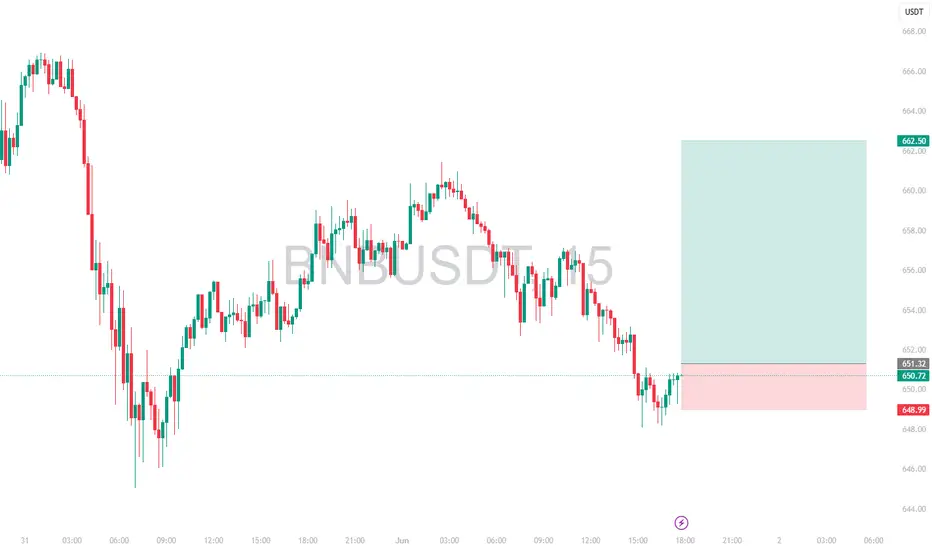
Intraday Long Setup | June 1st 2025 | Valid Until Daily ClosePrice has retraced to a strong pivot zone (marked by the red box).
Structure remains bullish with potential for continuation after pullback.
The green box represents a high-probability long opportunity with tight risk control.
Watch for price reaction within the red zone. Entry only if confirmation (e.g., bullish engulfing, strong wick rejections) appears.
The setup expires at end of the daily candle close.
Will BNB hit $5000 in future?Back in 2020, I said GETTEX:BNB will hit $500 when it was just $16… and y’all laughed. 🤡
But guess what? It didn’t just hit $500… it went all the way to $800—a 50x from my entry! 😎💰
And yeah, right after I entered, GETTEX:BNB dumped almost 62%! 💀😂 But diamond hands win in the end! 💎🙌
Now, it won’t even drop below $500! 😏
Just wait… GETTEX:BNB → $5000 is only a matter of time! ⏳🚀
Not financial advice, so don’t blame me later. DYOR! 😆


Mkt Weak, Towards Shortit's looking weak at high
it has not hold properly at any higher level
Looks More Towards Bear Side

Plan Short on BNB/UsdtWait for two consecutive candle close below swing low or Higher low (under the line ) then on retracement you can plan Sell trade on candelstick confirmation
